In an ecosystem, a niche overlap gives rise to competition. In a plant community, intra- or interspecific competition for resources usually occurs. Many studies of this theme have been carried out (Aerts 1999, Maina et al. 2002, Kisdi and Geritz 2003, Bittebiere et al. 2012). According to these studies, the root systems compete for nutrients or water, and the shoot systems compete for sunlight (McPhee and Aarssen 2001). Moreover, basedon the game theoretical model, plants growing alone should rapidly grow their roots until the marginal return and the cost of new roots is equal to each other (Gersani et al. 2001). Beside the game model, other diverse models predicting the result of competition between two populations have been proposed (Hara 1993, Damgaard 1998, 2003, Hamidi et al. 2012). These models revealed that the asymmetric competition of shoot systems for sunlight could be estimated based on the plant sizes; but the symmetric one could not (Hara 1992, Nevai and Vance 2007, 2008). The plant competition can also be estimated by non-destructive pin-point data (Damgaard et al. 2009). Because the competition for sunlight forces the plant to invest more energy into the shoot system, the shoot sizes of plants growing under competition and the ones growing alone are similar (Firbank et al. 1993, Law et al. 1993, Berendse and Möller 2009). For this reason, the competition of root systems between individual plants is defined as a mathematical function of the biomass while the competition of the shoot systems is a function of the density (De Kroon 1993, Just and Nevai 2008). At the same time, microenvironments as well as individual’s competitive ability affect the outcome of competition. Therefore, to exactly understand the cause and effect of competition between individuals, abiotic and biotic data are needed. Wetlands or salt marshes show unique physical environments unlike terrestrial environments. Thus, salt concentration and water content greater than those of terrestrial settings can alter a competition regime between the two species (Bertness and Shumway 1993, Dickinson and Miller 1998, Giblin et al. 2010).
In Korea, the area of tidal flat is broad and various studies of the coastal ecosystem have been carried out. Suncheon Bay is one of the coastal ecosystems with large area, high species diversity, and beautiful landscape. On these merits, Suncheon Bay was designated as conservation district by several institutions. The Ramsar Convention designated it as Wetlands of International Importance in 2006; the Cultural Heritage Administration as a Beauty Spot; the Ministry of Ocean and Fisheries as Wetlands Conservation Area (Jang and Cheong 2010, Seo et al. 2012). Moreover, the area in which
The aim of this study was to clarify the cause of coexistence of small
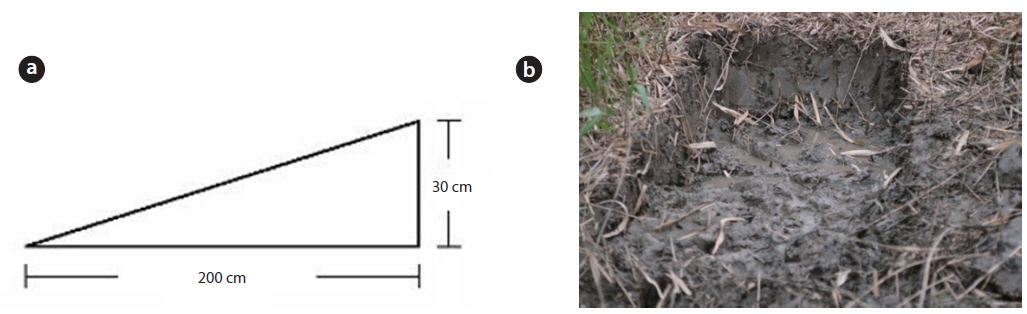
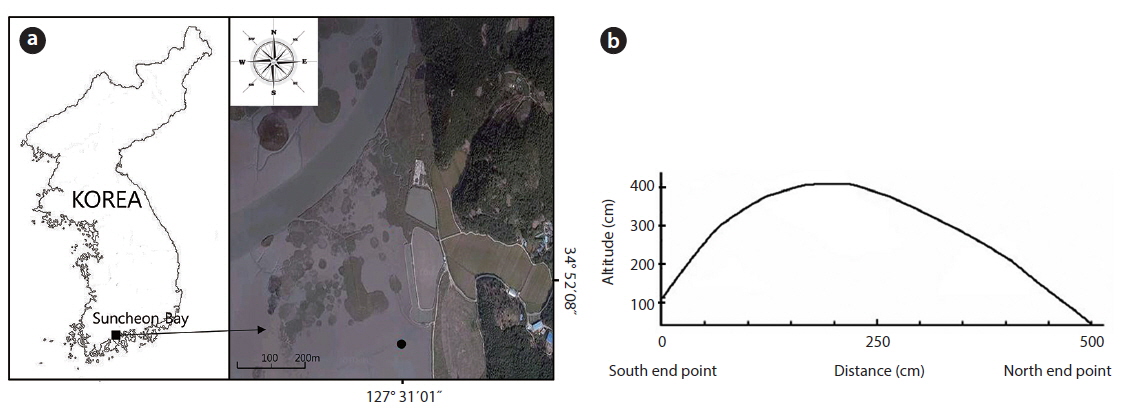
The study area was located on a tidal flat in the Suncheon Bay, Nongju-ri, Byeolryang-myeon, Suncheon-city, Jeonnam Province, Korea (34°51′59.04″ N, 127°31′02.26″ E) (Fig. 1). At the time of full moon on a tide table on May 28, 2010 (http:/www.khoa.go.kr/info/tide/YEOSU), a 50 cm ruler was set at the dug area and height was checked at the maximum and the minimum. The highest altitude of the mound was 41 cm from the peripheral natural tidal flat. The tidal flat was inundated at the time of 110 cm tide level. The mound studied over 37 cm in height was not inundated at the time of ordinary full moon. This mound was an artificially constructed tidal flat for using as a saltpan in the past. The mound was divided into three districts as follows. In the first district, three quadrats (50 cm × 50 cm) were randomly located and the shoots of the two species were sampled monthly. The shoots in each unit area were cut to measure the plant size (its height and dry weight) during the growth season. To check the biomass of the root system (rhizomes and roots) along the sediment depth, three quadrats (50 cm × 50 cm) were located at the highest site and at the lowest site; root system was dug out in 10 cm interval from the sediment surface to 80 cm in depth of the sediment. In the second district, density and biomass were periodically checked along the altitude of the mound. Permanent quadrat of 1 m × 5 m was located crossing the mound from a starting point in the south to the ending point in the north section. The permanent quadrat was divided into ten 1 m × 50 cm subquadrats along the distance (50 cm interval) from the south starting point. In these subquadrats, all shoots of the two species counted monthly and cut at the end of the growth season annually. Of the ten subquadrats, the first and the last one were the lowest and the fifth one was the highest in altitude. The lowest subquadrat was inundated by seawater at a 110 cm tide level twice a day. The highest subquadrat was at a 410 cm tide level and not inundated by seawater. In the third district, the mound was removed to the level of tidal flat on May 5, 2010, to create the experimental site (Fig. 2). The dimensions of this site were 1 m wide, 1.4 m long, and 30 cm high at the maximum. The shoots of the two species were monitored for 4 years. Height and dry weight of all shoots were measured per plant. The root system was washed by tap water, then dried at 80ºC in a dry oven, and weighed.
>
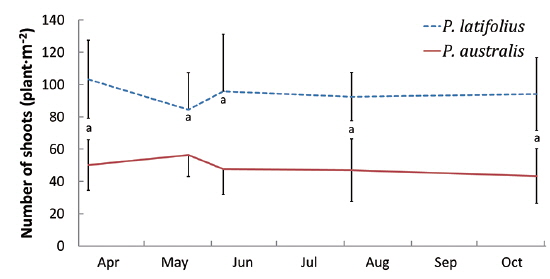
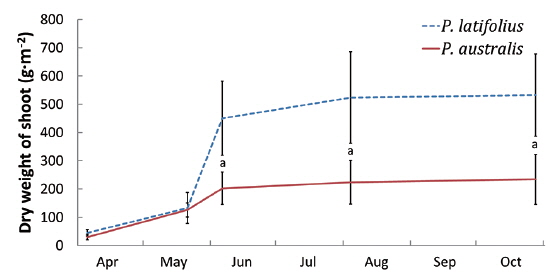
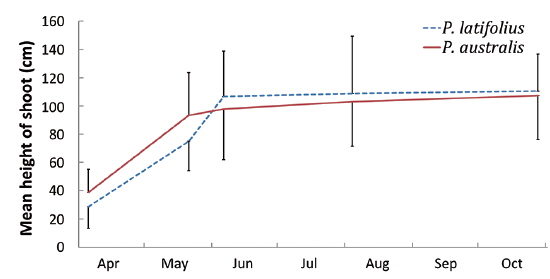
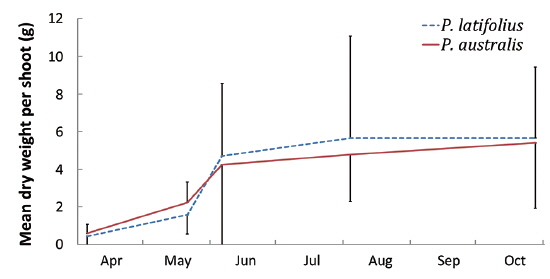
Size and density of the two species
The mean density of
>
Distribution of the two species along the altitude and cutting effect of shoots
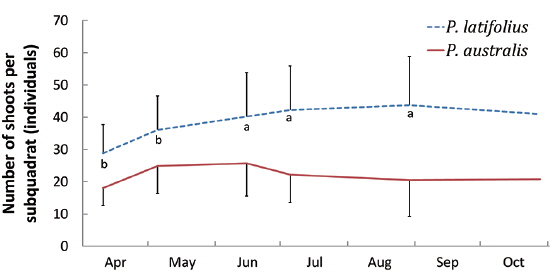
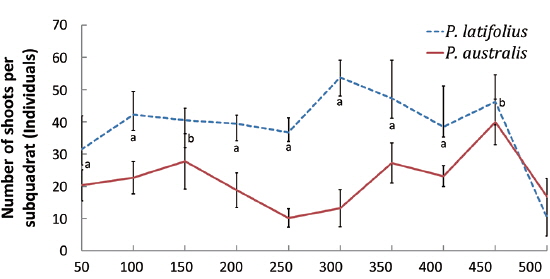
The densities of the two species ona mound changed with time elapsed. Maximum density (individuals per 100 cm × 50 cm subquadrat) was 43.7 ± 15.1 on August 29, 2010, for
The cutting of the shoot sat the end of the growth season affected the next year’s biomass of the two species (Table 1). Total densities (shoots/quadrat), mean heights (cm), and total dry weights (g) of
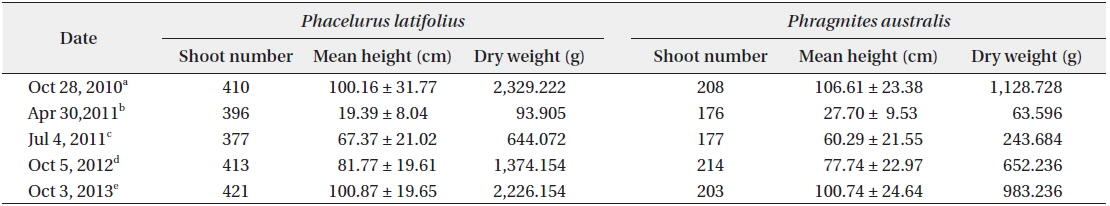
After cutting, total shoot number, mean height and dry weight of the two species at all permanent quadrats (1 m × 5 m)
>
Distribution of root system with the sediment depth
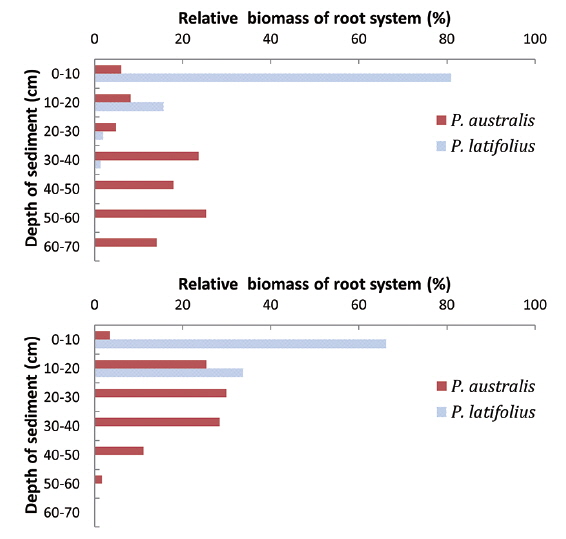
The lowest level that the root systems penetrated was different between the two species (Fig. 10). The root systems of
>
Germination of the two species at the new experimental site
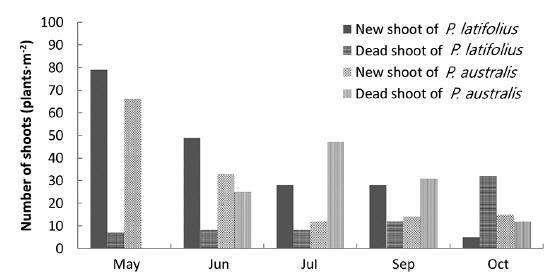
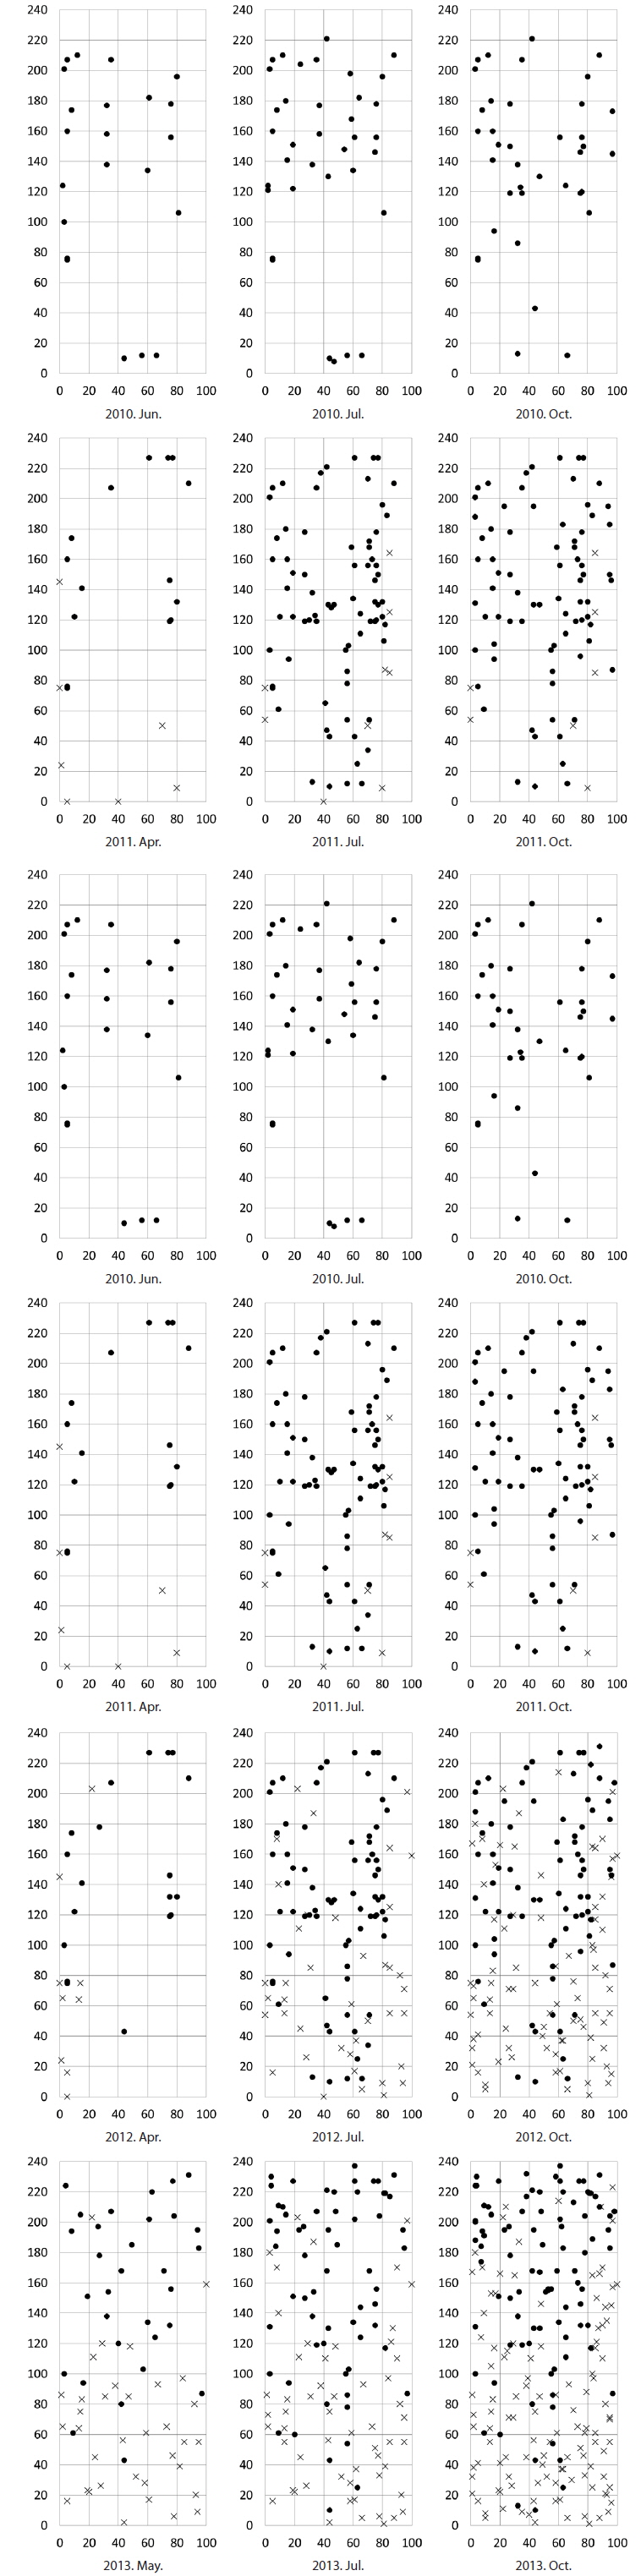
In the area where the mound was removed on May 5, 2010, the number of shoots was higher for
The following conclusions can be made based on the above results. Firstly, since the mean heights and dry weights of the two species were similar, the two species competed for the sunlight but one was not superior to the other. Generally, competition for sunlight between two perennial herbs results in similar height, so that vegetation forms one layer (De Kroon 1993, Hara 1993). Next, the competition between two species can be assessed by dry weight (Connolly et al. 2001, Connolly and Wayne 2005, Laird and Aarssen 2005). However, the mean dry weight of
Secondly, in the permanent subquadrat, the density was predominantly higher for
Thirdly, cutting of the shoots in the early growth season affected the biomass of the root system in the late growth season as well as in the next year, showing that a lot of the photosynthetic energy was allocated to the root system and then transported to the shoots in the next growth season. Typically, perennial herb species allocate more energy to their root systems. However, our results indicated that the biomasses of the two species were affected by cutting of the shoots as well.
Fourthly, the root system of
Lastly, the density was higher for