Biogeographic patterns and environmental drivers of species richness in the globally distributed Millettioid/Phaseoloid clade (Fabaceae, subfamily Papilionoideae)
 Oyetola O. Oyebanji1,2,3†
  Kenneth O. Onditi4
  Josué A. R. Azevedo5,6
  Fabien R. Rahaingoson1,2,3
  Lotanna M. Nneji7† Matthew. A. Adeleye8
  Gregory W. Stull1,2,3
  Rong Zhang1,2,3
  Ting-Shuang Yi1,2,3*
- 1Germplasm Bank of Wild Species, Kunming Institute of Botany, Chinese Academy of Science, Yunnan, China
- 2Yunnan Key Laboratory of Crop Wild Relatives Omics, Kunming Institute of Botany, Chinese Academy of Science, Yunnan, China
- 3University of Chinese Academy of Sciences, Beijing, China
- 4Kunming Institute of Zoology, Chinese Academy of Sciences, Kunming, China
- 5Gothenburg Global Biodiversity Center, University of Gothenburg, Gothenburg, Sweden
- 6Coordenação de Biodiversidade, Programa de Coleções Científicas Biológicas, Instituto Nacional de Pesquisas da Amazônia – INPA, Manaus, Brazil
- 7Department of Ecology and Evolutionary Biology, Princeton University, Princeton, New Jersey, United States
- 8Department of Geography, University of Cambridge, Cambridgeshire, United Kingdom
Introduction: The Millettioid/Phaseoloid (MP) clade of Fabaceae is globally distributed, economically important, and highly diverse, making it an attractive system for studying biogeographic and macroecological patterns at a global scale. We conducted the first global macroecological study to map and explore the environmental drivers of the MP clade's species richness patterns.
Methods: We compiled 116,212 species occurrences (161 genera) for the MP clade and 20 environmental variables (19 bioclimatic variables and elevation). Geospatial analyses were performed to estimate species richness patterns and biogeographic heterogeneity. The effects of environmental variables on the species richness of the MP clade were measured through multiple regression models.
Results: Our study identified the megathermal regions as hotspots of species richness for the MP clade. While species distributions and richness largely fit the latitudinal diversity gradient pattern, there was a significant negative relationship between the species richness of the MP clade along the latitude and longitude. The Afrotropic biogeographic realm had the highest alpha diversity (~36%); in terms of biome types, tropical and subtropical moist broadleaf forests had the highest alpha diversity (25%), while the beta diversity revealed a high dispersal rate and habitat tracking. Furthermore, the species richness was positively influenced by multiple climatic factors, with the mean diurnal range of temperatures and precipitation in the warmest quarter having strongest influence.
Discussion: Overall, the staggering species richness patterns could be explained by multiple diversity gradient hypotheses. Particularly, colder climates play a crucial role in shaping the species richness pattern by limiting the ecological opportunities for MP clade species in the higher latitudes of the Northern Hemisphere. This suggests that the species richness patterns of the MP clade can be described as "when dispersal meets adaptation." Our study provides a new basis for identifying priority regions for conservation of legumes.
1 Introduction
Global species richness patterns are notably uneven, and the underlying mechanisms for this spatial heterogeneity are still debated for many taxa across geographical scales (Wiens, 2011; Tietje et al., 2022). These species richness and diversity dynamics are quantified using two main diversity indices—alpha (α-diversity) and beta (β-diversity). Unequivocally, there is an indication of the potential influence of habitat filtering and bioclimatic variables such as temperature and precipitation shaping the global patterns of distributions and species richness of several plant groups (Kreft and Jetz, 2007; Mittelbach et al., 2007; Saupe et al., 2019; Tripathi et al., 2019; Hurtado et al., 2020; Huang et al., 2021). However, the relative importance of these factors is scale dependent as the underlying drivers vary across taxonomic groups and regions. It is thus imperative to identify the most important environmental variable that predicts species richness for distinct clades and how species richness vary across biogeographic realms and biomes along latitude. This holistic understanding is essential as it remains fundamental to ecology, evolution, and conservation fields (Socolar et al., 2016; Pontarp et al., 2019; Fontana et al., 2020; Zizka et al., 2020; Chartier et al., 2021; Sabatini et al., 2022).
The latitudinal diversity gradient hypothesis suggests species richness decreases from the equator (mid-latitude) to the higher latitudes, i.e., peaks in the tropics (Schluter, 2016; Pontarp et al., 2019). However, there are exceptions where the latitudinal diversity gradient is either inverted (i.e., species richness peaks in temperate regions) or flattened (i.e., species richness remains the same across the tropic and temperate regions) (Mannion et al., 2014). In nearly all cases, five hypotheses are commonly used to explain the underlying mechanisms driving the latitudinal diversity gradient patterns (Mittelbach et al., 2007; Behera and Roy, 2019; Brodie and Mannion, 2022). The energetic limits hypothesis supports greater species richness in the lower latitudes due to higher energy availability, e.g., abundant water, and solar energy for plant development (Etienne et al., 2019). The historical perturbation hypothesis, proposes that species richness is low in higher latitudes due to perturbations such as glaciations that prevented species from (re)colonizing those areas (Gaston and Blackburn, 2000). For the Tropical conservation hypothesis, diversity is associated with temperature or seasonality coinciding with the diversification of taxonomic families under warmer conditions in the early-middle Eocene [ca. 56–40 million years ago (Mya)] (Romdal et al., 2013). The enhanced diversification hypothesis supports that temperature and seasonality dynamics can influence diversification rates. While in the case of the climate stability hypothesis, a stable environment can allow species to specialize in reliable resources. These hypotheses have been used to explain the species richness along the latitudinal gradients for several plant groups, e.g., Ericales (Chartier et al., 2021), Medicago L. (Yang et al., 2022), and multiple plant species (Behera and Roy, 2019; Fontana et al., 2020; Sabatini et al., 2022), but have not been fully understood for many other taxa.
Fabaceae is one of the well-known successful angiosperm families with approximately 22,000 species (LPWG, 2022). Fabaceae originated at ca. 67 Mya near the Cretaceous/Paleogene boundary (Zhao et al., 2021), and occupy nearly all global ecosystems (Lavin et al., 2005; Lewis et al., 2005; LPWG, 2022). Previous studies focusing on species distribution modeling based on biogeography (De La Estrella et al., 2012), endemic species (Oyebanji et al., 2021) and habitat restricted species (Salako et al., 2021) have revealed the response of the legumes under different climatic scenarios. Recent studies have also provided insights into the role of environmental variables in predicting the global species richness patterns of Fabaceae (Zhao et al., 2022). For instance, in Medicago L., Yang et al. (2022) found a contrasting effect of environmental energy in temperate and tropical biomes, with species richness increasing with energy in the temperate and decreasing in the tropics, hence limiting its distribution in the tropic region. Previous macroecological studies in Fabaceae have been divisive due to its vast number of species. Hence, we still lack a comprehensive understanding of the key environmental factors influencing the species richness patterns of some clades, particularly the Millettioid/Phaseoloid (MP) clade.
Currently, the MP clade comprises over 3,000 species belonging to six traditionally defined tribes—Abreae, Desmodieae, Indigofereae, Millettieae, Phaseoleae (including tribe Diocleeae sensu de Queiroz et al., 2015), and Psoraleeae. Many species of this clade have extraordinary economic importance, especially for agriculture (e.g., species of Phaseolus L., Glycine Willd., and Vigna Savi) and medicine (e.g., species of Abrus Adans. and Cajanus Adans). However, while the MP clade arose during the Paleocene in the tropics (Zhao et al., 2021) and has adapted to diverse ecological settings worldwide (Lewis et al., 2005), the species richness across regions and global biomes diversity (α- and β-diversity) are yet to be explored. Again, the gross relative impacts of environmental variables [bioclimatic variables and elevation] on the species richness patterns of the MP clade lack scrutiny. Therefore, more comprehensive analyses are needed to decipher how the species richness varies along geographic gradients and decouple the environmental variables driving its present-day species richness pattern.
Here, we sampled the global distribution of 116,212 occurrence data to explore the macroecological settings of the MP clade and its six tribes. Specifically, we addressed four main questions:
(1) Where are areas of high species richness for the MP clade? We predict the tropical region to have a higher species richness than the temperate region due to the favorable climatic conditions. Broadly, the species richness of the MP clade in the Southern Hemisphere is expected to be higher compared to those of the Northern Hemisphere.
(2) Does the global distribution and species richness of the MP clade follow a latitudinal diversity gradient? Due to the known high dispersal rate of the species of the MP clade, we hypothesize: (i) weak or flat latitudinal gradient diversity and (ii) negative correlation between the geographical gradient (across latitudes and longitudes) and the species richness. In contrast, we expect different correlation patterns between the geographic gradients and species richness patterns of the MP clade tribes.
(3) How does the species richness of the MP clade differ across the biogeographic realms, biomes and ecoregions? The MP clade represents a coherent group with novel traits for adaptation. We expect the colonization of all delimited ecoregions and biomes, especially tropical biomes. Additionally, we seek to explore global species richness patterns (α-diversity) and variations among the biomes (β-diversity).
(4) Which environmental factor drives the species richness of the MP clade? We expect the bioclimatic variables to be stronger predictors of the species richness pattern compared to elevation because the MP clade species are born migrators. Additionally, we expect that the environmental variables with the strongest predictive influence will vary between tribes.
2 Methods
2.1 Species occurrence records
We compiled the genera and species for the six tribes of the MP clade (Abreae, Desmodieae, Indigofereae, Millettieae, Phaseoleae, and Psoraleeae) from primary literature (e.g., Wojciechowski et al., 2004; Lewis et al., 2005; de Queiroz et al., 2015; LPWG, 2017; Ohashi et al., 2018). We also explored online databases such as Plants of the World online (https://powo.science.kew.org/); World Flora Online (https://wfoplantlist.org/plant-list/); International Legume Database & Information Service (http://www.ildis.org/LegumeWeb/); Legume Data Portal (https://www.legumedata.org/taxonomy/papilionoideae/) and The Families of Flowering Plants (Watson and Dallwitz, 1999). We assembled occurrence records using the spocc R package v. 1.2.0. (Chamberlain et al., 2016) and note that where no records were obtained using spocc, Global Biodiversity Information Facility (GBIF) was used to curate the occurrences manually (GBIF.org, 2022; https://doi.org/10.15468/dl.5wjbnz). For instance, 10 genera (e.g., Campylotropis Bunge, Dipogon Liebm., Eminia Taub, Flemingia Wight & Arn., Millettia Wight & Arn., Mecopus Benn., Oxyrhynchus Brandegee, Phaseolus L., Platycyamus Benth., and Rhodopis Urb.) were manually curated from GBIF, thus allowing us to retrieve occurrence data for species. As a result, we initially extracted and assembled a total of 1,857,986 occurrence records for 201 genera.
We employed various methods to overcome the problem of incomplete data due to spatial and taxonomic errors (e.g., Zizka et al., 2019). First, the data were filtered to retain records under the family Fabaceae, those with only geographical coordinates, and those labeled as preserved specimens resulting in 187 genera with a total of 538,400 occurrence records for the MP clade (Table S1.1 in Supporting Information S1). The second approach involved the cross-validation and removal of spatial outliers using the R package CoordinateCleaner v. 2.0.9 (Zizka et al., 2019). The CoordinateCleaner is an automated approach that can detect and remove potential geographical biases from occurrence data (Maldonado et al., 2015; Zizka et al., 2020) and was performed by excluding: (1) records without geographic coordinates; (2) duplicated coordinates and scientific names from the same locality; (3) records in the sea; (4) points assigned to country and province centroids; and (5) records with low (< 1 km) coordinate precision. Finally, the taxonomic identification was performed using the kwer R package (Walker, 2021). The package automatically reconciles taxon names (including accepted genera, species, subspecies, and variety) with taxonomic databases such as Plants of The World Online, International Plant Names Index, and World Checklists of Vascular Plant. Additionally, International Legume Database & Information Service database was also explored to substantiate taxonomic nomenclatures in some cases. This resulted in 116,212 records comprising of species, subspecies, and varieties) from the MP clade which represented approximately 80% (161 genera) of the genera (Supporting Information S1).
2.2 Environmental data
We derived environmental data for climatic variables and elevation. For the climatic variables, we used 19 bioclimatic variables from CHELSA v. 2.1 (Climatologies at High resolution for the Earth Land Surface Areas (https://chelsa-climate.org/) (Karger et al., 2017) while elevation data was extracted from NASADEM Merged DEM Global 1 arc-sec V001 (NASA, 2020). To ensure that the variables had similar spatial resolutions, the extracted raster layers were resampled to 30 arc-sec in QGIS (QGIS Development Team, 2021). We then performed variable selection using the function “select07_cv” in R package mecofun v.0.1.9000 (Zurell et al., 2020), which automatically drops the highly correlated variables (Spearman’s rank correlation coefficient > 0.7) after cross-validation of their univariate importance on model responses. Finally, 11 variables were retained for the analyses—10 bioclimatic variables and elevation (Supporting Information S2).
2.3 Estimation of species richness and mapping
The occurrence records of each species from the MP clade (using tribe level grouping) were used as presence–absence points to estimate species richness and the distribution patterns of the MP clade and its tribes. First, 10 × 10-degree grids were generated over the global distribution extent and masked to land areas. The grids were then joined to the mapped species occurrences based on spatial attributes using the Join Attributes by Location tool in QGIS v.3.22.11 LTR (QGIS Development Team, 2021), which generated records of all species occurring in each grid. The resulting layer was used to generate site(grid)-by-species richness/abundance matrices using the R package fossil v.0.4.0 (Vavrek, 2011). The matrices were used to estimate species richness in each grid using the “specnumber” function in R package vegan v.2.6-2 (Oksanen et al., 2022). Further, grid(raster)-based maps of species distribution were estimated using the R package speciesgeocodeR v.2.0-10 (Topel et al., 2017). We also examined the spatial homogeneity and heterogeneity of species abundance across latitudes using the Squared Chord Distance (SCD) dissimilarity metric in the analogue v. 2.0 R package (Simpson and Oksanen, 2021).
2.4 Species richness patterns in biogeographic realms, biomes, and ecoregions
We constructed the global biogeography (ecoregion, realms, and biome) for the MP clade and inferred the species richness pattern. Eight biogeographic realms and fourteen biomes were defined according to Dinerstein et al. (2017) (https://ecoregions.appspot.com/; Supporting Information S3). Species diversity (abundance and richness) in the realms and biomes were generated to gain the understanding of the composition and distribution patterns. Thereafter, we quantified the α-diversity of each biome by estimating the species richness and pairwise β-diversity to investigate the species compositional variations. For the β-diversity dissimilarity, we used the Betapart v.1.5.6 R package (Baselga, 2010; Baselga, 2012) to calculate spatial turnover (replacement)—measured with Simpson pairwise (turnover), nestedness-fraction—measured with Sorensen pairwise (nestedness), and total dissimilarity—measured with Sorensen pairwise (total dissimilarity) (Tables S3.1–3.9 in Supporting Information S3). The sum of the turnover and nestedness described the total dissimilarity and the value is scaled between 0 and 1; the closer the value to 1, the higher the dissimilarities between the biomes. The turnover dynamics is high when the proportion of species shared between two areas is low, and when the proportions of species lost and gained from one area to the other are similar (Koleff and Gaston, 2002).
2.5 Statistical analyses
All statistical analyses were performed in R (R Core Team, 2023). To determine if the distribution of the MP clade and its tribes followed a typical latitudinal diversity gradient pattern, associations between species richness and latitude were inferred from Generalized Additive Models (GAM) based on smoothed conditional means and the trend lines were visualized using the R package ggplot2 v.3.3.6 (Wickham, 2016). This approach allowed us also to estimate the geographical range limits of the studied taxa along the latitude and longitude (Supporting Information S4). Further, we used multivariate regression analysis to test the effects of geographical gradients and the selected environmental variables on the species richness patterns for the six tribes and when combined. For this, we first used variation inflation factor (VIF) analysis to eliminate multicollinearity (VIF < 7) among the environmental variables; high collinearity can violate assumptions of independence of model predictor variables (Chatterjee and Hadi, 2006). Then, we applied model selection and averaging to find the best combination of the environmental variables that explained the species richness variances of the MP clade. The model selection involved generating all possible models through exhaustive screening based on main effects using the automated model selection and multimodel inference ranked with corrected Akaike Information Criterion (AICc) as implemented in the glmulti v.1.0.8 R package (Calcagno, 2020). Because several best models (multiple top-ranked models whose performances were not significantly different) were generated, we performed model averaging for all models with delta AICc (ΔAICc) values < 2 (Anderson and Burnham, 2004). The details of the summarized models and comparisons among the different data sets are presented in Supporting Information S5. The resulting averaged models were utilized to fit negative binomial Genralized Linear Models (GAM) with the function “glm.nb” in R package MASS v.7.3-55 (Venables and Ripley, 2002) to infer the association between species richness and the selected environmental variables (bioclimatic and elevation). Both latitude and longitudinal gradients were used as explanatory variables. A positive coefficient of relationship from the model output indicated that as the value of the independent variable increased (here, environmental variables), the mean of the species richness also increased. In contrast, a negative coefficient of relationship suggested that the species richness decreased as the independent variable increased (Supporting Information S5). All the statistical significances were determined based on three probability levels: p < 0.05, p < 0.01, and p < 0.001. In addition, the relative importance of the 11 environmental variables’ association with model-explained species richness variances were estimated and scaled to 100% for comparative purposes.
3 Results
3.1 Species richness pattern
The areas of high species richness for the MP clade vary within the megathermal regions—America (e.g., Brazil, Costa Rica, El Salvador, Nicaragua, and Panama), Africa (e.g., South and West, and Madagascar), East Asia (e.g., East China, Japan, and South Korea), and Australia (e.g., North and Queensland) (Figure 1; Supporting Information S4). The MP clade occupies the Old and New World (longitude −178.13° S to 179.43° N: latitudes −43.64° S to 64.12° N) but at different species richness peaks. While all the tribes have high species richness in the low to mid-latitude, the Phaseoleae and Psoraleeae slightly extended species richness to the high latitude (ca. 64°) in the Northern Hemisphere. The species richness for all the tribes is spatially higher in the tropics than in the temperate region (Figure 1B). The turnover analyses showed a heterogenous species richness of the MP clade across latitudes with peaks in some temperate regions (Figure 1C).
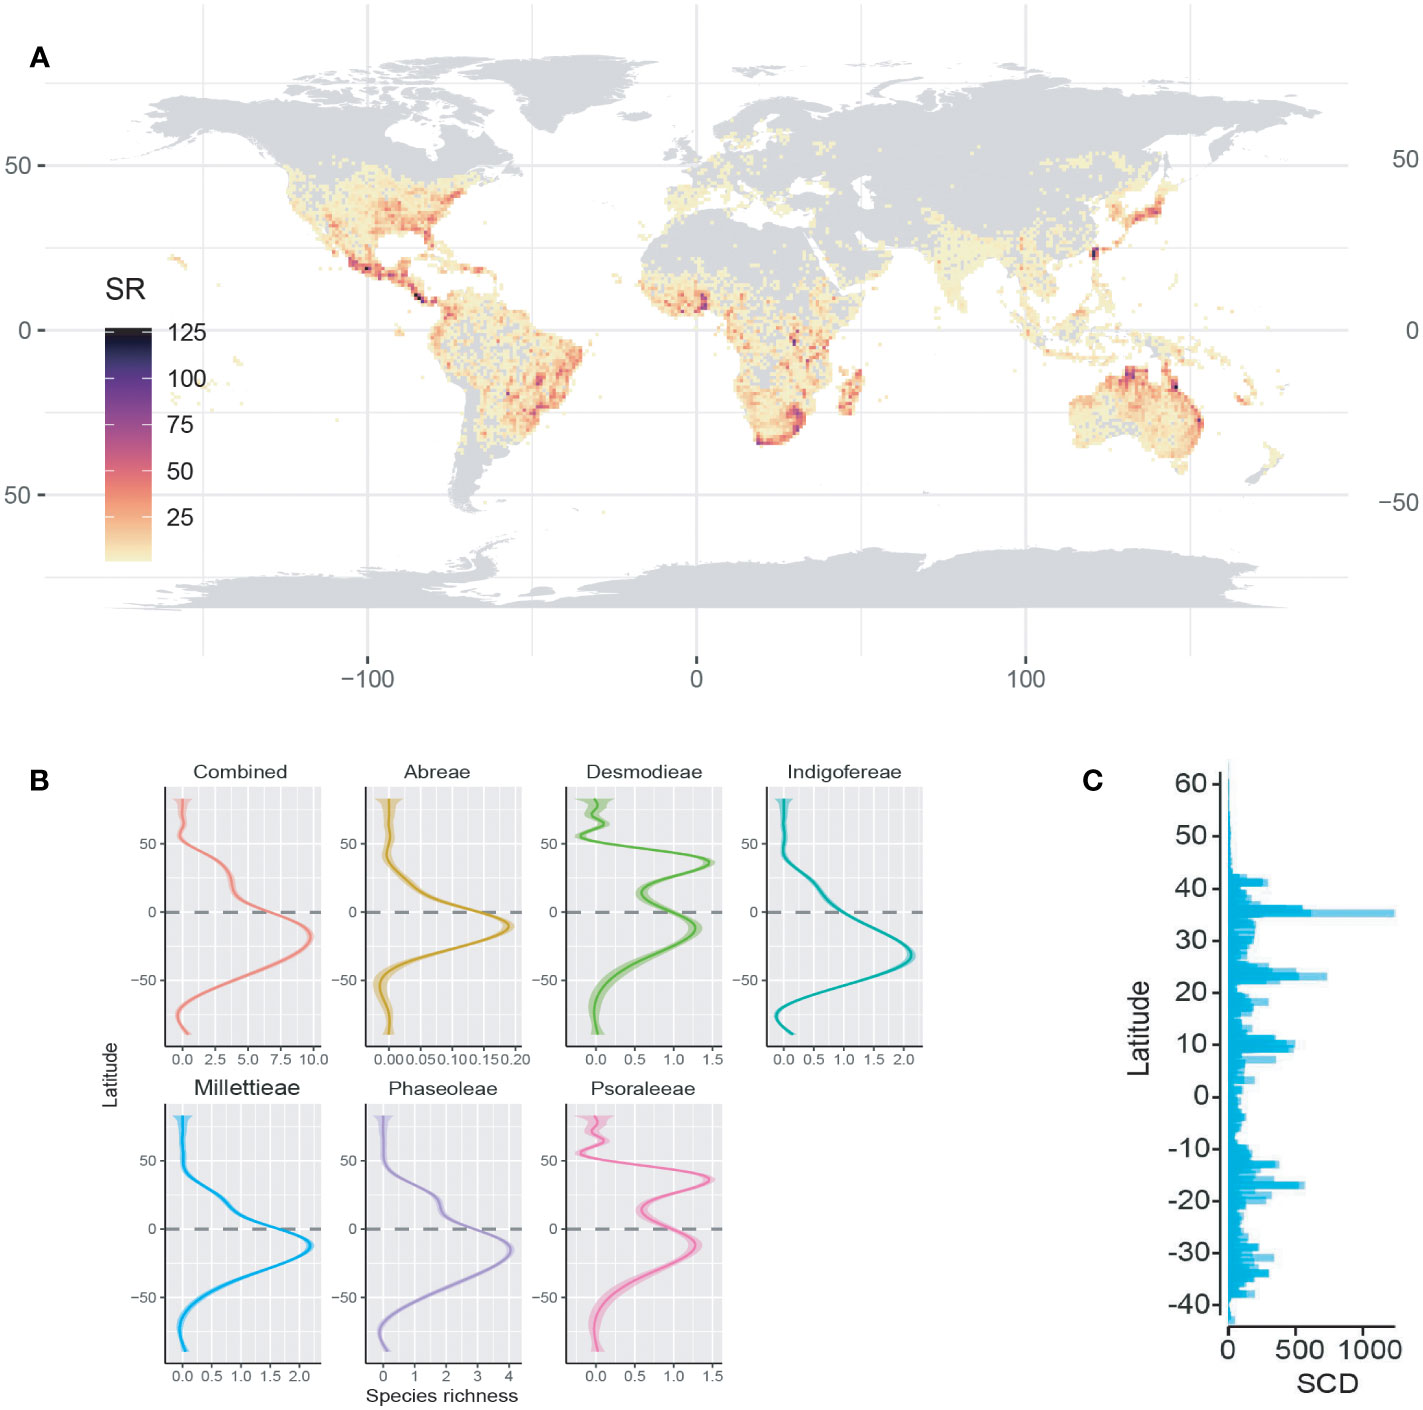
Figure 1 Species richness pattern of the MP clade and its tribes. (A) The global species richness map of the MP clade. (B) Regression (generalized additive model) trend lines of species richness variance across latitudes. (C) Squared Chord Distance (SCD) bar plots showing the turnover (spatial heterogeneity) of species abundance across latitudes.
3.2 Species richness along the latitude and longitude
The observed species richness pattern of the MP clade largely followed the latitudinal diversity gradient pattern i.e., higher in the tropics than the temperate zones. The species richness of the MP clade and its tribes along the latitudes and longitudes was mostly statistically significant (Figures 1B, 2; Table 1). The latitudinal gradient had a positive predictive influence for the Desmodieae and Psoraleeae, contrasting the negative predictive effect on Abreae, Indigofereae, Millettieae, and Phaseoleae. For longitudinal gradient, we found negative effects on Desmodieae, Phaseoleae, and Psoraleeae and positive effects on Abreae, Indigofereae, and Millettieae. However, the observed positive influence on the species richness of Abreae and Millettieae along the longitude was not significant. When combined, there was a significant negative relationship between the species richness of the MP clade along the latitude and longitude.
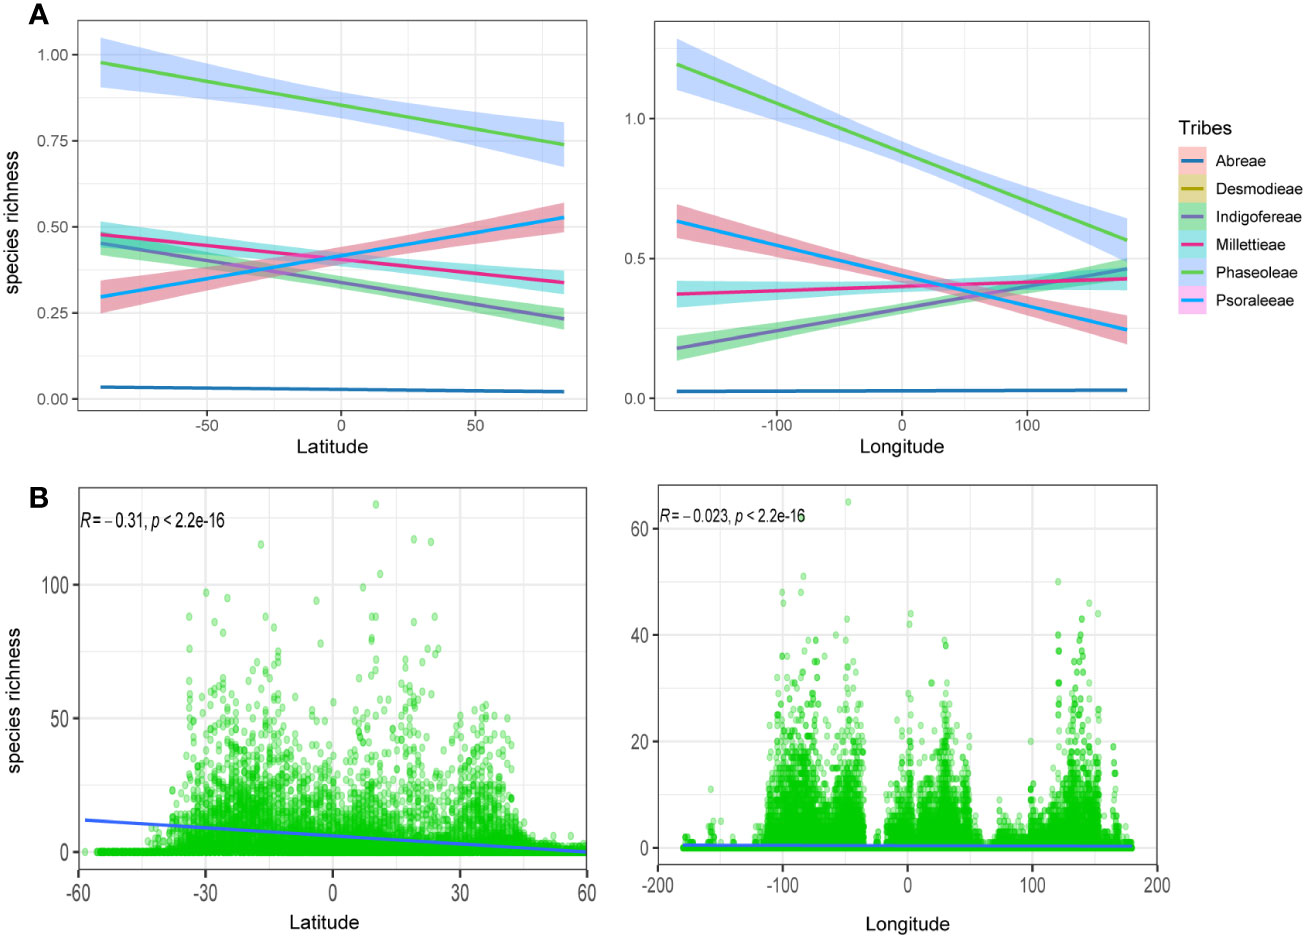
Figure 2 Species richness variation along the latitude and longitude. (A) Species richness for the tribes along the latitude and longitude—positive correlation for the tribes Desmodeae and Psoraleeae. (B) Species richness for the whole MP clade along the latitude and longitude is negative and significant.
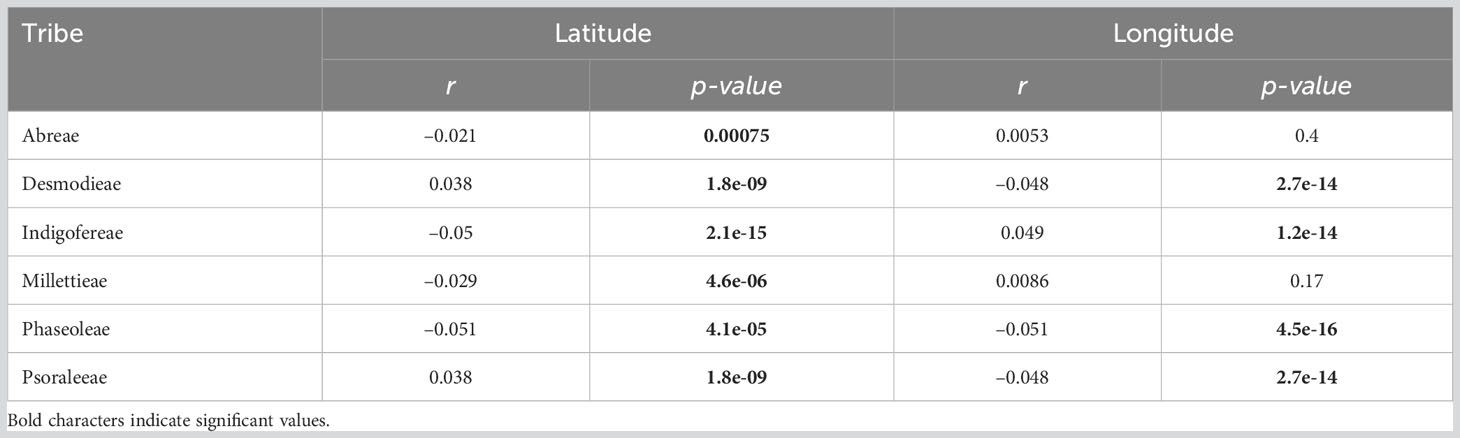
Table 1 Effects of latitudinal and longitudinal gradient on the species richness patterns of the MP clade.
3.3 Biogeography and biome species richness patterns
The species of the MP clade are distributed in all realms except the Antarctic and Psoraleeae lacking occurrence in the Oceania (Figures 3A–C; Table S3.1 in Supporting Information S3). The realms with the highest percentage species richness (α-diversity) were the Afrotropic (~ 36%) and the Neotropics (~ 26%), which accounted for more than 50% of total species richness while Oceania (~ 1%) had the least. The tribe Psoraleeae had the highest species richness in Oceania (~ 38%) and Desmodieae in the Neotropics (~ 26%). While the Afrotropic harbors high species richness of the tribes Millettieae (~ 40%), Abreae (~ 50%) and Indigofereae (~ 66%), Phaseoleae is highest (~ 32%) in the Afrotropics and Neotropic with marginal differences.
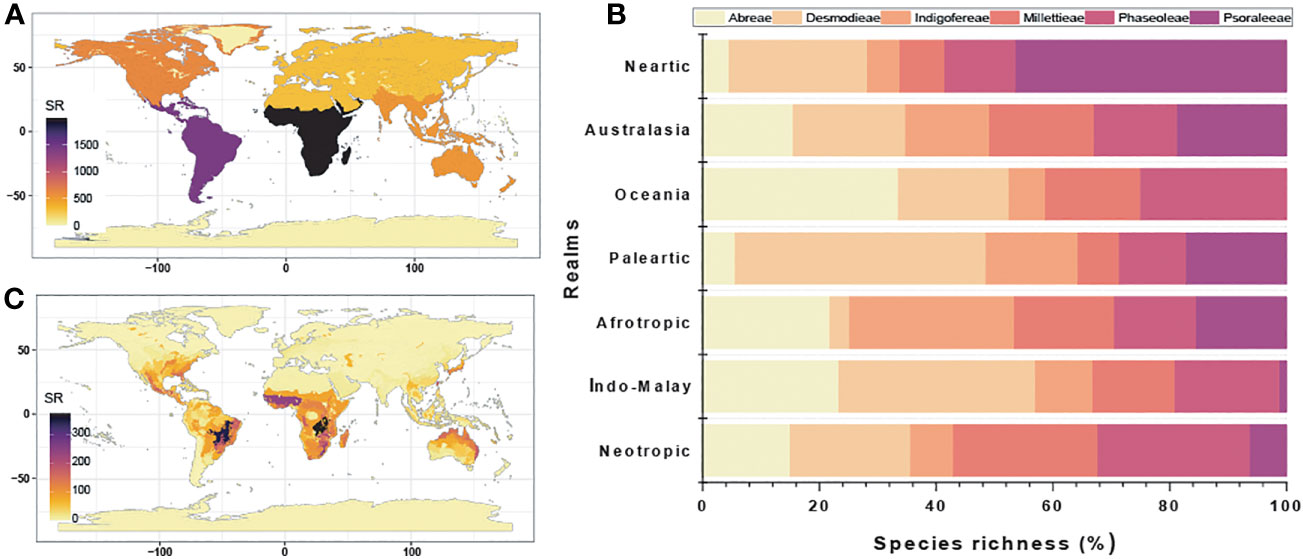
Figure 3 Species richness analyses of the tribes of the MP clade: (A) Realms; (B) Percentage species richness of each realm; and (C) Ecoregions.
The MP clade occupied multiple ecoregions and areas of high species richness differ as observed in the Afrotropic (West Sudanian savanna, Central Zambezian wet miombo woodlands), Australasia (mostly the tropical savanna), Indo-Malay (Taiwan subtropical evergreen forests and Northern Indochina subtropical forests), Nearctic (Southeast US conifer savannas), Neotropics (e.g. Cerrado, Isthmanian-Atlantic moist forest, Brazilian Atlantic dry forests), Palearctic (Evergreen and montane deciduous forest), and Islands of Oceania. Similarly, the species richness patterns following the α- and β-diversity also varied between biomes.
Except for the Tundra, the species of the MP clade are distributed in all other biomes—Abreae (10); Indigofereae, Millettieae and Psoaraleeae (12); and Desmodieae and Phaseoleae (13) (Figures 4A-C; Table S3.2 in Supporting Information S3). The biomes with the highest percentage species richness (α-diversity) were the Tropical and Subtropical Moist Broadleaf Forests (~ 25%) and the Temperate Grasslands, Savannas and Shrublands (~ 21%), while the Boreal Forests/Taiga (<1%) had the lowest. The Tropical and Subtropical Moist Broadleaf Forests harbor the highest α-diversity in four tribes including Desmodieae (~ 24%), Phaseoleae (~ 26%), Abreae (~ 27%), and Millettieae (~ 31%) while the Temperate Grasslands, Savannas and Shrublands tribes, as well as Mediterranean Forests, Woodlands & Scrub had the highest for the tribe Indigofereae (~ 28%) and Desmodieae (~ 24%), respectively.
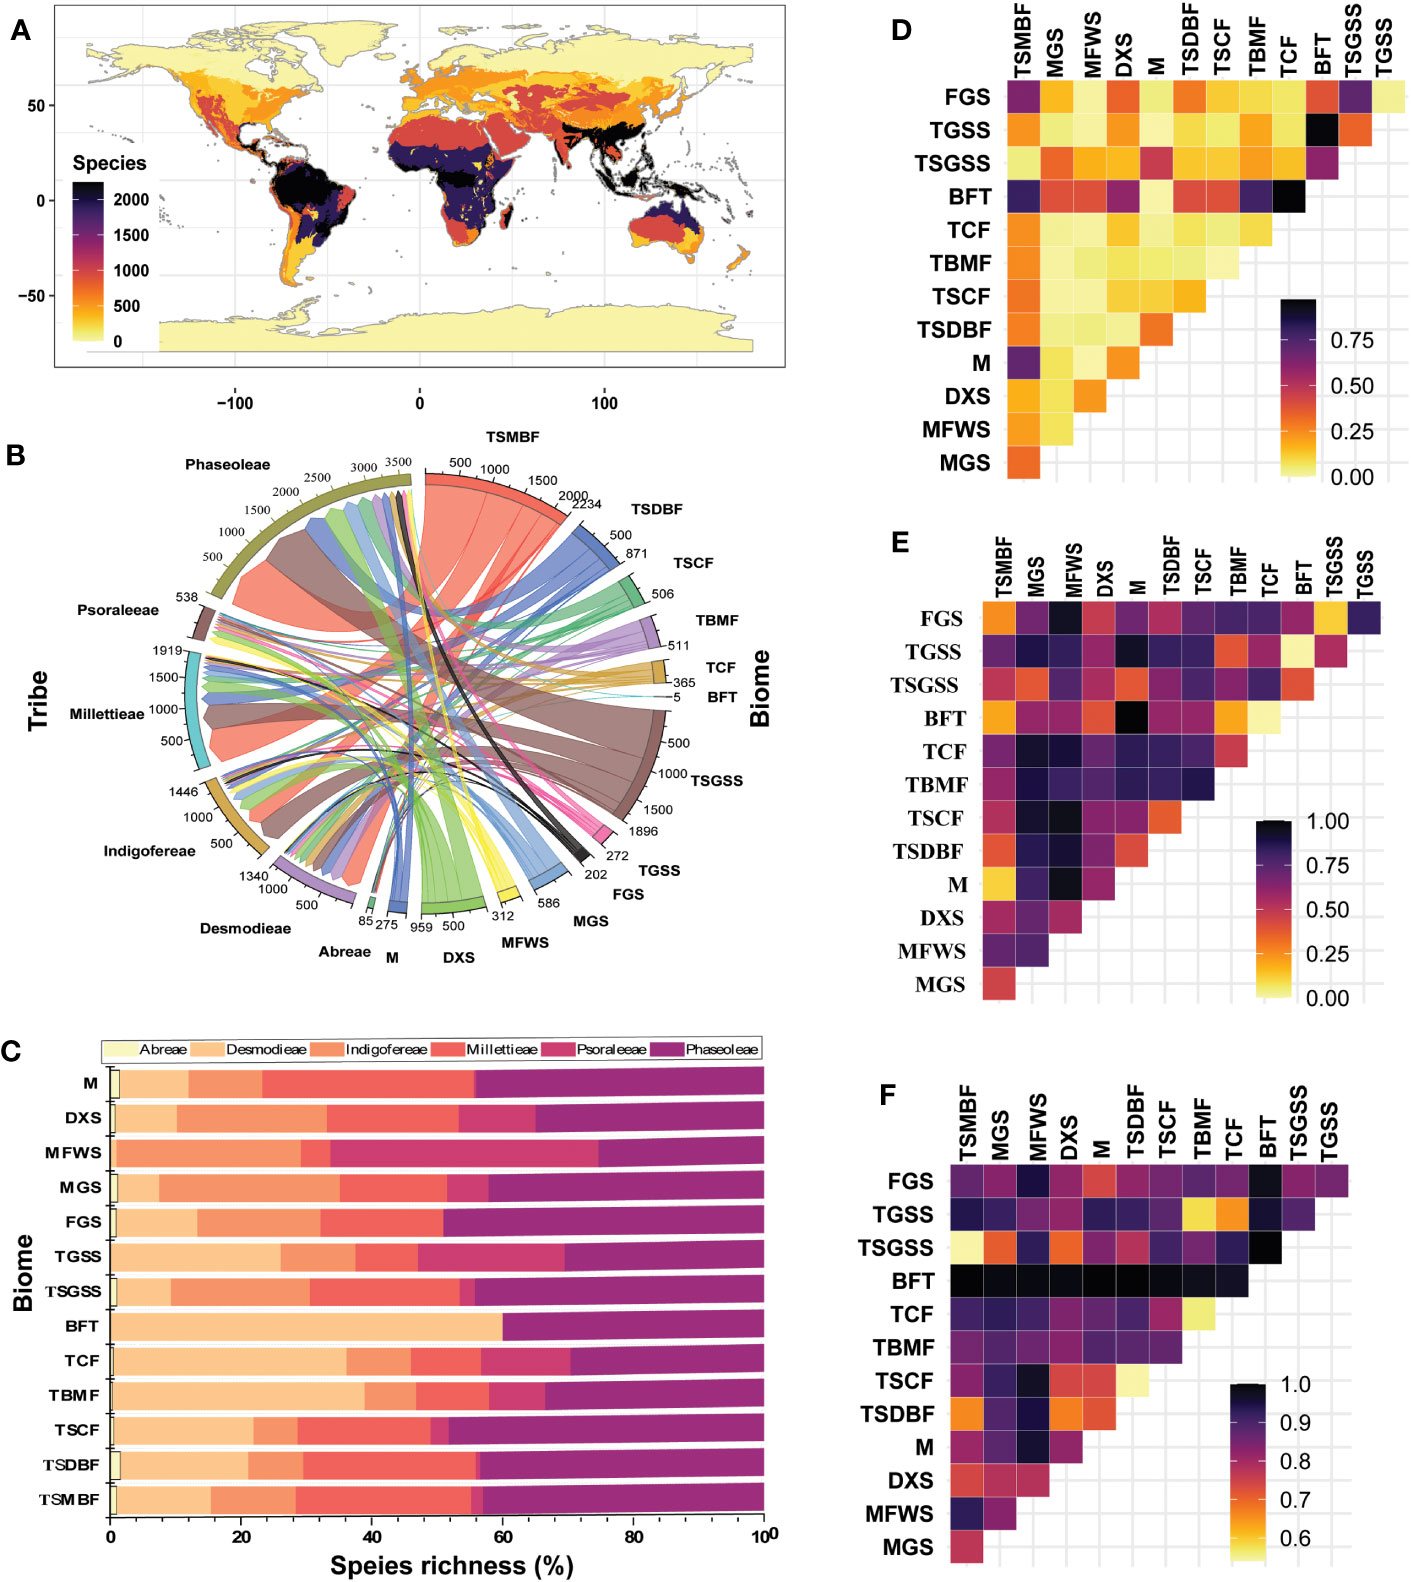
Figure 4 Species richness analyses of the tribes of the MP clade: (A) Biomes; (B) Matrix chord showing α-diversity; (C) Percentage species richness of each biome; (D) Nestedness; (E) Spatial turnover; and (F) Total dissimilarity. TSMBF, Tropical & Subtropical Moist Broadleaf Forests; TSDBF, Tropical & Subtropical Dry Broadleaf Forests; TSCF, Tropical & Subtropical Coniferous Forests; TBMF, Temperate Broadleaf & Mixed Forests; TCF, Temperate Conifer Forests; BFT, Boreal Forests/Taiga; TGSS, Temperate Grasslands, Savannah and Shrublands; TSGSS, Temperate Grasslands, Savannas & Shrublands; FGS, Flooded Grasslands & Savannas; MGS, Montane Grasslands & Shrublands; MFWS, Mediterranean Forests, Woodlands & Scrub; DXS, Deserts & Xeric Shrublands; M, Mangrove.
The pairwise dissimilarity analyses showed variable β-diversity between biomes for the MP clade species (Figures 4D-F; Tables S3.3–3.9 in Supporting Information S3). The nestedness ranged between 0.00 and 0.97 and was generally low, except for the biome pairs Tropical & Subtropical Moist Broadleaf Forests vs. (–Mangrove, and –Flooded Grasslands & Savannas); Boreal Forests/Taiga vs. (–Deserts & Xeric Shrublands, –Tropical & Subtropical Moist Broadleaf Forests, –Temperate Conifer Forests, –Temperate Grasslands, Savannas & Shrublands, –Tropical & Subtropical Moist Broadleaf Forests, and –Temperate Grasslands, Savannah and Shrublands); and Temperate Grasslands, Savannas & Shrublands vs. Flooded Grasslands & Savannas) which are > 0.5. The turnover pairwise ranged between 0.00 and 1.00 but was lowest in Boreal Forests/Taiga vs. the Temperate Grasslands, Savannas and Shrublands (0.00) and highest (1.00) in pair Mangrove vs. Boreal Forests/Taiga. The total dissimilarity between the biomes ranged from 0.54 to 1.00 and turnover pairwise was lowest (0.00) in Boreal Forests/Taiga vs. the Temperate Grasslands, Savannas and Shrublands and highest (1.00) in pair Mangrove vs. Boreal Forests/Taiga. The β-diversity pairwise between biome assemblages varied among the tribes as shown by the differences in turnover and nestedness. The highest total dissimilarity (1.00) was between the Temperate Broadleaf & Mixed Forests vs. Temperate Conifer Forests biomes for the tribe Abreae. The Mediterranean Forests, Woodlands & Scrub biomes had high total dissimilarities with all other biomes for the tribes Desmodieae and Indigofereae, while total dissimilarities among biomes were generally high (> 0.5) for the tribes Millettieae, Phaseoleae, and Psoraleeae. Comparatively, nestedness was generally lower than the turnover in most tribes except for the tribe Phaseoleae and the marginal difference in the tribe Abreae. Thus, indicating different levels of species replacement, loss or gain, habitat tracking, coexistence, and dispersal accounting for the species richness of the studied group.
3.4 Magnitude of environmental variables on the species richness
The influence of environmental factors (10 bioclimatic variables and elevation) on the species richness patterns of the MP clade was relatively weak (Table 2; Figure 5; Table S5.2 in Supporting information S5). The variables with the highest relative importance to species richness dynamics included the mean annual daily mean air temperatures (Abreae and Indigofereae), the ratio of diurnal variation to annual variation in temperatures (Desmodieae and Psoraleeae), the mean diurnal range of temperatures (Millettieae), and the wettest quarter of the year (Phaseoleae). The annual daily mean air temperatures also had the strongest influence (> 50%) in predicting the species richness of the whole MP clade. By contrast, elevation had low relative importance on species richness of the whole MP clade and its components tribes except for the tribe Abreae. Overall, only two environmental variables (mean diurnal range of temperatures and precipitation of warmest quarter) positively and significantly influence (p < 0.001) the species richness of MP clade, except for the tribe Abreae. The increase in the species richness of the tribe Abreae was positively correlated with the mean annual daily mean air temperatures, the ratio of diurnal variation to annual variation in temperatures, precipitation of the coldest quarter, accumulated precipitation, and elevation; however, these relationships were not significant.
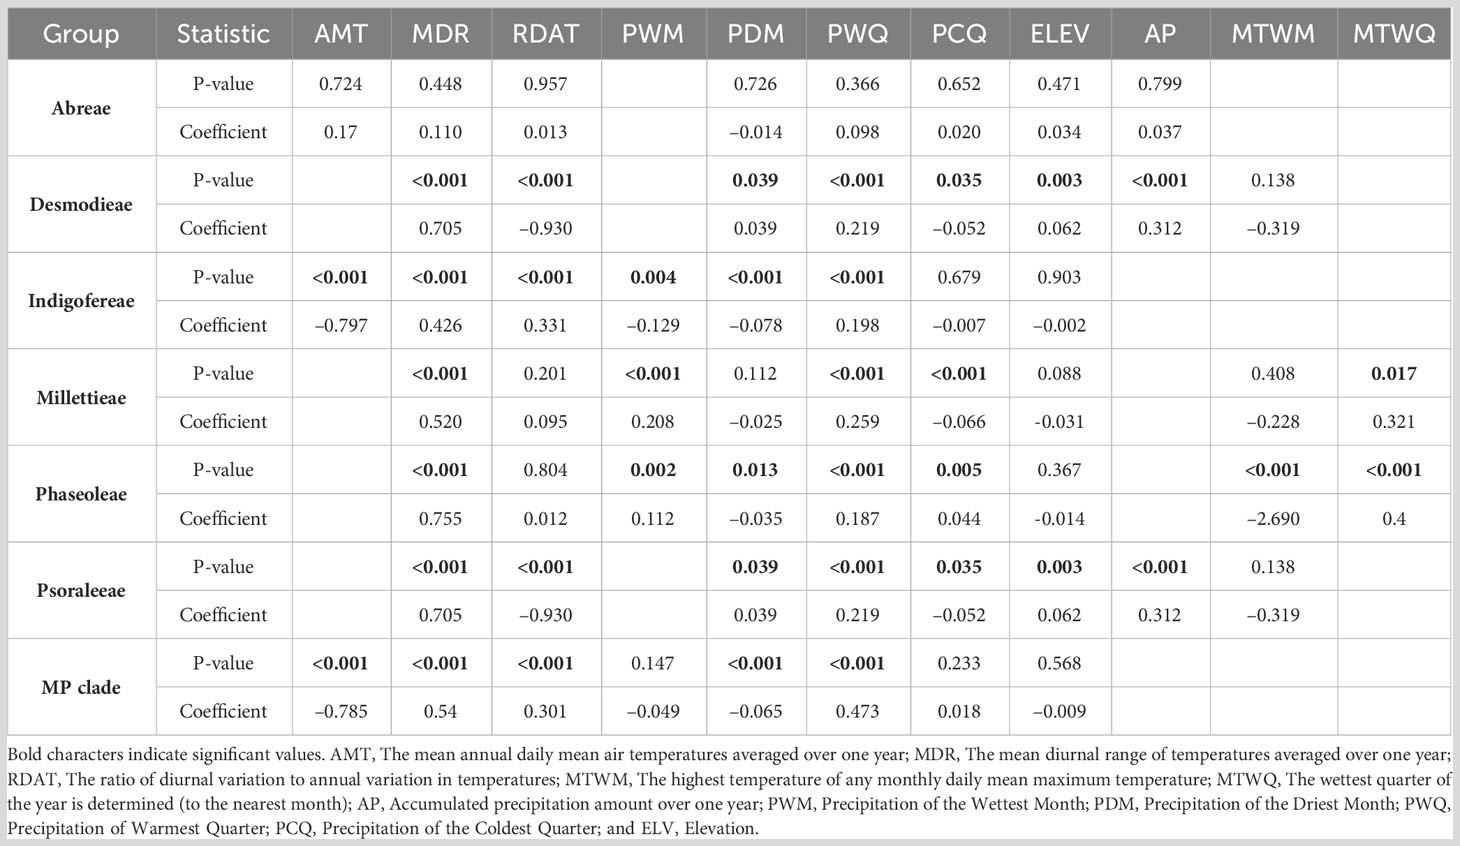
Table 2 Effects of environmental factors on the species richness of the MP clade.
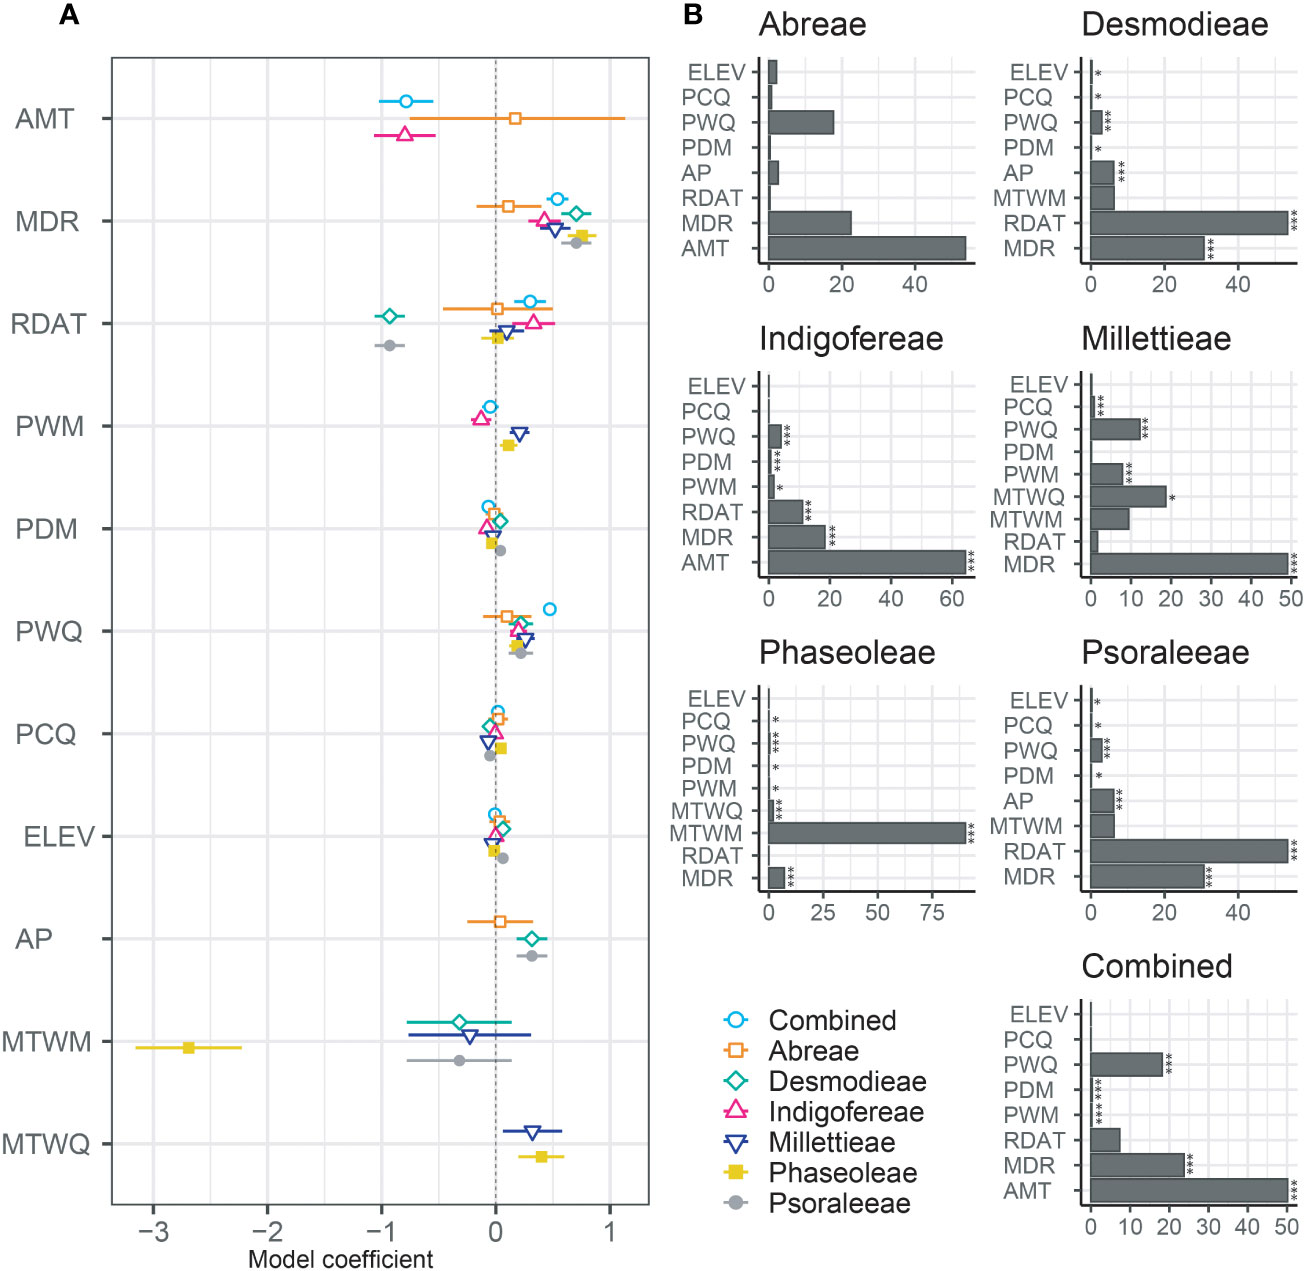
Figure 5 Relative influence of environmental and biogeographic variables on the diversity of the MP clade and its components. (A) Plot of coefficient between the taxa groups and (B) Relative contribution of the environmental variables to the species richness are presented in bar charts and the significant values are marked by asterisk; * = p < 0.05, and *** = p < 0.001. AMT, The mean annual daily mean air temperatures averaged over one year; MDR, The mean diurnal range of temperatures averaged over one year; RDAT, The ratio of diurnal variation to annual variation in temperatures; MTWM, The highest temperature of any monthly daily mean maximum temperature; MTWQ, The wettest quarter of the year is determined (to the nearest month); AP, Accumulated precipitation amount over one year; PWM, Precipitation of the Wettest Month; PDM, Precipitation of the Driest Month; PWQ, Precipitation of Warmest Quarter; PCQ, Precipitation of the Coldest Quarter; and ELV, Elevation.
Similar environmental variables significantly influenced the species richness of the tribes Desmodieae and Psoraleeae. While the ratio of diurnal variation to annual variation in temperatures (Coefficient = –0.93 for both tribes), and precipitation of the coldest quarter (Coefficient = –0.05 for both tribes) negatively influence the species richness, the precipitation of the driest month (Coefficient = 0.04 for both tribes), accumulated precipitation (Coefficient = 0.32 for both tribes) and elevation (Coefficient = 0.06 for both tribes) positively influence the dynamics of species richness of the two tribes. For the tribes Millettieae and Phaseoleae, the species richness was positively and significantly determined by precipitation of the wettest month (Coefficient = 0.21 and Coefficient = 0.11, respectively), and the wettest quarter of the year (Coefficient = 0.32 and Coefficient = 0.04, respectively). The precipitation during the coldest quarter had notably different impacts on the species richness of two tribes, Millettieae (Coefficient = –0.06) and Phaseoleae (Coefficient = 0.04). However, the species richness of the tribe Phaseoleae was only significantly influenced by the precipitation during the driest month (Coefficient = –0.04). The species richness of the tribe Indigofereae was uniquely, negatively, and significantly influenced by mean annual daily mean air temperatures (Coefficient = –0.79) while other significant climatic variables were the ratio of diurnal variation to annual variation in temperatures (Coefficient = 0.33), precipitation of the wettest month (Coefficient = –0.12), and precipitation of the driest month (Coefficient = –0.07). Our analyses showed that species richness of the whole MP clade was significantly driven by the climatic variables such as mean annual daily mean air temperatures (Coefficient = –0.78), precipitation of the driest month (Coefficient = –0.06), mean diurnal range of temperatures (Coefficient = 0.54), the ratio of diurnal variation to annual variation in temperatures (Coefficient = 0.30), and precipitation of the coldest quarter (Coefficient = 0.40).
4 Discussion
The current study represents the first attempt to produce a profound understanding of the macroecology of the MP clade by assembling a large dataset, which aggregates and complements earlier studies on Fabaceae (De La Estrella et al., 2012; Jin et al., 2013; Yang et al., 2022). Investigations on global geographical distribution patterns of economical important and hyperdiverse clades can provide valuable insights into the possible environmental variables shaping the diversity, help identify the hotspot regions, and enhance conservation strategies. Our study shows that MP clade presents a global distribution with the geographical centers of high species richness being the megathermal areas (Figure 1). Remarkably, these areas are within the recently mapped global locations of critical natural assets for nature’s contributions to people (Chaplin-Kramer et al., 2022) and similar to the reported distribution pattern of the legumes where they generally occur in the tropics and some parts of the temperate regions (Lavin et al., 2004; LPWG, 2022). The high species richness of the MP clade in the tropics may be attributed to its origin and continued radiation in the tropical zones (Zhao et al., 2021), which has been complemented by the results from this study that temperature dynamics is a significant determinants of species richness patterns. Thus, this finding fits the tropical conservatism predictions which is consistent with the origin of most angiosperm lineages in the Cenozoic (Behera and Roy, 2019; Tietje et al., 2022). Therefore, it is crucial to explicitly prioritize these hotspot regions to advance conservation goals to protect more species from the MP clade by targeting both high and low species richness hotspots.
4.1 Patterns of species richness along the geographic gradient
On the effects of geographic effects on distribution and species richness patterns of the MP clade and its tribes, we found heterogeneous species richness patterns in the tropic and temperate zones, contrasting our assumptions of homogenous species richness patterns in both zones. Also, the strength and direction of the latitudinal diversity of the MP clade and its tribes vary but peaked around the equator (mainly mid to lower latitude) except for the tribes Desmodieae and Psoraleeae with slightly higher species richness in the high latitudes towards the Northern Hemisphere (Figures 1B, C). The variation in the direction and strength of the species richness along the latitude also agrees with previous studies. For instance, niche conservatism (weak latitudinal gradient diversity) limits the distribution of cold-adapted Medicago species (Fabaceae) in the tropics (Yang et al., 2022), standing in stark contrast to the strong latitudinal diversity patterns observed in the global variation in plant species richness (Tietje et al., 2022). Brodie and Mannion (2022) proposed two potential reasons to explain inversions in the latitudinal gradient of diversity and the higher heterogenous turnover in temperate regions compared to the tropics. Firstly, during hothouse climates, diversity becomes concentrated at higher latitudes as the equatorial regions become excessively hot (Sun et al., 2012; Allen et al., 2020). Secondly, during periods of elevated global temperatures, a flattened latitudinal temperature gradient tends to accompany it. Consequently, diversity may track other factors such as habitat area rather than latitudinal gradient. Also, given the age of the MP clade, the latitudinal gradient diversity pattern could be driven by climatic variables and niche equivalents. Nevertheless, the species richness patterns observed here largely conform to the expected idiosyncrasy of latitudinal gradient diversity; species richness is higher towards the equator, which does not strongly support our hypothesis.
Similar to previous studies (Behera and Roy, 2019; Etienne et al., 2019; Brodie and Mannion, 2022; Tietje et al., 2022), we propose that energetic limits, climate stability, and enhanced diversification hypotheses may explain the staggering higher species richness of the MP clade in tropical and subtropical zones while the historical perturbation hypothesis may explain the low species richness in higher latitudes of the temperate zone. The harsh environmental conditions in the temperate zone may have imposed range contractions and expansions along the latitude e.g., tribe Abreae restricted (niche conservatism) to the mid-latitude. Of the three tribes (Desmodieae, Psoraleeae and Phaseoleae) that extended their niches to the higher latitudes, only the species richness of the tribe Phaseoleae failed to have positive relationships with the latitude. Hence, the observed positive effects of the latitudinal gradient on the species richness of the tribes Desmodieae and Psoraleeae indicate they possess a high adaptation and can utilize the available environmental resources to increase the niche space. We may translate the niche expansion and ecological resilience of the tribes Desmodieae and Psoraleeae in high latitudes contribute to the observed high heterogeneous turnover of the MP clade in the Northern Hemisphere and broadly consistent with the well-known species-area relationship assumptions (Rosenzweig, 1995; Mccain, 2009; Tietje et al., 2022). Thus, our findings yield novel insight into the diversification patterns and recommend further study to investigate evolutionary mechanisms for the diversification within this important legume clade.
4.2 Ecoregion and biome richness
The α- and β-diversity patterns may help to test whether the species richness of the MP clade is driven by the independent dispersal events, adaptation to a heterogenous environment, and species loss or gain/replacement. Interestingly, our study showed that the Tropical and Subtropical Dry Broadleaf Forests, as well as Temperate Grasslands, Savannas and Shrublands, had the highest species richness. Thus, implying that the MP clade’s species may have never colonized the Tundra and less in Boreal Forest/Taiga (the world’s terrestrial carbon storehouse) biomes due to extremely low temperatures, little precipitation, and poor nutrients. The extent of the turnover and nestedness underscores the total dissimilarity among the biomes of the MP clade. High replacements of species among the biomes contributes to the species richness of the tribes Desmodieae, Indigofereae, Millettieae and Psoraleeae. In contrast, a non-random process of disaggregation of assemblages where biomes with low richness host part of the species of richer biomes influenced the species richness of the tribe Phaseoleae. Whereas both the turnover and nestedness substantially promote the species richness of the tribe Abreae.
Disparities among multiple biomes due to the replacement of species among biomes (e.g., biomes support unique species), species loss (e.g., one biome supports a subset of species present at another), or a combination of both processes have been reported (Baselga, 2010; Baselga, 2012). On the one hand, turnover reflects a process of substitution of species by environmental selection or historical restriction. For instance, our global sampling revealed that Alysicarpus glumaceus (Vahl) DC. (Tropical & Subtropical Moist Broadleaf Forests; Mangrove; and Temperate Grasslands, Savannas & Shrublands);, Erythrina lysistemon Hutch. (Tropical & Subtropical Moist Broadleaf Forests; Montane Grasslands & Shrublands; Mediterranean Forests, Woodlands & Shrubs; and Temperate Grasslands, Savannas & Shrublands) and Indigofera suffruticosa Mill. (except in Montane Grasslands & Shrublands; Mediterranean Forests, Woodlands & Shrubs; and Boreal Forests/Taiga), have successfully adapted to multiple biomes, suggesting they can easily replace species lost in different biomes. On the other hand, nestedness reflects differential dispersal ability to isolated biome in varying spatial scales (Fontana et al., 2020; Enkhtur et al., 2021). Nestedness in the MP clade is largely linked to energy availability, resulting in lower species richness in colder biomes than in tropical biomes. However, the presence of some species adapted to harsher environments within this clade is not surprising, given that N-fixation is prevalent in the subfamily Papilionoideae (Mckey, 1994; Sprent et al., 2017), which includes representatives from the MP clade (Sprent et al., 2017; Zhao et al., 2021). Therefore, our study evinced that both dispersal (including long-distance dispersal) and adaptation to different biomes play significant roles in determining the species richness of the MP clade and its tribes. This phenomenon can be best described as “when dispersal meets adaptation.” Thus, we suggest that stochastic long-distance dispersal, which is common in Fabaceae (Schaefer et al., 2012; Jabbour et al., 2018), as an additional event contributing to the global species richness dynamics of the MP clade.
4.3 Main environmental factors driving the species richness patterns of the MP clade
Our study showed that climatic factors strongly predict species richness patterns of the MP clade than elevation. In general, variations in temperature and precipitation either positively or negatively influence the species richness of each of the tribes of the MP clade. The colonization of the species from the tribes Desmodieae and Psoraleeae is influenced by the precipitation of the driest month and accumulated precipitation available even in higher elevations compared to the tribe Indigofereae that is influenced by the ratio of diurnal variation to annual variation in temperatures. Whereas the species richness of tribes Millettieae and Phaseoleae were significantly supported by temperature and precipitation variations. In contrast, these climatic variables predicted the species richness of the tribe Abreae but not significant. Hence, we consider that the tribe Abreae establishes its species richness mainly by tracking habitat availability while exploiting the stable climatic conditions in the tropics. Overall, increase in the mean diurnal range of temperatures and precipitation of the warmest quarter will significantly increase the species richness of the MP clade (Figure 5).
Our findings agree with numerous previous studies that have shown that climatic factors (e.g., temperature seasonality and isothermality) significantly influence plant distribution and species richness as it affects the key traits that support niche expansion (Molina-Montenegro and Naya, 2012; Kröger, 2018; Gong and Gao, 2019; Sheard et al., 2020; Huang et al., 2021). Both temperature and precipitation are essential for the species richness of the MP clade. Temperature imposes direct effect on metabolisms (Brown et al., 2004; Fuhrman et al., 2008), productivity (Wang et al., 2016), ecological interactions (Bruno et al., 2015), and speciation rate (Allen and Gillooly, 2006). The ratio of diurnal variation to annual variation in temperature affects plant functions like stomata opening and photoperiodism, which regulate seasonal reproduction, including flowering (Zhao et al., 2018). Temperature at low elevations may have also stimulated resource exploitation, photosynthesis, and physiological stability, leading to higher growth rates and staggering species richness of the studied group. These also correlate with high species richness in the tropical biomes (than the similar habitats in the temperate region) and megathermal ecoregions. Also, the increase in precipitation may have contributed to the survival of the species in harsh biomes (Gwitira et al., 2014; Zhao et al., 2018) and has strong effects on the species of the MP clade particularly the woody species of the tribes Millettieae and Phaseoleae. These climatic variables have potential effects on the N-fixing symbioses in angiosperms (Li et al., 2015). We showed that the diurnal range and temperature range both describe temperature fluctuations which may be better suited to characterize climatic conditions for the MP clade at higher altitudes, i.e., it can impose habitat contraction and expansion. Therefore, we conjecture that temperature and wetter growth season mostly promote the species richness and coexistence of the MP clade compared to the elevation as the species of this clade are born migrators.
4.4 Caveats
In macroecological studies, acknowledging the limitations of the available occurrence data from public databases such as GBIF and its associated information repository is fundamental to interpreting the resulting geographical patterns. However, despite these limitations (e.g., erroneous geographic records, and misidentification of taxon), these data are often used to reconstruct biogeography maps and species distribution modeling in broad perspectives. Similarly, we were able to minimize these problems by conducting series of taxonomical and geographical filtering methods. The exclusion of incorrect species and coordinates did not alter the broad patterns of our sampling coverage in both cases of each studied group and sufficient for our analyses i.e., the representative species of the MP clade and biogeography distribution. We achieved broad occurrence data for the MP clade robust enough to inherently understand the macroecological configurations and environmental factors predicting the species richness patterns of the six tribes of the MP clade without bias.
5 Conclusions
We provide the first global distribution patterns for the MP clade highlighting areas of high species richness that deserve sustainable management and conservation of the family Fabaceae. Our study showed that megathermal regions are areas of high species richness for the MP clade, with the tropical and subtropical moist broadleaf forests biome being the most suitable biome. The relative importance of environmental factors varies among the tribes. Generally, climate variability precipitation (warmest quarter, driest month, and wettest month) and the mean diurnal range of temperatures significantly influenced the species richness patterns of the MP clade compared to geographical gradients. In addition, the MP clade also relies on dispersal and adaptation to novel ecological niches to achieve present-day global species richness. Thus, slight alterations in environmental conditions could affect the species richness patterns of the MP clade. Nevertheless, numerous questions persist without answers, encompassing the intricate interplay between climate, diversification, latitude, and functional diversity of the MP clade. These would be interesting research areas to investigate in subsequent studies, as doing so will help clarify how ecology and evolutionary processing affect biodiversity distributions, management, and conservation.
Data availability statement
The original contributions presented in the study are included in the article/Supplementary Material. Further inquiries can be directed to the corresponding author.
Author contributions
OOO and T-SY designed the study. OOO, KOO, JARZ, and MAA performed the analyses. OOO and FR performed the data mining and cleaning. OOO wrote the manuscript. LMN, GWS, RRZ, and T-SY contributed to the revisions. All authors contributed to the article and approved the submitted version.
Funding
This research was supported by the National Natural Science Foundation of China, key international (regional) cooperative research project (Project No. 31720103903), the Strategic Priority Research Program of Chinese Academy of Sciences (Project No. XDB31000000), the Science and Technology Basic Resources Investigation Program of China (Project No. 2019FY100900), the National Natural Science Foundation of China (Project No. 32270247), the Yunnan Fundamental Research Projects (Project No. 202301AT070310), and the Yunnan Postdoctoral Orientation Training Grant (Project No. E231740261).
Conflict of interest
The authors declare that the research was conducted in the absence of any commercial or financial relationships that could be construed as a potential conflict of interest.
Publisher’s note
All claims expressed in this article are solely those of the authors and do not necessarily represent those of their affiliated organizations, or those of the publisher, the editors and the reviewers. Any product that may be evaluated in this article, or claim that may be made by its manufacturer, is not guaranteed or endorsed by the publisher.
Supplementary material
The Supplementary Material for this article can be found online at: https://www.frontiersin.org/articles/10.3389/fevo.2023.1231553/full#supplementary-material
References
Allen A. P., Gillooly J. F. (2006). Assessing latitudinal gradients in speciation rates and biodiversity at the global scale. Ecol. Lett. 9, 947–954. doi: 10.1111/j.1461-0248.2006.00946.x
Allen B. J., Wignall P. B., Hill D. J., Saupe E. E., Dunhill A. M. (2020). The latitudinal diversity gradient of tetrapods across the Permo-Triassic mass extinction and recovery interval. Proc. R. Soc. B 287, 20201125. doi: 10.1098/rspb.2020.1125
Anderson D., Burnham K. (2004). Model selection and multi-model inference. Second. NY: Springer-Verlag 63, 10.
Baselga A. (2010). Partitioning the turnover and nestedness components of beta diversity. Global Ecol. biogeogr. 19, 134–143. doi: 10.1111/j.1466-8238.2009.00490.x
Baselga A. (2012). The relationship between species replacement, dissimilarity derived from nestedness, and nestedness. Global Ecol. Biogeogr. 21, 1223–1232. doi: 10.1111/j.1466-8238.2011.00756.x
Behera M. D., Roy P. S. (2019). Pattern of distribution of angiosperm plant richness along latitudinal and longitudinal gradients of India. Biodiversity Conserv. 28, 2035–2048. doi: 10.1007/s10531-019-01772-1
Brodie J. F., Mannion P. D. (2022). The hierarchy of factors predicting the latitudinal diversity gradient. Trends Ecol. Evol. 38, 15–23. doi: 10.1016/j.tree.2022.07.013
Brown J. H., Gillooly J. F., Allen A. P., Savage V. M., West G. B. (2004). Toward a metabolic theory of ecology. Ecology 85, 1771–1789. doi: 10.1890/03-9000
Bruno J. F., Carr L. A., O’connor M. I. (2015). Exploring the role of temperature in the ocean through metabolic scaling. Ecology 96, 3126–3140. doi: 10.1890/14-1954.1
Calcagno V. (2020). R package “glmulti”: model selection and multimodel inference made easy. Available at https://cran.r-project.org/web/packages/glmulti/index.html.
Chamberlain S., Ram K., Hart T. (2016) spocc: Interface to species occurrence data sources. R package version 0.5. 0. Available at: http://CRAN.R-project.org/package=spocc.
Chaplin-Kramer R., Neugarten R., Sharp R., Collins P., Polasky S., Hole D., et al. (2022). Mapping the planet’s critical natural assets. Nat Ecol Evol. 7 (1), 51-61. doi: 10.1038/s41559-022-01934-5
Chartier M., Von Balthazar M., Sontag S., Lofstrand S., Palme T., Jabbour F., et al. (2021). Global patterns and a latitudinal gradient of flower disparity: perspectives from the angiosperm order Ericales. New Phytol. 230, 821–831. doi: 10.1111/nph.17195
Chatterjee S., Hadi A. S. (2006). Regression analysis by example (Hoboken, United States: John Wiley & Sons). doi: 10.1002/0470055464
De La Estrella M., Mateo R. G., Wieringa J. J., Mackinder B., Muñoz J. (2012). Legume diversity patterns in West Central Africa: influence of species biology on distribution models. PLoS One 7, e41526. doi: 10.1371/journal.pone.0041526
de Queiroz L. P., Pastore J. F., Cardoso D., Snak C., de C Lima A. L., Gagnon E., et al. (2015). A multilocus phylogenetic analysis reveals the monophyly of a recircumscribed papilionoid Legume tribe Diocleae with well-supported generic relationships. Mol. Phylogenet. Evol. 90, 1–19. doi: 10.1016/j.ympev.2015.04.016
Dinerstein E., Olson D., Joshi A., Vynne C., Burgess N. D., Wikramanayake E., et al. (2017). An ecoregion-based approach to protecting half the terrestrial realm. BioScience 67, 534–545. doi: 10.1093/biosci/bix014
Enkhtur K., Brehm G., Boldgiv B., Pfeiffer M. (2021). Alpha and beta diversity patterns of macro-moths reveal a breakpoint along a latitudinal gradient in Mongolia. Sci. Rep. 11. doi: 10.1038/s41598-021-94471-3
Etienne R. S., Cabral J. S., Hagen O., Hartig F., Hurlbert A. H., Pellissier L., et al. (2019). A minimal model for the latitudinal diversity gradient suggests a dominant role for ecological limits. Am. Naturalist. 194, E122–E133. doi: 10.1086/705243
Fontana V., Guariento E., Hilpold A., Niedrist G., Steinwandter M., Spitale D., et al. (2020). Species richness and beta diversity patterns of multiple taxa along an elevational gradient in pastured grasslands in the European Alps. Sci. Rep. 10, 12516. doi: 10.1038/s41598-020-69569-9
Fuhrman J. A., Steele J. A., Hewson I., Schwalbach M. S., Brown M. V., Green J. L., et al. (2008). A latitudinal diversity gradient in planktonic marine bacteria. Proc. Natl. Acad. Sci. 105, 7774–7778. doi: 10.1073/pnas.0803070105
Gaston K. J., Blackburn T. M. (2000). Pattern and Process in Macroecology. Blackwell Scientific Publications, Oxford. doi: 10.1002/9780470999592
Gong H., Gao J. (2019). Soil and climatic drivers of plant SLA (specific leaf area). Global Ecol. Conserv. 20, e00696. doi: 10.1016/j.gecco.2019.e00696
Gwitira I., Murwira A., Shekede M. D., Masocha M., Chapano C. (2014). Precipitation of the warmest quarter and temperature of the warmest month are key to understanding the effect of climate change on plant species diversity in S outhern A frican savannah. Afr. J. Ecol. 52, 209–216. doi: 10.1111/aje.12105
Huang E., Chen Y., Fang M., Zheng Y., Yu S. (2021). Environmental drivers of plant distributions at global and regional scales. Global Ecol. Biogeogr. 30, 697–709. doi: 10.1111/geb.13251
Hurtado P., Prieto M., De Bello F., Aragon G., Lopez-Angulo J., Giordani P., et al. (2020). Contrasting environmental drivers determine biodiversity patterns in epiphytic lichen communities along a European gradient. Microorganisms 8, 1913. doi: 10.3390/microorganisms8121913
Jabbour F., Gaudeul M., Lambourdiere J., Ramstein G., Hassanin A., Labat J. N., et al. (2018). Phylogeny, biogeography and character evolution in the tribe Desmodieae (Fabaceae: Papilionoideae), with special emphasis on the New Caledonian endemic genera. Mol. Phylogenet. Evol. 118, 108–121. doi: 10.1016/j.ympev.2017.09.017
Jin D., Ma J., Ma W., Liang C., Shi Y., He J.-S. (2013). Legumes in Chinese natural grasslands: Species, biomass, and distribution. Rangeland Ecol. Manage. 66, 648–656. doi: 10.2111/REM-D-12-00159.1
Karger D. N., Conrad O., Bohner J., Kawohl T., Kreft H., Soria-Auza R. W., et al. (2017). Data Descriptor: Climatologies at high resolution for the earth’s land surface areas. Sci. Data 4. doi: 10.1038/sdata.2017.122
Koleff P., Gaston K. J. (2002). The relationships between local and regional species richness and spatial turnover. Global Ecol. Biogeogr. 11, 363–375. doi: 10.1046/j.1466-822x.2002.00302.x
Kreft H., Jetz W. (2007). Global patterns and determinants of vascular plant diversity. Proc. Natl. Acad. Sci. 104, 5925–5930. doi: 10.1073/pnas.0608361104
Kröger B. (2018). Changes in the latitudinal diversity gradient during the Great Ordovician Biodiversification Event. Geology 46, 127–130. doi: 10.1130/G39587.1
Lavin M., Herendeen P. S., Wojciechowski M. F. (2005). Evolutionary rates analysis of Leguminosae implicates a rapid diversification of lineages during the Tertiary. Syst. Biol. 54, 575–594. doi: 10.1080/10635150590947131
Lavin M., Schrire B. P., Lewis G., Pennington R. T., Delgado-Salinas A., Thulin M., et al. (2004). Metacommunity process rather than continental tectonic history better explains geographically structured phylogenies in legumes. Philos. Trans. R. Soc Lond. B Biol. Sci. 359, 1509–1522. doi: 10.1098/rstb.2004.1536
Legume Phylogeny Working Group (LPWG). (2017). A new subfamily classification of the Leguminosae based on a taxonomically comprehensive phylogeny. Taxon 66, 44–77. doi: 10.12705/661.3
Legume Phylogeny Working Group (LPWG), Andrella G. C., Atahuachi Burgos M., Bagnatori Sartori Â.L., Balan A., Bandyopadhyay S., et al. (2022). The World Checklist of Vascular Plants (WCVP): Fabaceae. Ed. Govaerts R. (Kew, UK: The Royal Botanic Gardens).
Lewis G. P., Schrire B., Mackinder B., Lock M. (2005). Legumes of the World (Kew, UK: Royal Botanical Garden).
Li H.-L., Wang W., Mortimer P. E., Li R.-Q., Li D.-Z., Hyde K. D., et al. (2015). Large-scale phylogenetic analyses reveal multiple gains of actinorhizal nitrogen-fixing symbioses in angiosperms associated with climate change. Sci. Rep. 5, 1–8. doi: 10.1038/srep14023
Maldonado C., Molina C. I., Zizka A., Persson C., Taylor C. M., Albán J., et al. (2015). Estimating species diversity and distribution in the era of Big Data: to what extent can we trust public databases? Global Ecol. Biogeogr. 24, 973–984. doi: 10.1111/geb.12326
Mannion P. D., Upchurch P., Benson R. B., Goswami A. (2014). The latitudinal biodiversity gradient through deep time. Trends Ecol. Evol. 29, 42–50. doi: 10.1016/j.tree.2013.09.012
Mccain C. M. (2009). Global analysis of bird elevational diversity. Global Ecol. Biogeogr. 18, 346–360. doi: 10.1111/j.1466-8238.2008.00443.x
Mckey D. (1994). Legumes and nitrogen: the evolutionary ecology of a nitrogen-demanding lifestyle. nitrogen factor, PP. 221–228.
Mittelbach G. G., Schemske D. W., Cornell H. V., Allen A. P., Brown J. M., Bush M. B., et al. (2007). Evolution and the latitudinal diversity gradient: speciation, extinction and biogeography. Ecol. Lett. 10, 315–331. doi: 10.1111/j.1461-0248.2007.01020.x
Molina-Montenegro M. A., Naya D. E. (2012). Latitudinal patterns in phenotypic plasticity and fitness-related traits: assessing the climatic variability hypothesis (CVH) with an invasive plant species. PloS one e47620. doi: 10.1371/journal.pone.0047620
NASA J. (2020). NASADEM Merged DEM Global 1 arc second V001. NASA EOSDIS Land Processes DAAC. doi: 10.5067/MEaSUREs/NASADEM/NASADEM_HGT.001
Ohashi K., Ohashi H., Nemoto T., Ikeda T. (2018). Phylogenetic analyses for a new classification of the Desmodium group of Leguminosae Tribe Desmodieae. J. Jpn 93, 165–189.
Oksanen J., Simpson G. L., Blanchet F.G., Kindt R., Legendre P., Minchin P. R., et al. (2022). vegan: Community Ecology Package.
Oyebanji O. O., Salako G., Nneji L. M., Oladipo S. O., Bolarinwa K. A., Chukwuma E. C., et al. (2021). Impact of climate change on the spatial distribution of endemic legume species of the Guineo-Congolian forest, Africa. Ecol. Indic. 122, 107282. doi: 10.1016/j.ecolind.2020.107282
Pontarp M., Bunnefeld L., Cabral J. S., Etienne R. S., Fritz S. A., Gillespie R., et al. (2019). The latitudinal diversity gradient: novel understanding through mechanistic eco-evolutionary models. Trends Ecol. Evol. 34, 211–223. doi: 10.1016/j.tree.2018.11.009
QGIS Development Team (2021). QGIS Geographic Information System; Open Source Geospatial Foundation Project. (Version 3.22.11 LTR).
R Core Team (2023). R: A language and environment for statistical computing (Vienna, Austria: R Foundation for Statistical Computing).
Romdal T. S., Araújo M. B., Rahbek C. (2013). Life on a tropical planet: niche conservatism and the global diversity gradient. Global Ecol. Biogeogr. 22, 344–350. doi: 10.1111/j.1466-8238.2012.00786.x
Rosenzweig M. (1995). Species diversity in space and time (Cambridge: Cambridge university press). doi: 10.1017/CBO9780511623387
Sabatini F. M., Jiménez-Alfaro B., Jandt U., Chytrý M., Field R., Kessler M., et al. (2022). Global patterns of vascular plant alpha diversity. Nat. Commun. 13, 4683. doi: 10.1038/s41467-022-32063-z
Salako G., Oyebanji O. O., Olagunju T. E., Howe G. T. (2021). Potential impact of climate change on the distribution of some selected legumes in Cameroon and adjoining Nigeria border. Afr. J. Ecol. 59, 959–975. doi: 10.1111/aje.12915
Saupe E. E., Myers C. E., Townsend Peterson A., Soberón J., Singarayer J., Valdes P., et al. (2019). Spatio-temporal climate change contributes to latitudinal diversity gradients. Nat. Ecol. Evol. 3, 1419–1429. doi: 10.1038/s41559-019-0962-7
Schaefer H., Hechenleitner P., Santos-Guerra A., Menezes De Sequeira M., Pennington R. T., Kenicer G., et al. (2012). Systematics, biogeography, and character evolution of the legume tribe Fabeae with special focus on the middle-Atlantic island lineages. BMC Evol. Biol. 12, 250. doi: 10.1186/1471-2148-12-250
Schluter D. (2016). Speciation, ecological opportunity, and latitude: (American society of naturalists address). Am. Nat. 187, 1–18. doi: 10.1086/684193
Sheard C., Neate-Clegg M. H., Alioravainen N., Jones S. E., Vincent C., Macgregor H. E., et al. (2020). Ecological drivers of global gradients in avian dispersal inferred from wing morphology. Nat. Commun. 11, 1–9. doi: 10.1038/s41467-020-16313-6
Simpson G. L., Oksanen J. (2021). analogue: Analogue and weighted averaging methods for palaeoecology. R package version 0.17-6. Available at: https://cran.r-project.org/package=analogue.
Socolar J. B., Gilroy J. J., Kunin W. E., Edwards D. P. (2016). How should beta-diversity inform biodiversity conservation? Trends Ecol. Evol. 31, 67–80. doi: 10.1016/j.tree.2015.11.005
Sprent J. I., Ardley J., James E. K. (2017). Biogeography of nodulated legumes and their nitrogen-fixing symbionts. New Phytol. 215, 40–56. doi: 10.1111/nph.14474
Sun Y., Joachimski M. M., Wignall P. B., Yan C., Chen Y., Jiang H., et al. (2012). Lethally hot temperatures during the Early Triassic greenhouse. Science 338, 366–370. doi: 10.1126/science.1224126
Tietje M., Antonelli A., Baker W. J., Govaerts R., Smith S. A., Eiserhardt W. L. (2022). Global variation in diversification rate and species richness are unlinked in plants. Proc. Natl. Acad. Sci. U.S.A. 119, e2120662119. doi: 10.1073/pnas.2120662119
Topel M., Zizka A., Calio M. F., Scharn R., Silvestro D., Antonelli A. (2017). SpeciesGeoCoder: fast categorization of species occurrences for analyses of biodiversity, biogeography, ecology, and evolution. Syst. Biol. 66, 145–151. doi: 10.1093/sysbio/syw064
Tripathi P., Behera M. D., Roy P. S. (2019). Spatial heterogeneity of climate explains plant richness distribution at the regional scale in India. PloS One 14, e0218322. doi: 10.1371/journal.pone.0218322
Vavrek M. J. (2011). fossil: palaeoecological and palaeogeographical analysis tools. Palaeontol. Electronica 14, 16.
Venables W. N., Ripley B. D. (2002). Modern Applied Statistics with S. Springer, New York, 271–300. doi: 10.1007/978-0-387-21706-2
Walker B. (2021) kewr: R Package to Access Kew Data APIs. Available at: https://barnabywalker.github.io/kewr/https://github.com/barnabywalker/kewr/.
Wang J., Pan F., Soininen J., Heino J., Shen J. (2016). Nutrient enrichment modifies temperature-biodiversity relationships in large-scale field experiments. Nat. Commun. 7, 1–9. doi: 10.1038/ncomms13960
Watson L., Dallwitz M. J. (1999). The families of flowering plants: Descriptions, illustrations, identification, and information retrieval (New Orleans, USA: University of New Orleans).
Wiens J. J. (2011). The causes of species richness patterns across space, time, and clades and the role of “ecological limits”. Q. Rev. Biol. 86, 75–96. doi: 10.1086/659883
Wojciechowski M. F., Lavin M., Sanderson M. J. (2004). A phylogeny of legumes (Leguminosae) based on analysis of the plastid matK gene resolves many well-supported subclades within the family. Am. J. Botany. 91, 1846–1862. doi: 10.3732/ajb.91.11.1846
Yang Y., Bian Z., Ren G., Liu J., Shrestha N. (2022). Niche conservatism limits the distribution of Medicago in the tropics. Ecography 2022, e06085. doi: 10.1111/ecog.06085
Zhao Y., Cao H., Xu W., Chen G., Lian J., Du Y., et al. (2018). Contributions of precipitation and temperature to the large scale geographic distribution of fleshy-fruited plant species: Growth form matters. Sci. Rep. 8, 17017. doi: 10.1038/s41598-018-35436-x
Zhao J., Chen J., Beillouin D., Lambers H., Yang Y., Smith P., et al. (2022). Global systematic review with meta-analysis reveals yield advantage of legume-based rotations and its drivers. Nat. Commun. 13, 4926. doi: 10.1038/s41467-022-32464-0
Zhao Y., Zhang R., Jiang K. W., Qi J., Hu Y., Guo J., et al. (2021). Nuclear phylotranscriptomics and phylogenomics support numerous polyploidization events and hypotheses for the evolution of rhizobial nitrogen-fixing symbiosis in Fabaceae. Mol. Plant 14, 748–773. doi: 10.1016/j.molp.2021.02.006
Zizka A., Azevedo J., Leme E., Neves B., Da Costa A. F., Caceres D., et al. (2020). Biogeography and conservation status of the pineapple family (Bromeliaceae). Divers. Distrib. 26, 183–195. doi: 10.1111/ddi.13004
Zizka A., Silvestro D., Andermann T., Azevedo J., Ritter C. D., Edler D., et al. (2019). CoordinateCleaner: Standardized cleaning of occurrence records from biological collection databases. Methods Ecol. Evol. 10, 744–751. doi: 10.1111/2041-210X.13152
Keywords: geographic gradient, legumes, species richness, biogeography, diversity, environmental factors
Citation: Oyebanji OO, Onditi KO, Azevedo JAR, Rahaingoson FR, Nneji LM, Adeleye MA, Stull GW, Zhang R and Yi T-S (2023) Biogeographic patterns and environmental drivers of species richness in the globally distributed Millettioid/Phaseoloid clade (Fabaceae, subfamily Papilionoideae). Front. Ecol. Evol. 11:1231553. doi: 10.3389/fevo.2023.1231553
Received: 30 May 2023; Accepted: 21 August 2023;
Published: 14 September 2023.
Edited by:
Daniel de Paiva Silva, Goiano Federal Institute (IFGOIANO), BrazilReviewed by:
Tânia Maria De Moura, Goiano Federal Institute (IFGOIANO), BrazilAna Paula Fortuna Perez, São Paulo State University, Brazil
Copyright © 2023 Oyebanji, Onditi, Azevedo, Rahaingoson, Nneji, Adeleye, Stull, Zhang and Yi. This is an open-access article distributed under the terms of the Creative Commons Attribution License (CC BY). The use, distribution or reproduction in other forums is permitted, provided the original author(s) and the copyright owner(s) are credited and that the original publication in this journal is cited, in accordance with accepted academic practice. No use, distribution or reproduction is permitted which does not comply with these terms.
*Correspondence: Ting-Shuang Yi, tingshuangyi@mail.kib.ac.cn
†Present addresses: Oyetola O. Oyebanji, Department of Biology, University of Louisiana, Lafayette, LA, United States
Lotanna M. Nneji, Department of Biology, Howard University, Washington, DC, United States