 Vincent Okelo Wanga1,2,3†
 Xiang Dong1,2,3†
 Millicent Akinyi Oulo1,2,3
 Elijah Mbandi Mkala1,2,3
 Jia-Xin Yang1,2,3
 Guy Eric Onjalalaina1,2,3
 Moses Kirega Gichua4
 Paul Muigai Kirika5
 Robert Wahiti Gituru4
 Guang-Wan Hu1,2,3*
 Qing-Feng Wang1,2,3
- 1CAS Key Laboratory of Plant Germplasm Enhancement and Specialty Agriculture, Wuhan Botanical Garden, Chinese Academy of Sciences, Wuhan, China
- 2University of Chinese Academy of Sciences, Beijing, China
- 3Sino-Africa Joint Research Center, Chinese Academy of Sciences, Wuhan, China
- 4Botany Department, Jomo Kenyatta University of Agriculture and Technology, Nairobi, Kenya
- 5East African Herbarium, National Museums of Kenya, Nairobi, Kenya
Acanthochlamys P.C. Kao is a Chinese endemic monotypic genus, whereas Xerophyta Juss. is a genus endemic to Africa mainland, Arabian Peninsula and Madagascar with ca.70 species. In this recent study, the complete chloroplast genome of Acanthochlamys bracteata was sequenced and its genome structure compared with two African Xerophyta species (Xerophyta spekei and Xerophyta viscosa) present in the NCBI database. The genomes showed a quadripartite structure with their sizes ranging from 153,843 bp to 155,498 bp, having large single-copy (LSC) and small single-copy (SSC) regions divided by a pair of inverted repeats (IR regions). The total number of genes found in A. bracteata, X. spekei and X. viscosa cp genomes are 129, 130, and 132, respectively. About 50, 29, 28 palindromic, forward and reverse repeats and 90, 59, 53 simple sequence repeats (SSRs) were found in the A. bracteata, X. spekei, and X. viscosa cp genome, respectively. Nucleotide diversity analysis in all species was 0.03501, Ka/Ks ratio average score was calculated to be 0.26, and intergeneric K2P value within the Order Pandanales was averaged to be 0.0831. Genomic characterization was undertaken by comparing the genomes of the three species of Velloziaceae and it revealed that the coding regions were more conserved than the non-coding regions. However, key variations were noted mostly at the junctions of IRs/SSC regions. Phylogenetic analysis suggests that A. bracteata species has a closer genetic relationship to the genus Xerophyta. The present study reveals the complete chloroplast genome of A. bracteata and gives a genomic comparative analysis with the African species of Xerophyta. Thus, can be useful in developing DNA markers for use in the study of genetic variabilities and evolutionary studies in Velloziaceae.
Introduction
Velloziaceae is a monocotyledonous family of flowering plants consisting of five genera and c. 250 species (Mello-Silva et al., 2011; Behnke et al., 2013). It is classified under the small but morphologically diverse order Pandanales together with Cyclanthaceae, Pandanaceae, Stemonaceae, and Triuridaceae (Angiosperm Phylogeny Group, 2009; Chase et al., 2016). Basing on its generic limits and distributional patterns, it is one of the most interesting plant families that occur in Africa mainland, Madagascar, Arabian Peninsula, and South America (Porembski and Barthlott, 2000; Ibisch et al., 2001; Alves and Kolbek, 2010). Three genera occur in South America, of which two are endemic to Brazil (Barbacenia Vand., Vellozia Vand.) and the third occurs in the Andean region (Barbaceniopsis L.B.Sm.). A fourth genus, Xerophyta Juss., grows in tropical Africa, Arabian Peninsula and Madagascar (Gardens, 2016), and the fifth genus, Acanthochlamys P.C. Kao, is endemic to China, native to Tibet and Sichuan (Ibisch et al., 2001; Mello-Silva et al., 2011; Bao-Chun, 2017). Most species of Velloziaceae occur in the tropical regions of South America, and c.70 species occur in the Old world (Behnke et al., 2013). The plant family mainly consists of shrubs and herbs having stems with persistent leaf-sheaths and fibrous root structure (Beentje, 1994). It is the largest lineage of resurrection plants among angiosperms with its species having varying degrees of desiccation tolerance (Alcantara et al., 2015). This is because its species display different strategies to desiccation, with some of species being able to completely avoid desiccation (Alcantara et al., 2015).
The family is one of the classical examples of “Taxonomic nightmares” among plants, due to its floral similarities and the huge variabilities in the morphological features in terms of leaf form, size and life forms among others. Despite the unquestionable uniqueness of the family, there is still serious lack of phylogeographic synthesis about its species. This is because the vast majority of the available studies lack a phylogenetic perspective, and the information generated has been regarded as having little relevance for historical biogeography of both the New World and the Paleotropical species of Velloziaceae. In addition, only few species within the family have had their whole chloroplast genome sequenced including Xerophyta viscosa (Farrant et al., 2015), Xerophyta spekei (Wanga et al., 2020), and reported through a short communication showing their length and gene contents of their cp genomes. However, a comprehensive comparative analysis of these chloroplast genomes is still lacking.
Xerophyta Juss. is a genus that consists of small to large perennial herbs and shrubs, naturally occurring in Africa, Madagascar, and the Arabian Peninsula. Most species of this genus have evolved an adaptation to lose their chlorophyll and terminate the process of photosynthesis during periods of extreme drought hence are extremely desiccation tolerant plants (Tuba et al., 1996). Hence, it has been used in the experimental studies on desiccation tolerance (Deeba and Pandey, 2017). In the same vain, Acanthochlamys bracteata P.C. Kao is a dwarf perennial herb found in the grassland nearby bushland of xerophytic valley of China (Deeba and Pandey, 2017). This species was previously classified under the monotypic family Acanthochlamydaceae (Deeba and Pandey, 2017), however, basing on TrnL and rbcL genes sequence data, it was transferred into the family Velloziaceae (Salatino et al., 2001; Mello-Silva et al., 2011). Additionally, morphological shared characters which are similar in form, structure, and origin, mostly persistent leaves, nucellus, tripartite stem cortex, and phloem tube among others, supported its inclusion into Velloziaceae (Mello-Silva et al., 2011). Morphology, pollen structures and biochemistry have played an important role in the grouping of plants into different taxa (Asaf et al., 2019). However, more emphasis has to be placed on molecular systematics to help understand the morphologically and biochemically similar plants through the genome-wide analysis of their chloroplast.
Systematics and phylogeny, since its inception, has boosted classification and understanding of the evolutionary relationships among plants through genomic analysis (Li et al., 2018; Khan et al., 2019). Furthermore, breeding of drought tolerant crops is key to curb the climate change effects and the growing human population (Dai, 2011; Farrant et al., 2015). Chloroplasts are not only useful in photosynthesis, but also a major genetic system together with the nucleus and the mitochondria (De Las Rivas et al., 2002; Daniell et al., 2016; Moon, 2018; Chen et al., 2019; Khan et al., 2019; Li et al., 2019; Zhou et al., 2019). Due to its highly conserved nature, slow rate of nucleotide substitution and its maternal heredity, Chloroplast DNA (cpDNA) has been widely used in genomics to study plant phylogeny thus an important and informative source for taxonomic and phylogenetic studies (Palmer, 1987; Sale et al., 1993; Lee et al., 2014; Li et al., 2018; Moon, 2018; Wang et al., 2018; Konhar et al., 2019; Li et al., 2019; Liu et al., 2019; Zhang et al., 2019; Oulo et al., 2020). The Plastome is circular, having a quadripartite structure and varies from 120kb to 170 kb, having small single copy (SSC) and Large single copy (LSC) regions, divided by two inverted repeats (IRa and IRb) (Zhao et al., 2015; Wang et al., 2018; Zhou et al., 2019). Plastome phylogenomics has led to tremendous advancements in NGS (next-generation sequencing) technologies hence genome sequencing is currently easier, faster and cheaper (Daniell et al., 2016; Li et al., 2017; Konhar et al., 2019; Khan et al., 2019; Liu et al., 2019). However, despite these advancements in sequencing technologies, there are still few plants that have had their chloroplast genome sequenced (Khan et al., 2019). Additionally, regardless of the uniqueness of Velloziaceae, there is still paucity of information available on the whole chloroplast genomes comparison. This present study reveals the sequenced chloroplast genome of A. bracteata and a performed phylogenetic analysis to validate its placement; together with X. spekei (MN663122) and X. viscosa (NC_043880) from the NCBI database. Additionally, we briefly discuss the morphological comparison between Xerophyta and Acanthochlamys. This will help in understanding the species in the family and also provide genetic resources for further analyses on the taxonomy and phylogeny of the Velloziaceae.
Materials and Methods
DNA Extraction and Sequencing
The fresh green leaves of A. bracteata were collected from Luhuo Sichuan at an altitude of 3045 m, China. They were sampled and immediately dried using silica gel in plastic bags (Chase and Hills, 1991). The voucher specimens were stored in the herbarium at Wuhan Botanical Garden, CAS (HIB) (China) with the voucher number DX-0006. 0.5g of the silica dried leaves was used for the DNA extraction using modified cetyltrimethylammonium bromide (CTAB) protocol (Doyle, 1991). Sequencing was done using illumina paired end technology platform at the Novogen Company in Beijing, China.
Genome Assembly and Annotation
After filtering the low-quality data and adaptors, the obtained clean data was assembled using Get Organelle version 1.7.4 software (Jin et al., 2020b), and then manually corrected. Gene annotation was done using Plastid Genome Annotator (PGA) (Qu et al., 2019) using the plastome of X. spekei as the reference genome. Geneious prime and GeSeq online tool1 (Tillich et al., 2017), was used to manually edit and correct annotations. The circular chloroplast genome map was drawn using the Organelle Genome DRAW (OGDRAW) software (Greiner et al., 2019). The divergence of A. bracteata, X. spekei and X. viscosa species genomes was determined using mVISTA (Frazer et al., 2004) in the glocal alignment algorithm (shuffle-LAGAN mode) and using A. bracteata as the reference genome.
Analysis of Repeats and Codon Usage
Long repeat sequences (forward, reverse, complimentary, and palindromic) in the genome sequence were identified using REPuter online program (Kurtz et al., 2001). Locations and sizes of the repeat sequence were visualized with a minimal standard of: (1) minimum repeat size of 30bp, (2) a hamming distance of 3, (3) 90% or greater identity. Tandem repeats in the 3 species of Velloziaceae; X. viscosa, X. spekei, and A. bracteata cp genomes were identified using the Tandem repeat finder (Benson, 1999) with inbuilt alignment parameters. Simple Sequence Repeats (SSRs) analysis was done using the Perl script Microsatellite (MISA)2 (Thiel et al., 2003), considering a nucleotide size of 1 to 6 base pairs and a threshold of 10, 5, 5, 3, and 3 for mono-, di-, tri-, tetra-, penta-, and hexa-nucleotides, respectively. The codon bias (RSCU) in the three species was conducted using MEGA7 software (Kumar et al., 2016).
Nucleotide Diversity and Substitution Rate Analysis
To assess the nucleotide diversity (Pi) in the complete Plastome of the three species, A. bracteata was compared with the species X. spekei and X. viscosa. The complete chloroplast genome (cpDNA) sequences were aligned using MAFFT in-built in phylosuite (Zhang et al., 2018). A sliding window analysis of window length of 600 bp and step size of 200 bp, was used in the DnaSP to estimate the nucleotide diversity values of each gene (Rozas et al., 2017). Protein-coding genes of A. bracteata, X. spekei, and X. viscosa were extracted using Phylosuite, aligned using MAFFT and Ka/Ks rates for each gene estimated using the Ka/Ks calculator (Zhang et al., 2006). Selection pressure within the shared genes of the eleven species of the order Pandanales was evaluated using PAML v4.7 (Yang, 2007), executed in the EasyCodeML software (Gao F. et al., 2019). The dN/dS ratio of the species of the order Pandanales (Pandanus tectorius, Carludovica palmata, Stemona tuberosa, Stemona mairei, Stemona japonica, Croomia pauciflora, Croomia heterosepala, Croomia japonica, X. spekei, X. viscosa, and A. bracteata) was also calculated based on four site specific models (M0 vs. M3, M1a vs. M2a, M7 vs. M8 and M8a vs. M8) with likelihood ratio test (LRT) threshold of p < 0.05 to show highly variable sites in the genome. The protein-coding genes were aligned in correspondence to their amino acids and selection pressures on the genes analyzed using both ω and LRTs values. We estimated the interspecific genetic distance with MEGA X using Kimura two-parameter (K2P) model3 (Kumar et al., 2018).
Phylogenetic Analysis
To understand the phylogenetic relationship of A. bracteata P.C. Kao with other species of the Order Pandanales, maximum likelihood (ML) and Bayesian inference (BI) trees were reconstructed. We generated 59 individual plastid gene files representing the shared protein-coding genes. Other representatives of the Velloziaceae (Vellozia sp., Xerophyta elegans, Barbacenia involucrata, Barbaceniopsis castillonii) were sampled from the gene bank based on a previous study (Soto Gomez et al., 2020). The 59 shared protein-coding genes of 55 species representatives from orders; Pandanales, Dioscoreales, and Liliales, were used to reconstruct the phylogeny using Elaeis guineensis as an outgroup based on previous study (Liu et al., 2012) (Supplementary Table 6). All the 55 species were subjected to MAFFT alignment, and the phylogenetic relationships estimated using the ML and BI analyses done using the IQ-Tree and MrBayes, respectively, integrated in Phylosuite (Zhang et al., 2018) (Supplementary Table 6). Model Finder (Kalyaanamoorthy et al., 2017) was used to find the best model using Bayesian Information Criterion (BIC). The model of best-fit for Bayesian analysis was GTR + F + I + G4, while that of IQ-tree was GTR + F + R3. The models GTR + I + G4 + F and GTR + F + R3 was run for 1000 replicates using ultrafast bootstraps.
Results and Discussion
Complete Chloroplast Genomes
The complete chloroplast sequence of A. bracteata was deposited in the GenBank database (Accession No. MW727487). All the three species’ whole chloroplast genome; A. bracteata, X. spekei, and X. viscosa exhibited a spherical quadripartite nature (Figure 1), with sizes of A. bracteata, X. spekei, and X. viscosa cp genomes being 153,843 bp, 155,235 bp (Wanga et al., 2020), and 155,498 bp, respectively, similar to most angiosperm Plastomes (Daniell et al., 2016). The cp genomes consist of Inverted repeats (IRs) (IRa and IRb) each with a length ranging from 27,022–27,110 bp within the three species. The Large Single-Copy (LSC) region in the three species showed length ranging from 81,919 to 83,813 bp and Small Single-Copy (SSC) region (17,387–17,880 bp) (Table 1). The LSC and SSC regions are separated by the IRs. Generally, the gene constituent of the chloroplast genome is approximately between 120 and 140 genes that are always actively involved in photosynthesis, transcription and translation processes (Gu et al., 2019). All the genes annotated in the cp genomes of the three species ranged between 129 and 132 genes, including 37–38 tRNAs and 8 rRNAs. The guanine-cytosine (GC) content of the three chloroplast genomes showed no significant difference, however, A. bracteata had a slightly lower GC content of 37.4% of the genome. The regions (LSC and SSC) had no considerable differences in the GC content in the three species. However, the IR regions showed a higher GC content of 42.6%. This is due to the presence of the rRNA and tRNA genes which occupy greater area than the protein-coding genes within the inverted repeat regions (Table 2). This phenomenon has also been shown in previous studies (Talat and Wang, 2015; Chen et al., 2016).
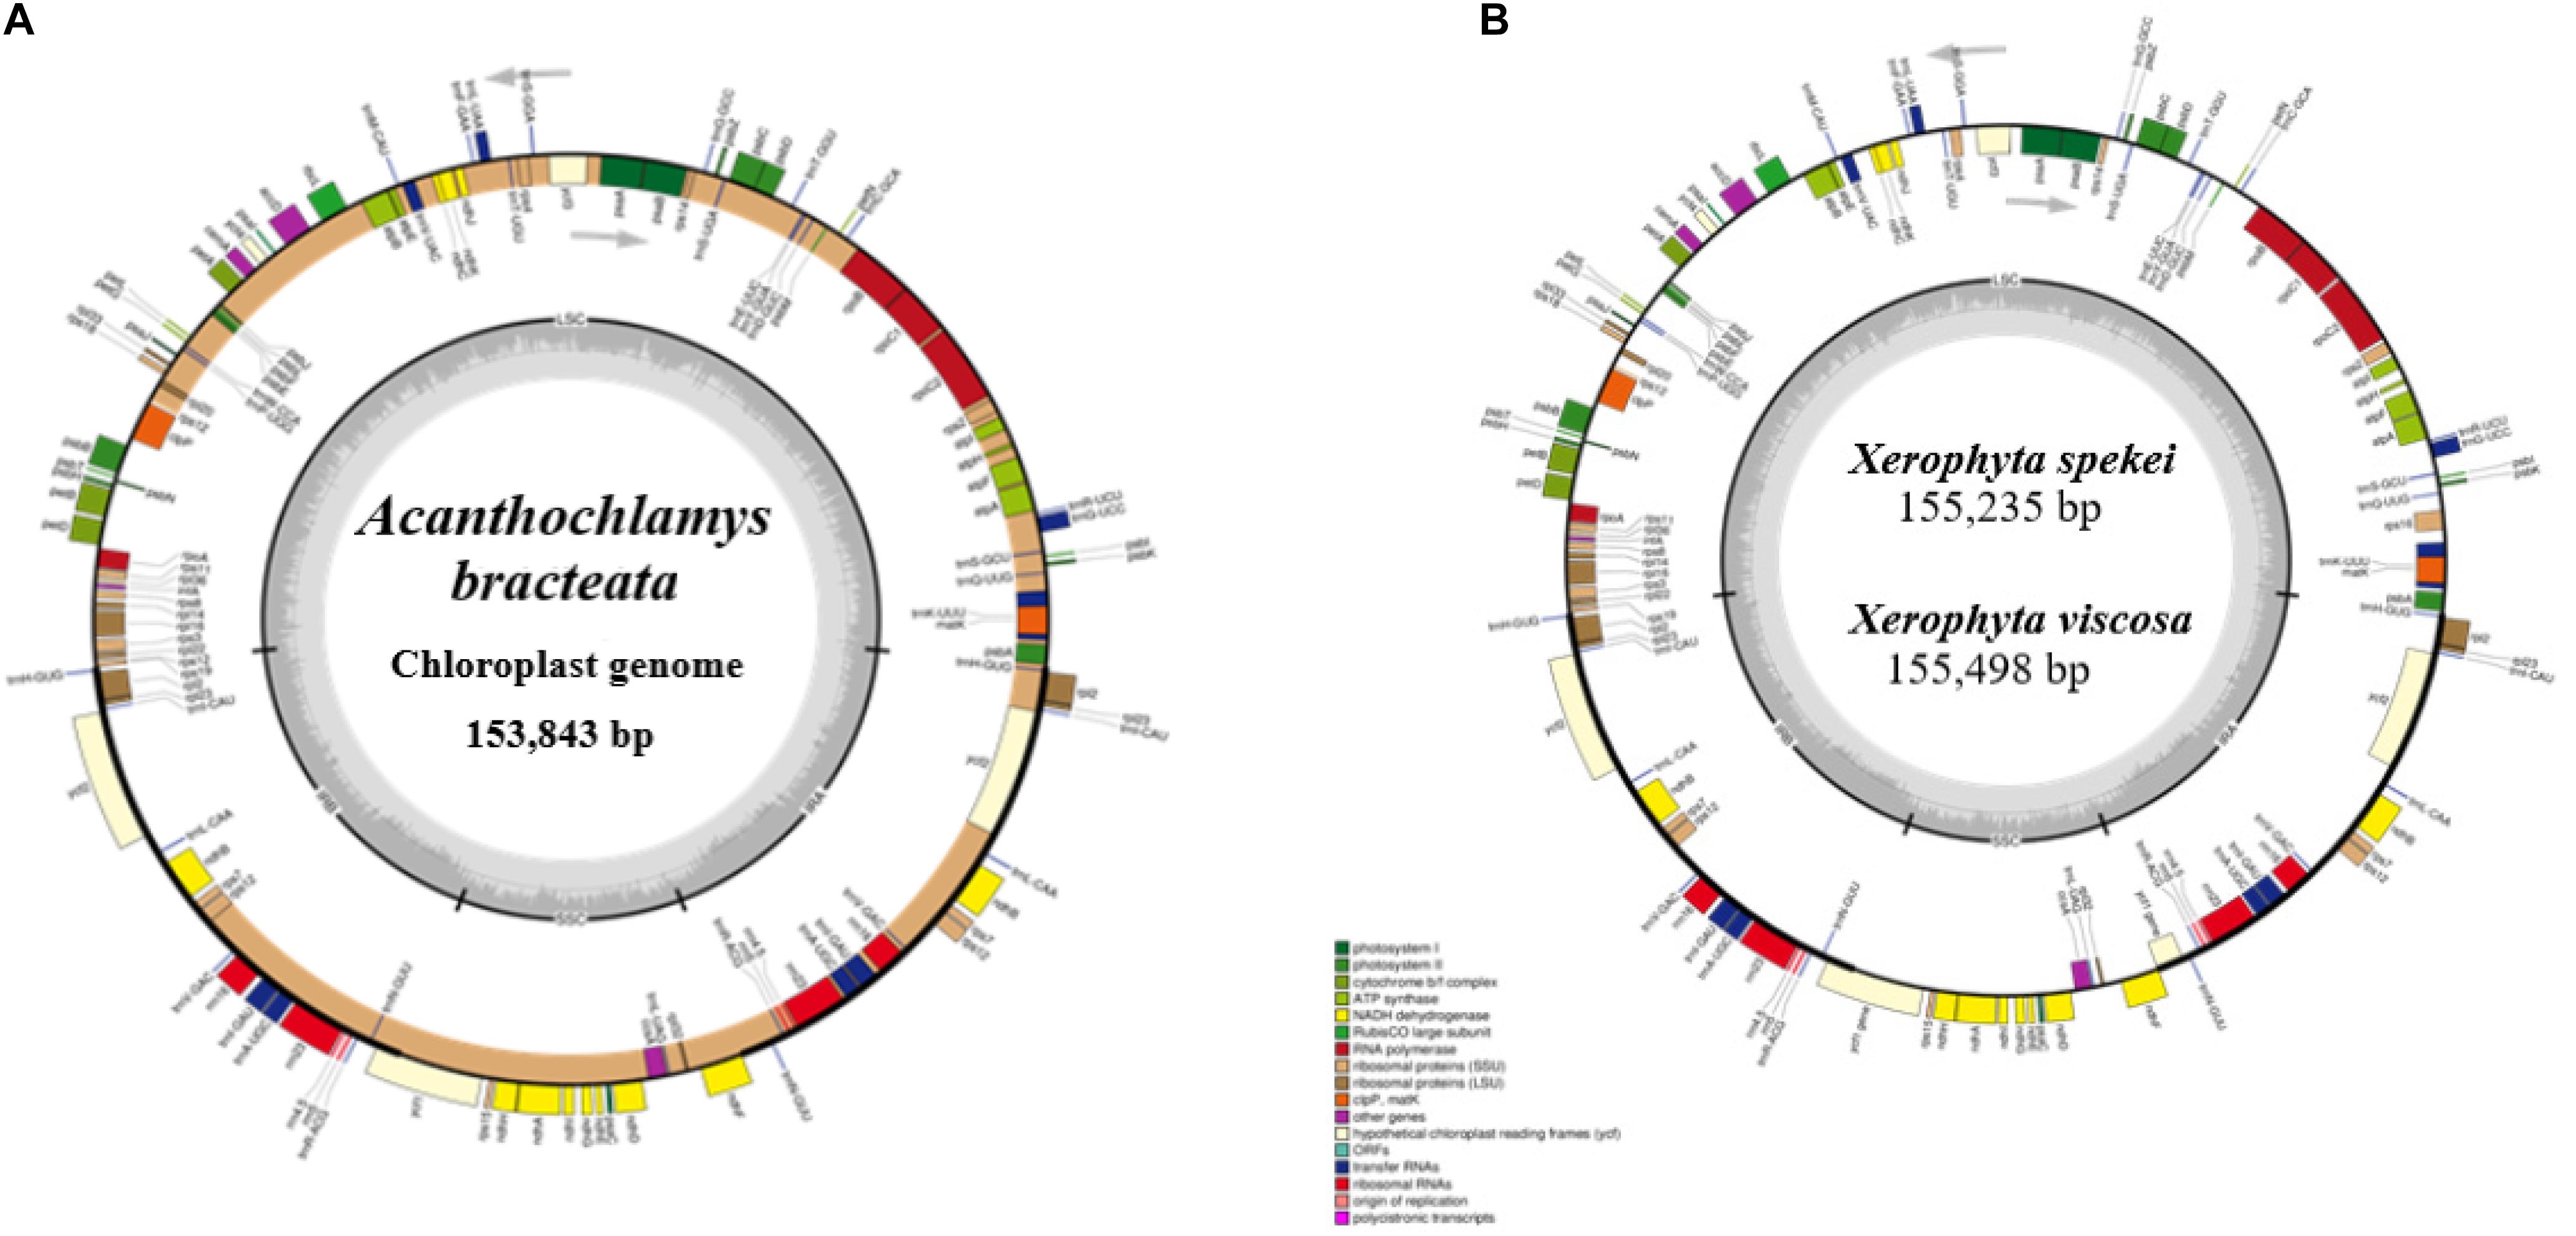
Figure 1. Genome of map of: (A) Acanthochlamys bracteata; (B) Xerophyta spekei, and Xerophyta viscosa. The genes shown inside and outside the circular maps are transcribed clockwise and anticlockwise directions, respectively. Genes from different functional groups are shown in different colors. The thick dark lines show the extent of the Inverted repeats (IRa and IRb) separating the Large Single-Copy (LSC) and the Small Single-Copy (SSC) regions. The dark gray and the light gray lies embedded inside the circle represent the GC and the AT content, respectively.
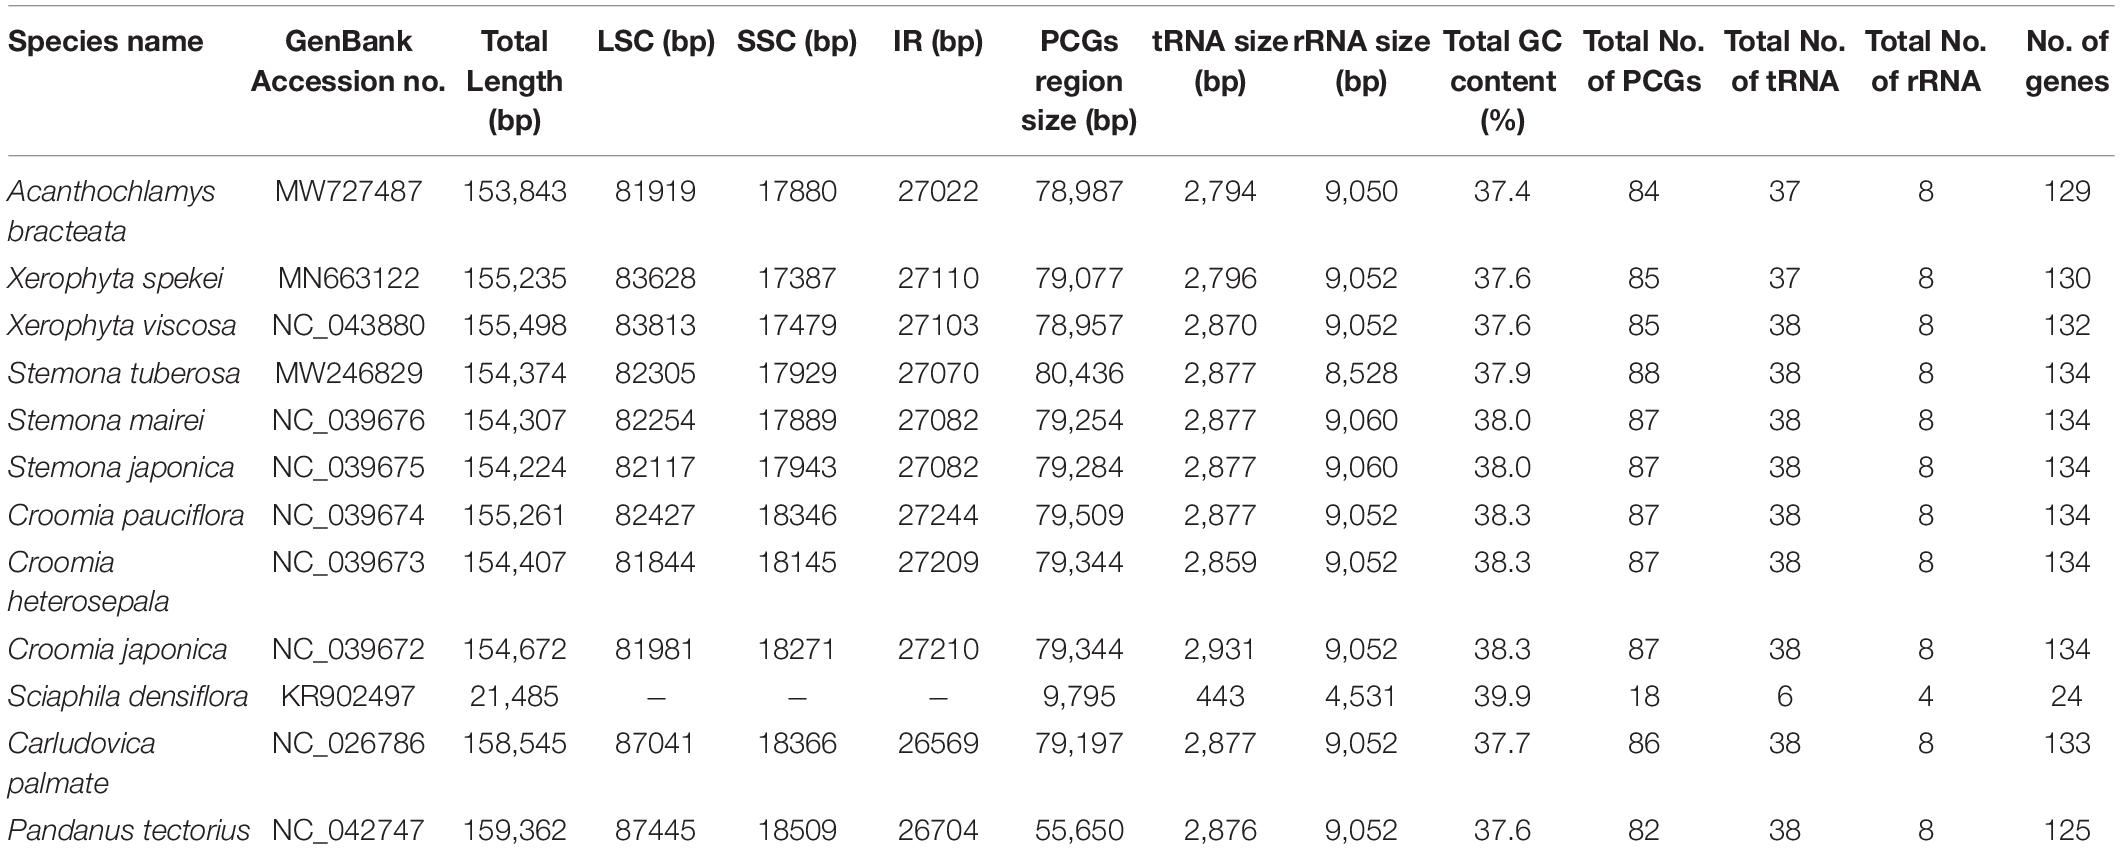
Table 1. Composition of Acanthochlamys bracteata, Xerophyta spekei, Xerophyta viscosa cp genomes with related species of the Order Pandanales.
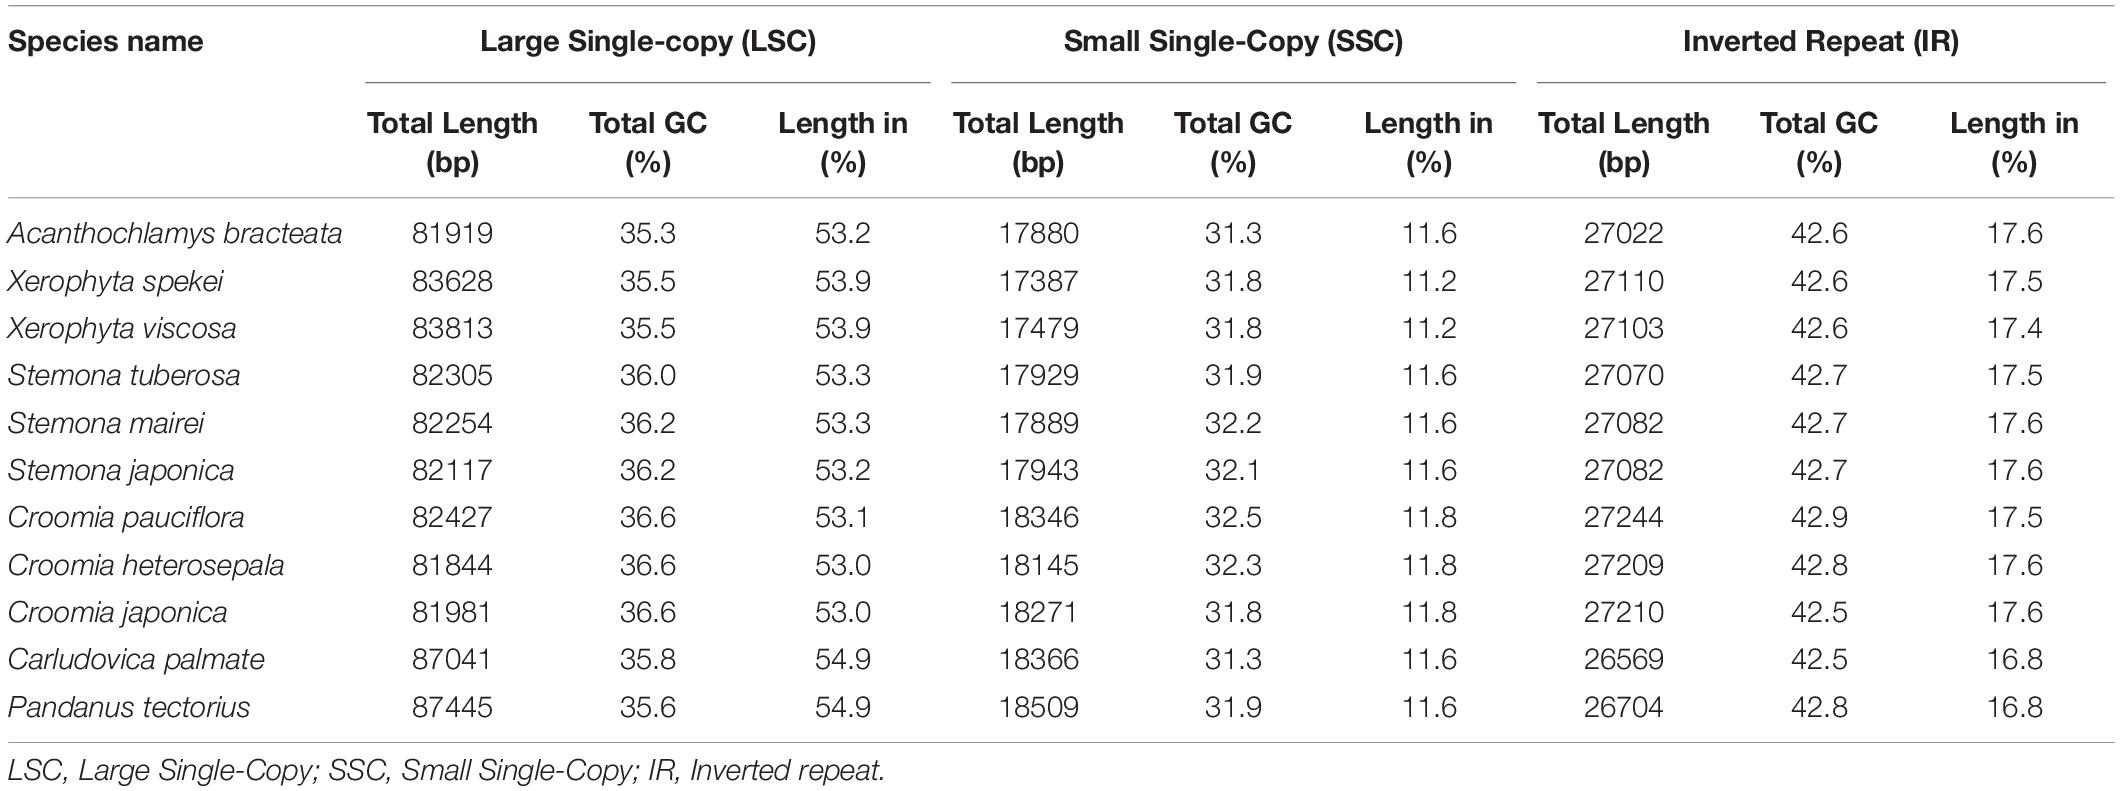
Table 2. Features of the LSC, SSC and IR of the Order Pandanales’ Plastomes.
The genomes contain protein-coding genes ranging from 84 or 85 in number, transfer RNA genes (tRNA) ranges from 37 or 38 in number, and 8 rRNA genes (Table 1). A significant number of genes occur in the LSC and SSC regions. However, 17 genes are recurrent in the inverted repeat (IRa and IRb) regions. These include six coding genes (ndhB, rpl2, rps12, rpl23, rps7, ycf2); and the non-coding include seven transfer RNA species (trnA-UGC, trnI-CAU, trnI-GAU, trnH-GUG, trnN-GUU, trnR-ACG, and trnV-GAC) and four ribosomal RNA species (rrn4.5, rrn5, rrn16, and rrn23). ycf1 gene is a pseudogene which extends through the SSC and IR regions. rps12 gene is located in both the LSC and the Inverted repeat (IR) regions. 63 protein-coding genes and 21 tRNA genes are found in the LSC region, while the SSC region has 12 protein-coding genes and 1 tRNA; and the IR region contain 7 PCGs and 7tRNA. The protein-coding genes in the A. bracteata cp genome include: rpl2, rpl14, rpl16, rpl20, rpl22, rpl23, rpl32, rpl33, rpl36, rps2, rps3, rps4, rps7, rps8, rps11, rps12, rps14, rps15, rps18, rps19, psaA, psaB, psaC, psaI, psaJ, psbA, psbB, psbC, psbD, psbE, psbF, psbH, psbI, psbJ, psbK, psbL, psbM, psbN, psbT, psbZ, atpA, atpB, atpE, atpF, atpH, and atpI, which are largely involved in the functions of self-replication and photosynthesis. These patterns of protein-coding genes were found to be present in all the three species of Velloziaceae. Of the 84 protein-coding genes in A. bracteata, eight (ndhA, ndhB, rpl2, rpoC1, atpF, petB, petD, and rpl16) contained one intron, while clpP and ycf3 each contained two introns (Supplementary Table 1). Introns generally play a critical role in regulating and signaling the expression of genes within the species (Daniell et al., 2016). Most importantly, plastome comparative studies provide key information on the present functional genes, rearrangements and genetic mutations that are key drivers of evolution in relation to their prehistorical origin (Sabater, 2018).
The gene content of the cp genomes of A. bracteata, X. spekei, and X. viscosa are shown in Tables 1, 2. Though, no significant differences were recorded in the number of encoded genes, the type of genes or the content of the GC of the three species, which suggests a focus on the intergenic regions for variations.
Repeat Analysis
Chloroplast repeats are important genetic resources that play a key role in the genome recombination and rearrangement (Lee et al., 2014). They are useful in the study of population genetics and biogeographic studies (Xie et al., 2018). In the current study, repeat analysis revealed that the Plastomes of the three species contained varied number of repeats (i.e., Palindromic, Forward, and Reverse repeats). The repeat analysis of A. bracteata revealed palindromic repeats (28), forward repeats (9) and reverse repeats (1). Out of which 9 palindromic, 8 forward and 1 reverse repeat are have a length of between 20 and 40 bp (Figure 2). In X. spekei there were only 18 palindromic repeats and 11 forward repeats with no reverse repeats. On the other hand, X. viscosa repeat analysis revealed 16 palindromic repeats, 11 forward repeats and 1 reverse repeat. Basing on the type of repeats, A. bracteata and X. viscosa showed similarity as compared to X. spekei. However, in terms of the number and length, there is a variation in the three species.
Figure 2. Analysis of the repeat sequences in the whole chloroplast genomes of A. bracteata, X. spekei, and X. viscosa. (A) Total abundance of the three repeats; (B) Total number of the Palindromic repeats; (C) Total number of the forward repeats; (D) Total number of the reverse repeats.
Microsatellites are small repeating units (1–6 nucleotide) within a genome nucleotide sequence (Shukla et al., 2018). They exhibit polymorphism and are usually dominantly expressed at the species level hence used as DNA markers for the population and evolutionary studies (Vendramin et al., 1999; Deguilloux et al., 2004; Piya et al., 2014; Redwan et al., 2015; Gao et al., 2018). In this study, we analyzed the presence, type, and allocation of SSRs in the cp genomes of A. bracteata, X. spekei, and X. viscosa. Mono-, di-, tri-, tetra-, and hexa-nucleotides types of SSRs were detected in the chloroplast genome of the three species.
90 SSRs were detected in A. bracteata cp genome. Comparably, 59 and 53 microsatellites were revealed in X. spekei and X. viscosa, respectively (Figure 3A). The mono-nucleotide repeats reported 58.91% of the total SSRs which made them the most abundant type of SSRs within the three species’ cp genomes. Their numbers vary from 52 in A. bracteata, 36 in X. spekei and 31 in X. vsicosa, followed by tetra-nucleotide repeats (17.82%), di-nucleotide repeats (13.37%), tri-nucleotide repeats (6.93%). Penta-nucleotide repeats (2.97%) were the least abundant and were only present in the species A. bracteata. The genes within the chloroplast genomes are always highly conserved, however, the microsatellite abundance varies among the species (Gao et al., 2018). A/T mononucleotide repeats were highest in number in all the cp genomes of the three species (Figure 3B). Our findings are similar to other studies that show that A/T repeats were the most abundant (Munyao et al., 2020). However, this varies among species with other studies recording di-nucleotides and tri-nucleotides as most abundant (Wang et al., 2017; Xie et al., 2018). Thus, this shows that SSRs are vital for understanding intrageneric and intergeneric variations within A. bracteata and its close relatives in Africa and South American species.
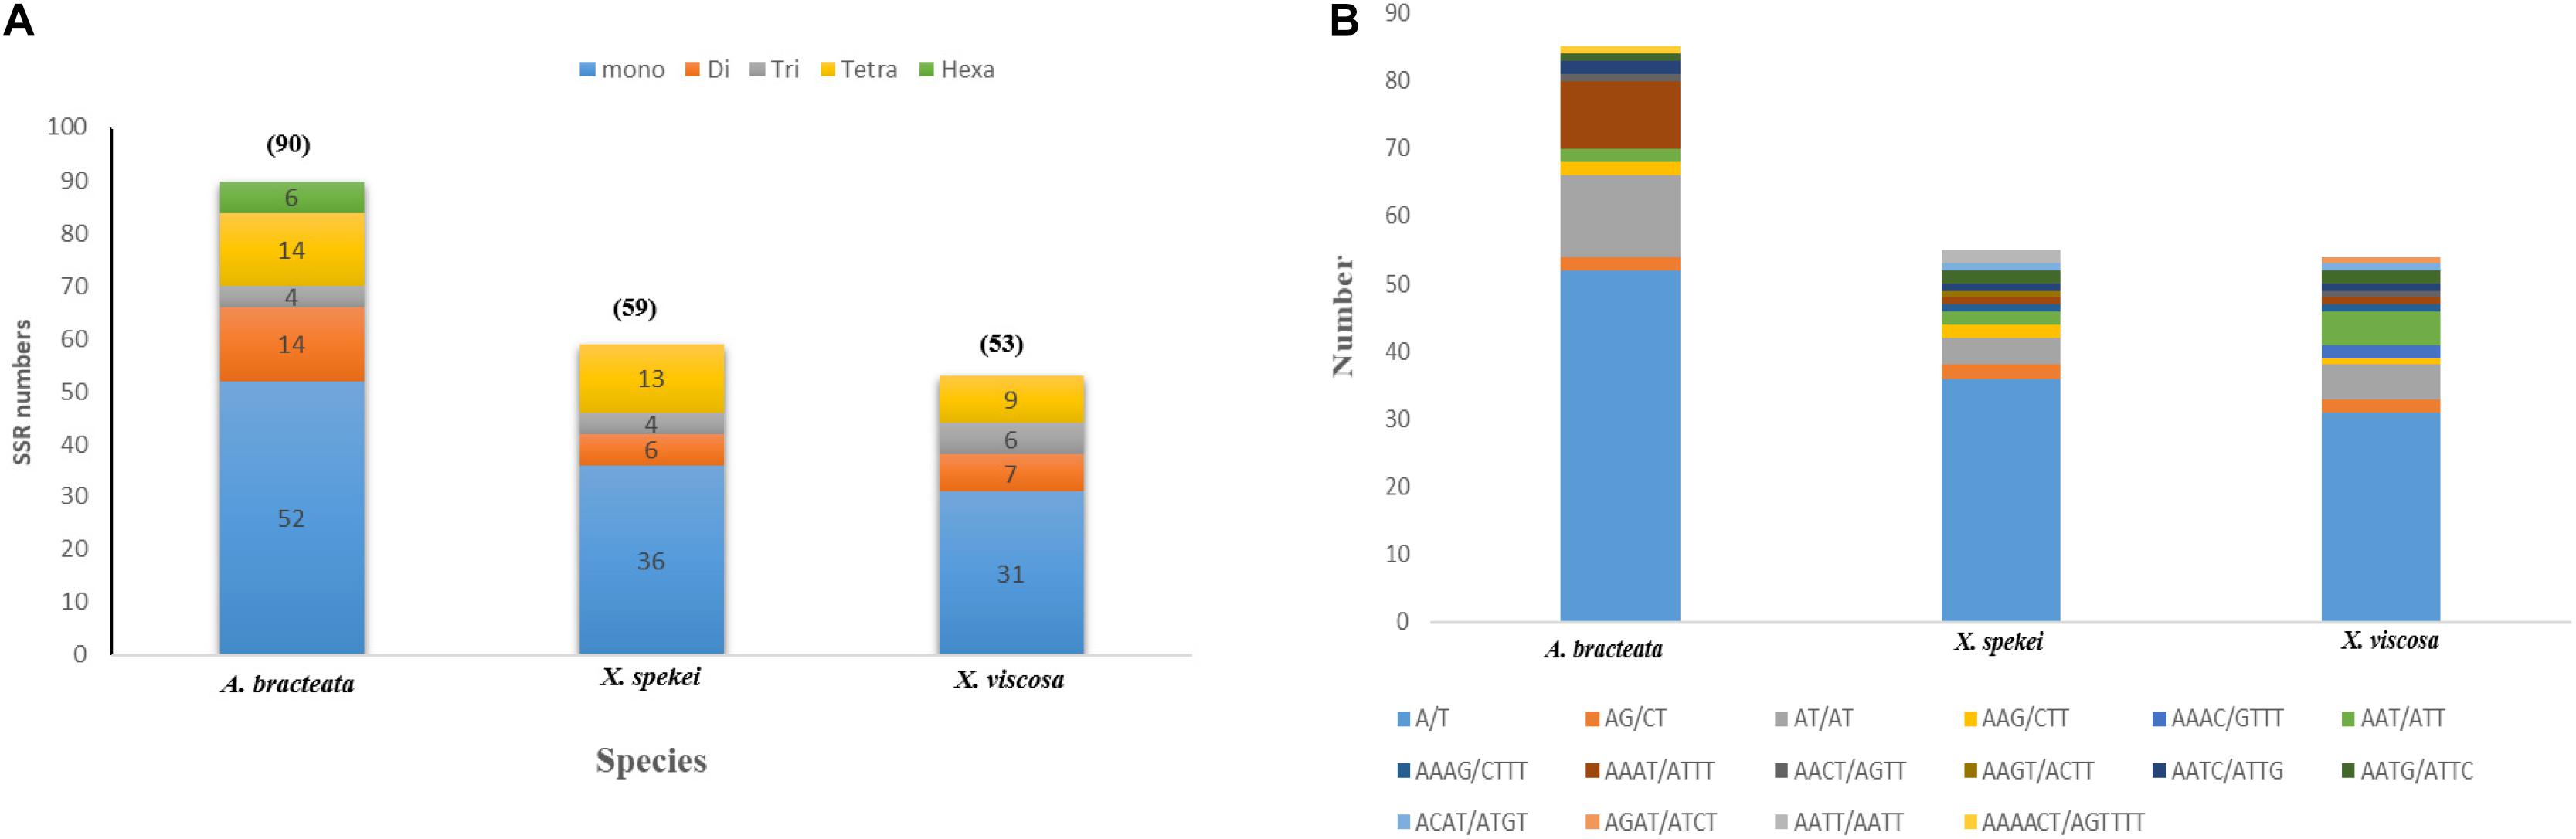
Figure 3. Plastome simple sequence repeats (SSRs) in the three species. (A) Total number of different SSR types identified in each species; (B) the type and total number of each SSR.
Our results show that SSRs within these chloroplast genomes are mostly comprised of poly-adenine (Poly-A) and poly-thymine (Poly-T) repeats. Hence, they contribute much to the AT abundance of the three species cp genome. The coding sequences also had SSRs mostly composing of the mono-nucleotide A/T which accounts for only 9.9%. This means that SSRs are mostly located in the non-coding regions. This trends have been shown in previous several studies (Rajendrakumar et al., 2007; Gandhi et al., 2010). These SSRs can be used to develop specific markers, which can be key in the study of systematics and evolution of the family.
Codon Usage
Codon usage is an essential feature for gene expression in both eukaryotes and prokaryotes genomes due to its strong correlation to protein and mRNA levels genome-wide (Lyu and Liu, 2020). It is the fact that different organisms vary in their synonymous codons rates of occurrences in their protein-coding sequences, meaning that some codons are rarely used while other codons are frequently used in a particular organism. Based on the protein-coding genes in the three species: A. bracteata, X. spekei, and X. viscosa, 51,281, 51,745, and 51,832 codons, respectively, were identified. Methionine and Tryptophan amino acids are encoded by a single codon. Other amino acids showed obvious codon usage bias. On average, the most abundant amino acids in the three species were leucine (A. bracteata 51341; 10.01%, X. spekei 5260; 10.17%, X. viscosa 4953; 9.56%) whereas the least abundant amino acid was Cysteine (A. bracteata 1144; 2.23%, X. spekei 1073; 2.07%, X. viscosa 1154; 2.23%). The relative synonymous codon usage (RSCU) analysis showed that A. bracteata (32 codons), X. spekei (33 codons), and X. viscosa (33 codons) were >1, indicating a codon bias in the amino acids (Figure 4). Most (28 codons) of these preferred codons in the three species, ended in an A or U. Codon usage bias is a product of selection and mutation factors (Xu et al., 2011; Liu et al., 2018). Hence, the choice of codons within the plastome can be used to show gene expressions and speciation mechanisms in species.
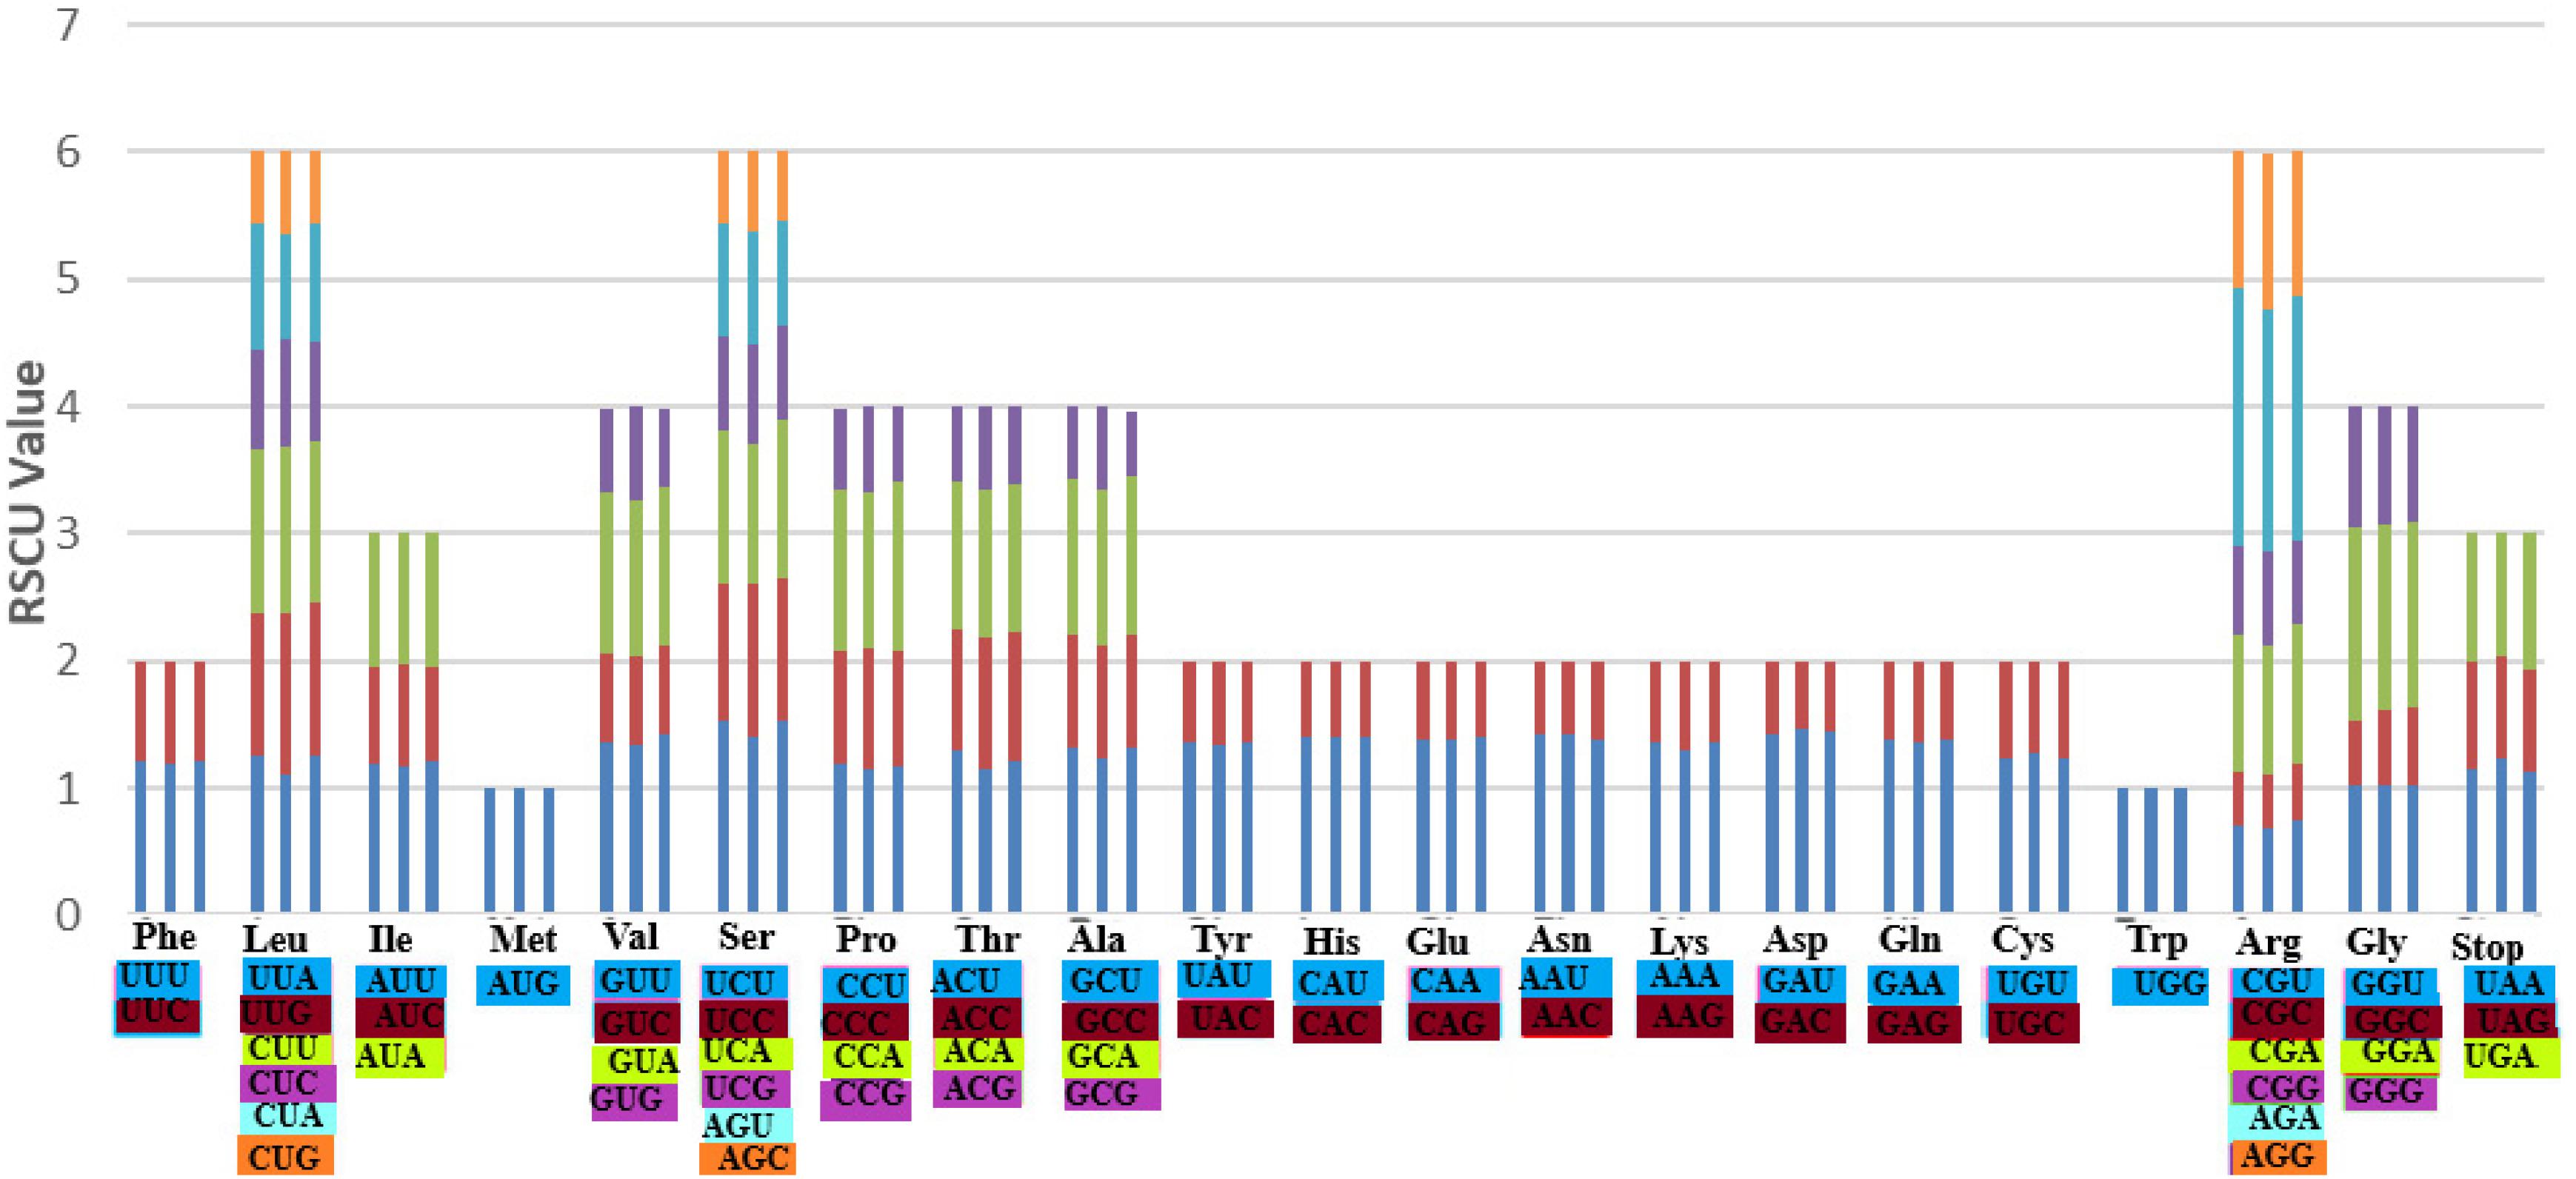
Figure 4. The codon usage bias in all the protein-coding genes of the chloroplast genomes of the three species A. bracteata, X. spekei, and X. viscosa.
Nucleotide Diversity (Pi) and Selection Pressure Analysis
The average Pi value of the three species of Velloziaceae was found to be 0.03501. IR regions showed lower nucleotide diversity indicating that they were quite conserved than the LSC and SSC regions (Figure 5). The nucleotide diversity (Pi) showed values ranging from 0.00111 to 0.14000 in the shared protein-coding genes. 20 regions showed values of Pi > 0.1000. These results indicated insignificant variations within these genome regions. However, high variations (Pi value > 0.1000) were found in these regions; psbK-psbI, trnQ-UUG/trnS-GCU, atpA, atpF, rps2, psbD/psbC, ndhK/ndhC, atpB/rbcL, ndhD, ndhG/ndhI, trnA-UGC, ycf1. The Large Single-Copy region (LSC) recorded most of the highly diverse regions.
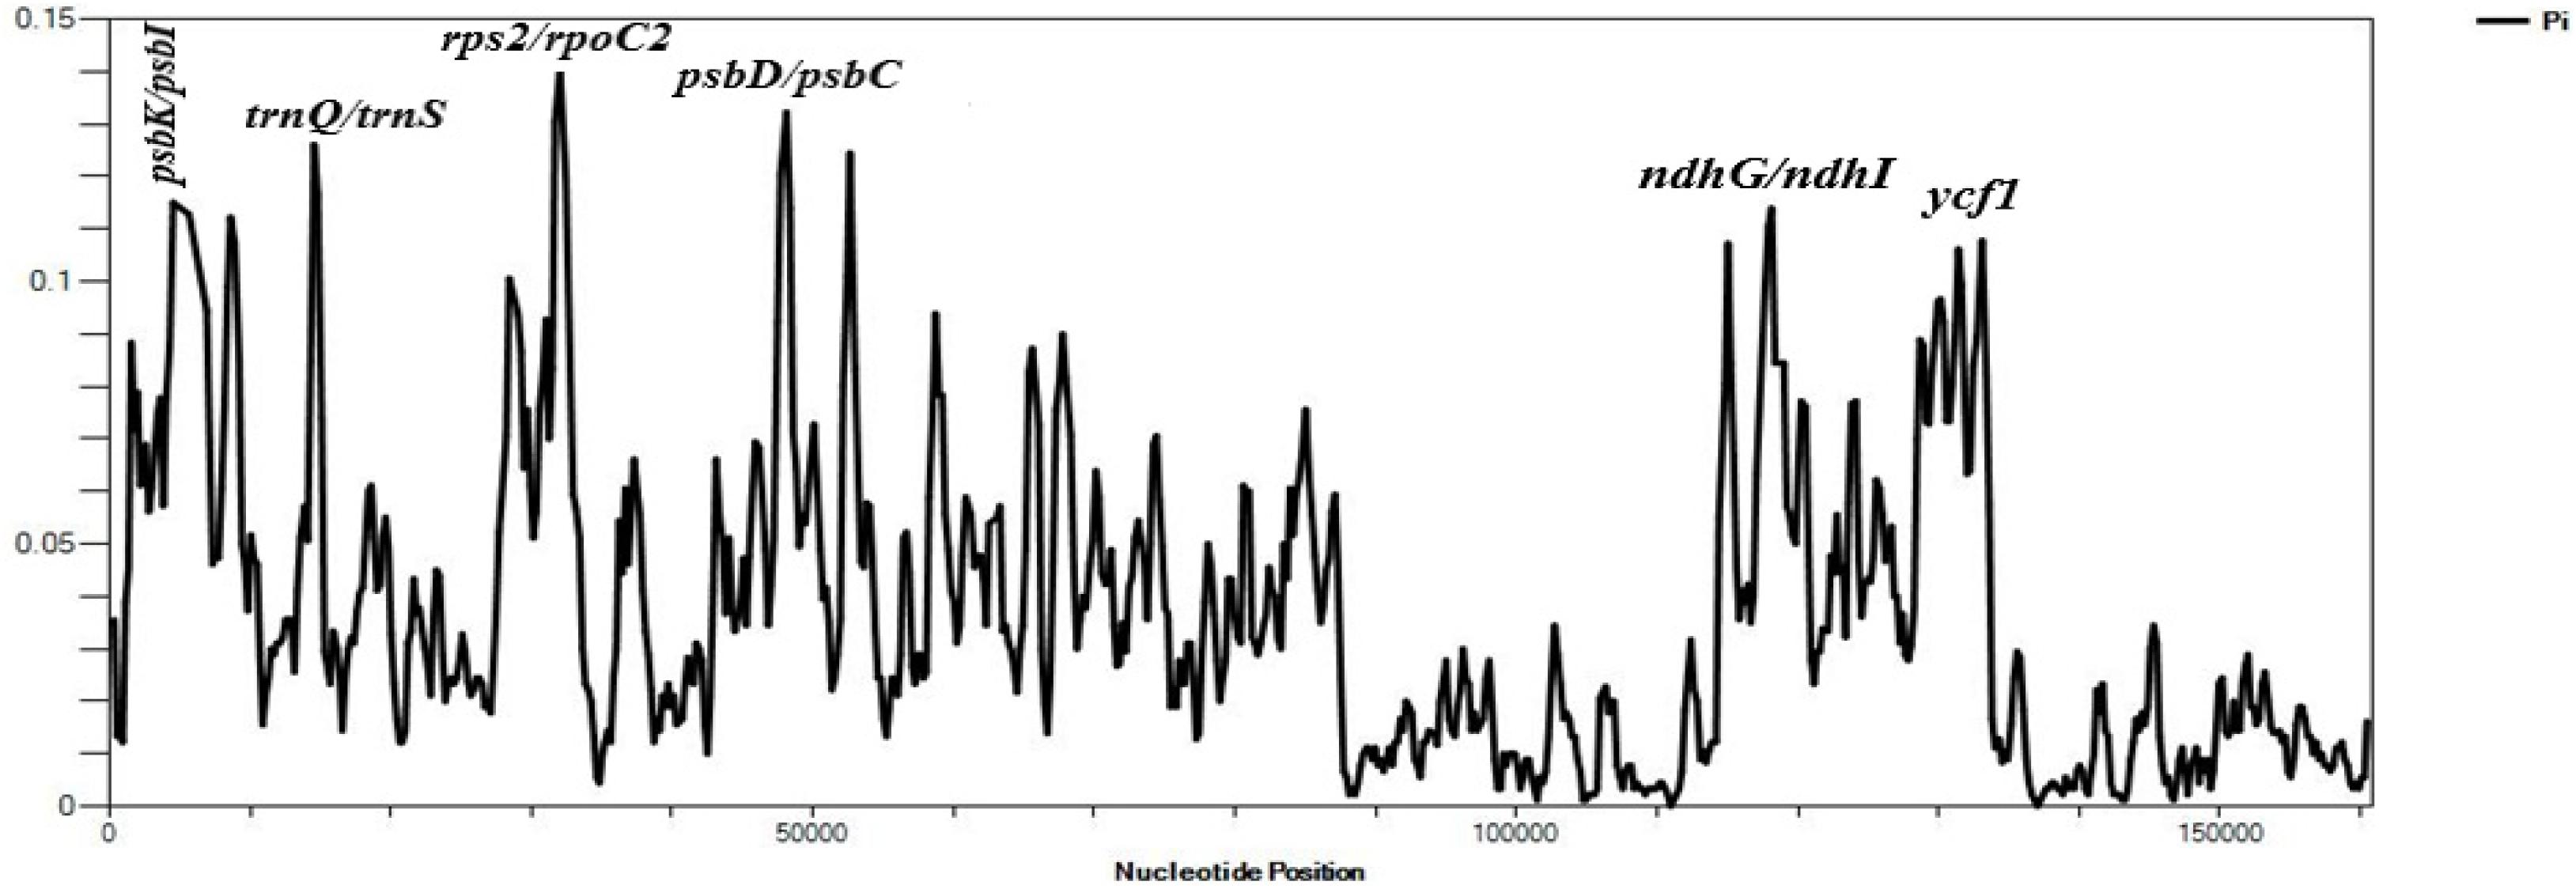
Figure 5. Sliding window analyses of the three whole cp genome sequences using a window length of 600 bp and step size of 200 bp. The nucleotide diversity (Pi) value of each window is shown on the Y-axis, and their positions showed on the X-axis.
Non-synonymous/Synonymous mutation ratio (Ka/Ks) is comprehensively effective in the detection of selection pressures in proteins or fragments of DNA sequences in plant species (Wang et al., 2010; Gao L. Z. et al., 2019; Xu and Wang, 2021). It is key in analyzing the evolutionary pressures within the genome. Synonymous substitutions are likely to occur in most protein-coding regions compared to non-synonymous substitutions (Rono et al., 2020). The synonymous substitutions leaves the amino acid unchanged as opposed to the non-synonymous substitutions which changes the sequence of the amino acid. In the current study, the estimated Ka/Ks ratios of the 73 protein-coding genes of A. bracteata, computed against the close relatives X. spekei and X. viscosa are shown in the line graphs below (Figure 6). The mean Ka/Ks ration for all the genes was 0.26. For protein-coding genes in the A. bracteata plastome, Ka/Ks ratios was majorly between 0 and 1. This suggest that the majority of the genes in the A. bracteata plastome were probably under purifying selection. The ccsA, ndhG, psbL, and ycf2 gene families had higher Ka/Ks ratios compared to most of the rest of the protein-coding genes in the plastome. Two genes (ycf2 and ndhG) showed a Ka/Ks ratio greater than 1 (Supplementary Table 2) in the pairwise comparisons, showing that they may have undergone some evolutionary pressures. Genes with Ka/Ks > 0.5 were ccsA, ndhB, ndhF, psbL, psbN, ycf1, and ycf2 in the computation against X. spekei; whereas in the estimation against X. viscosa, the genes included ccsA, ndhB, ndhF, ndhG, ndhK, psbL, psbN, rpl32, and ycf2 (Supplementary Table 2). In both estimations of the A. bracteata, the least significant Ka/Ks value (0.00) was found mostly in the genes involved in the processes of photosynthesis (psaC, ndhE, petG, psbJ, petL, petN, psaJ, psbC, psbE, psbF, psbI, psbM, and psbT), self-replicating genes (rpl14, rpl36, rps7, rps12) and hypothetical chloroplast reading frames (ycf3) indicating significant purifying selection. Similar results were reported for other cp genomes (Li et al., 2015). These three species occur in more or less similar habitat growing on inselbergs in China and Africa hence a conjecture that functional genes in the chloroplast genomes played a big role in the adaptations in these strenuous environments.
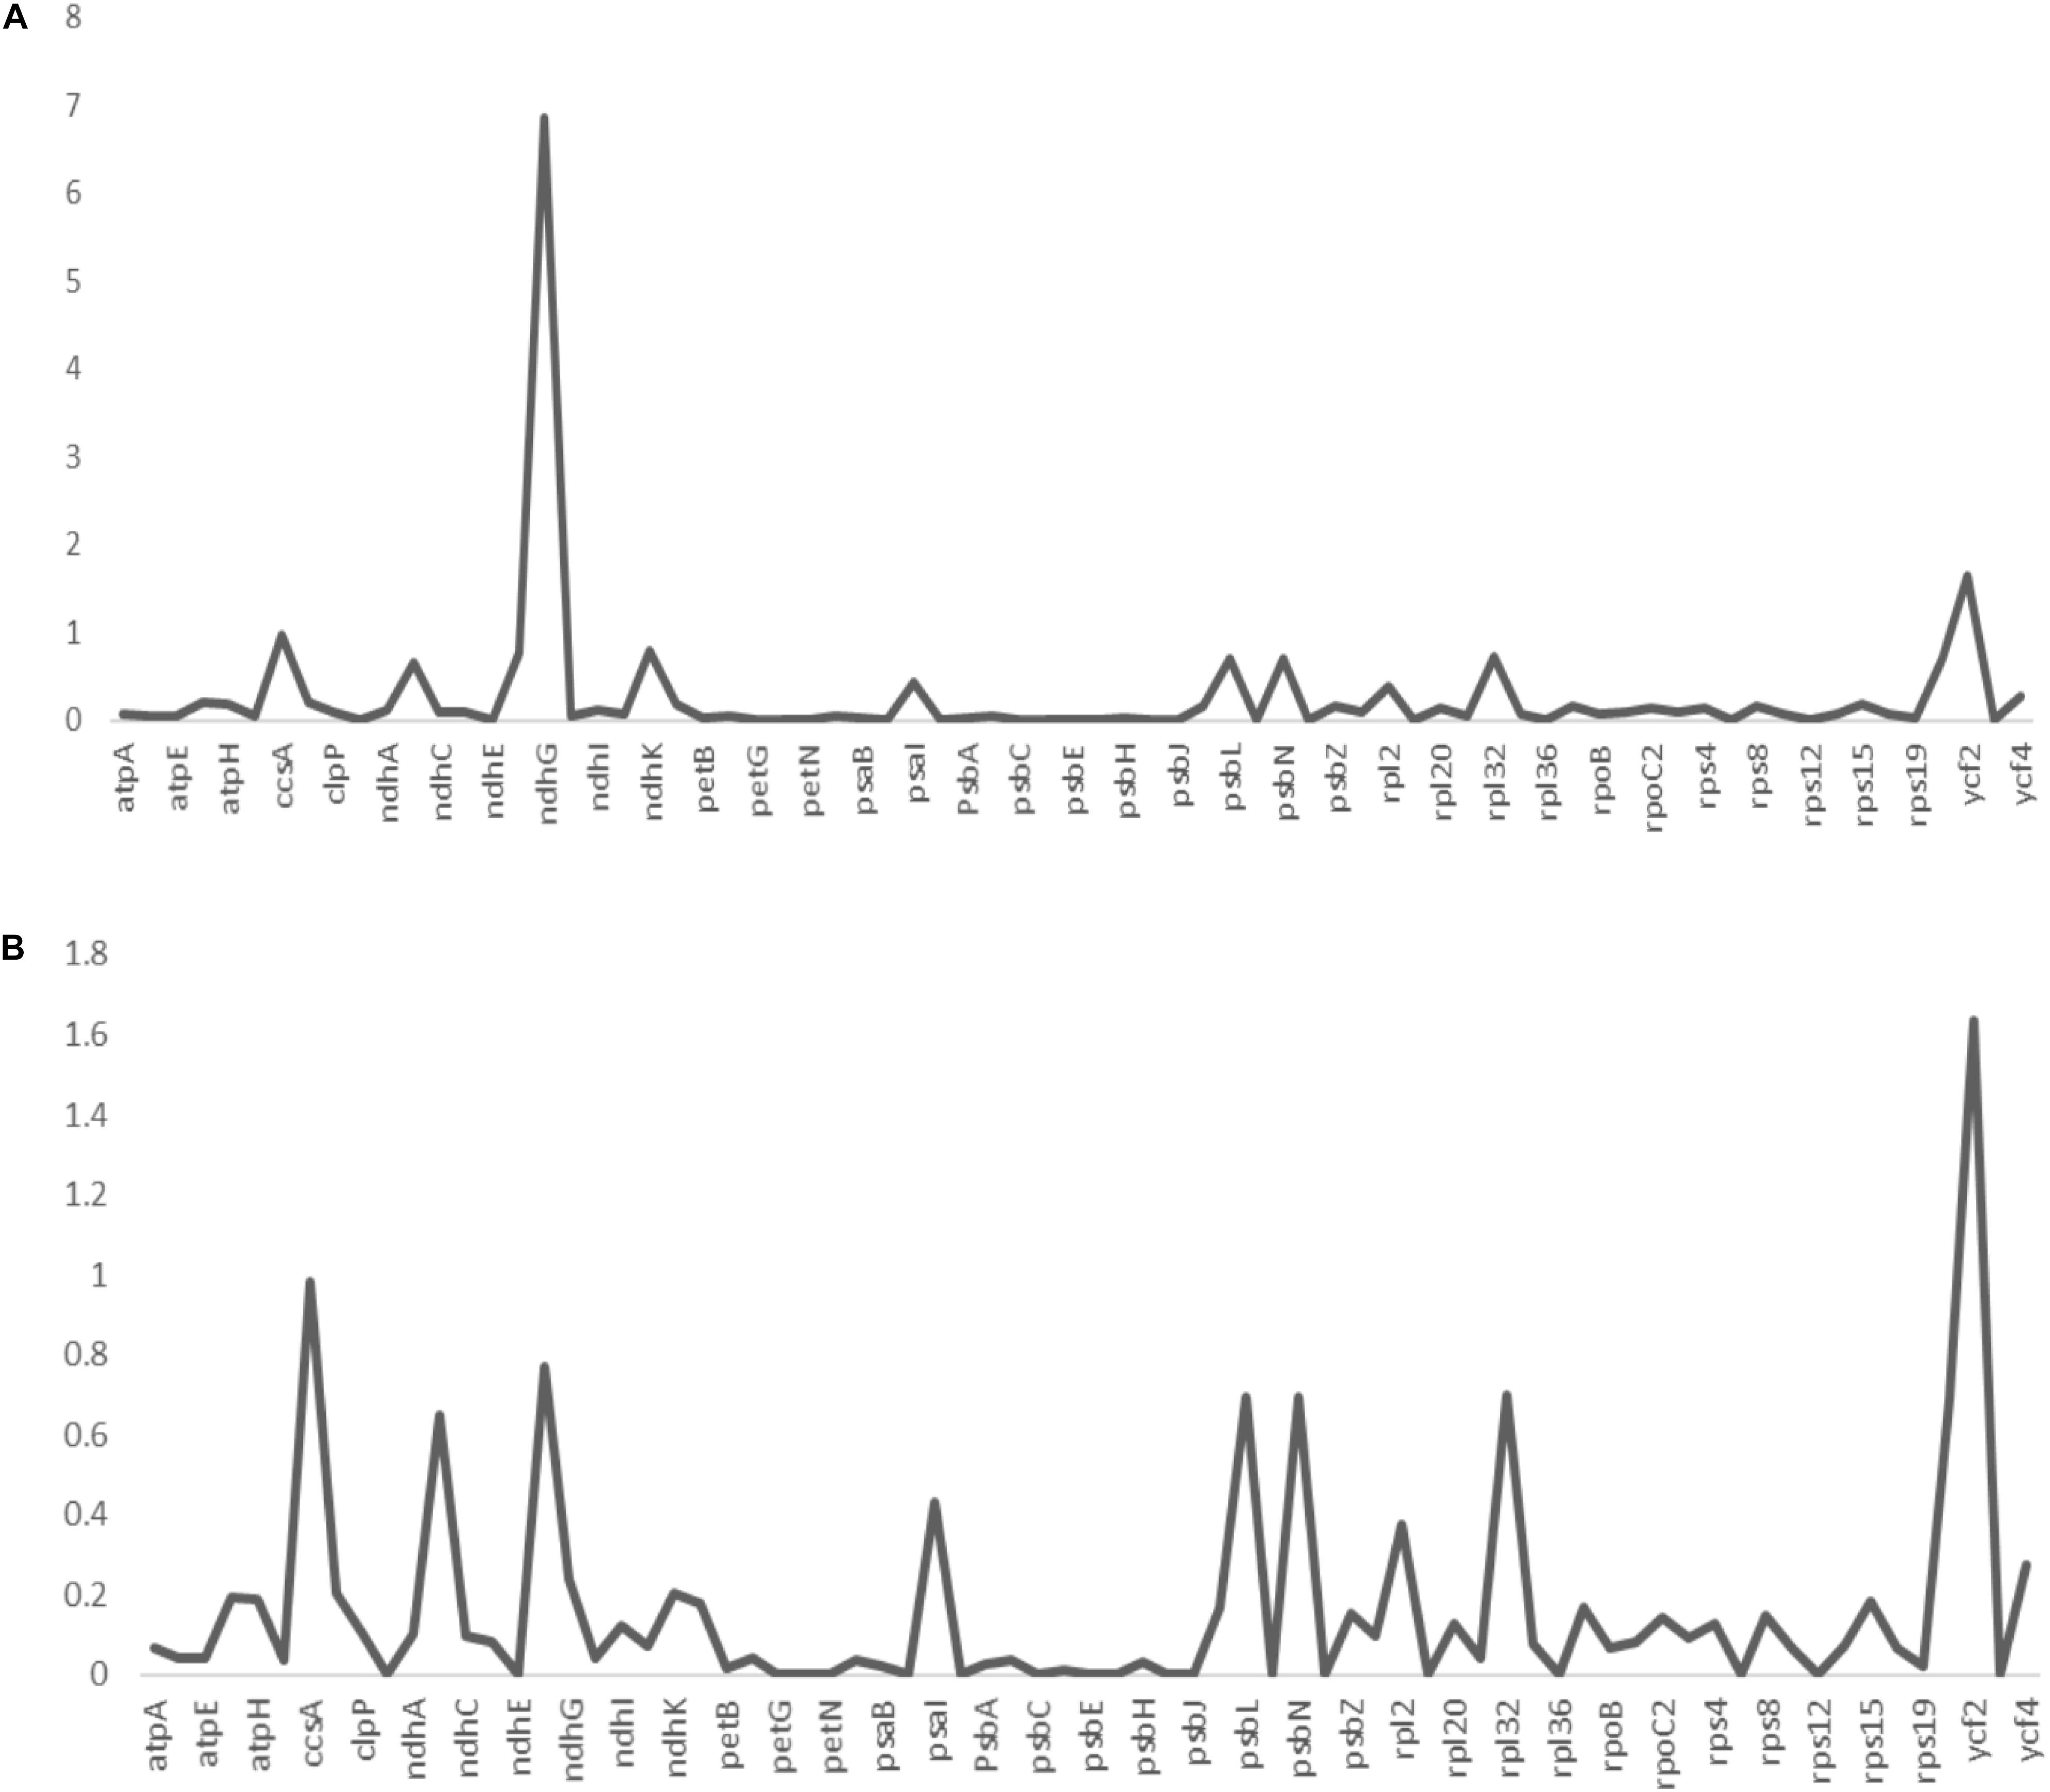
Figure 6. The non-synonymous-to-synonymous substitution (Ka/Ks) ratios of 73 coding genes of (A) Acanthochlamys bracteata plastome relative to Xerophyta viscosa and (B) Acanthochlamys bracteata plastome relative to Xerophyta spekei. Note: Y- axis represents the Ka/Ks values (ratios) while the X- axis represents the protein-coding genes within the chloroplast genomes.
The same protein-coding genes in the order Pandanales were used to detect sites of positive selection within their genomes. Four models (M0 vs. M3, M1a vs. M2a, M7 vs. M8 and M8a vs. M8) were compared in this analysis. Comparative model of M7 vs. M8 was positive in determining the LRT p value of >0.05 and the strength of positive selection of the genes. Bayes Emperical Bayes (BEB) and naïve empirical Bayes (NEB) analysis was only shown in model M8. Most genes showed no significant positive selection (p-value > 0.05) except eight genes with high posterior probabilities found in the BEB test (rps16, atpF, atpH, rpoC2, psaA,atpB, rbcL, accD) and NEB test (rps16, atpI, rpoC2, psbZ, rps14, ndhC, rbcL, accD) (Supplementary Tables 3, 4). Most of these genes that contained highly positively selected sites were mostly related to functions of photosynthesis and self-replication. Studies have linked these to codon sites with high posterior sites to be under positive selection pressure (Xie et al., 2018). Using K2P model in MEGA, the average interspecific genetic distance in the 77 PCGs for the 11 species in the Order Pandanales was estimated. On average, the K2P interspecific genetic distance was calculated to be 0.0831 (Figure 7 and Supplementary Table 5). The least K2P values were detected in psbL gene (0.0050) and the highest was in the gene ccsA (0.1374).
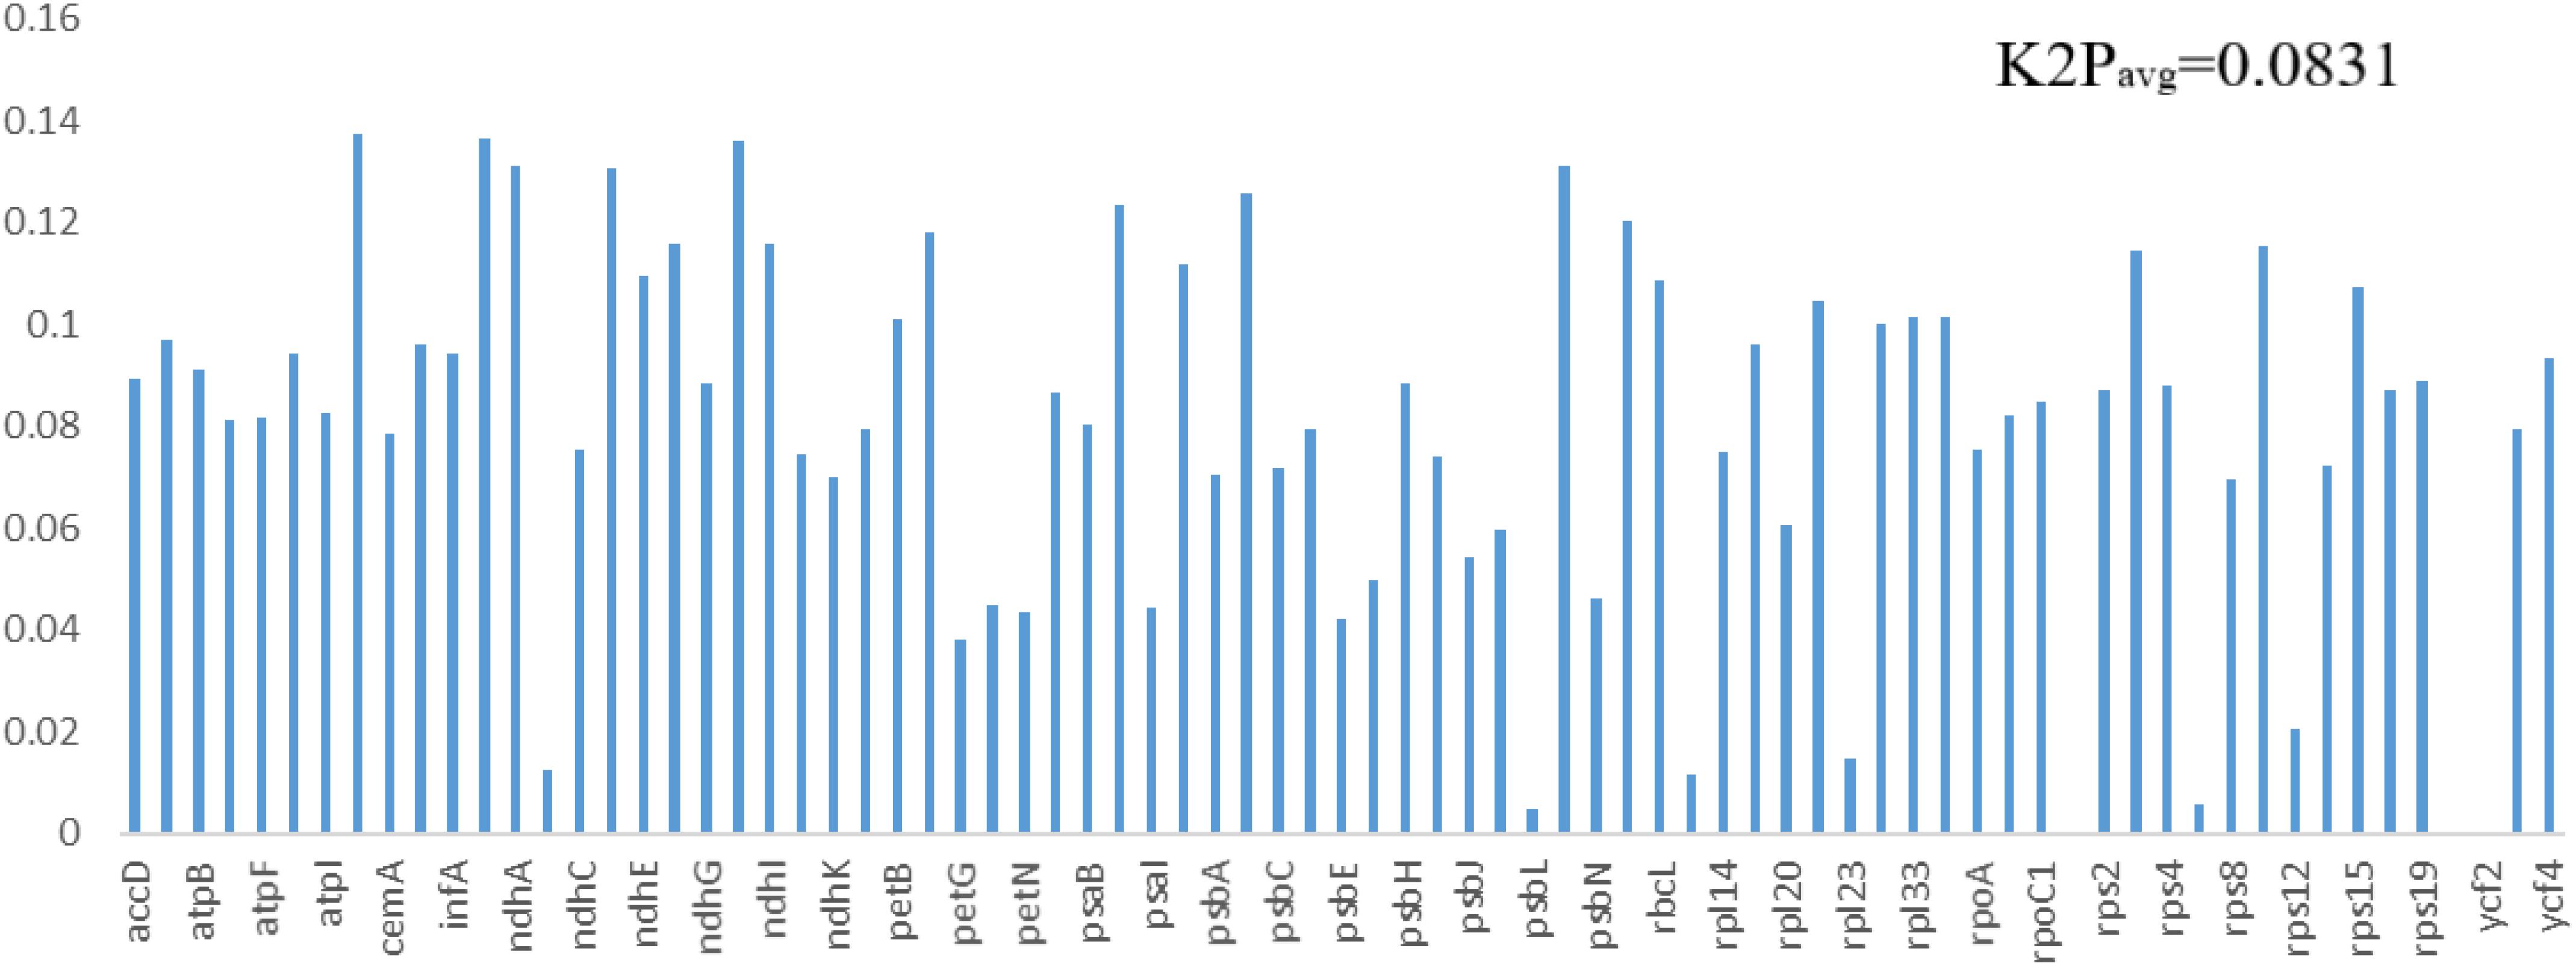
Figure 7. The K2P values estimated for the genes in the cp genomes of the 11 species in the Order Pandanales.
We compared the border structure of the three cp genomes in detail to identify the IR expansion or contraction (Figure 8). IR regions contained rpl2 and trnH genes. The location of the ndhF gene was in the SSC region, however, in the X. spekei it was located at the border junction of IRb and SSC region. The ycf1 gene is a pseudogene found at the junction of IRa and SSC region. In X. spekei and X. viscosa, the rps19 was located in the LSC region together with rpl22 gene, however, in A. bracteata the rps19 extended into the IRb with a 9 bp. There was a notable difference in the inverted repeat regions of the three species. The distance between psbA and the JLA junction varies from 111 bp to 117 bp. Inverted repeat regions in land plants’ cp genomes vary greatly (Khayi et al., 2020). However, studies show that they are the most conserved regions of the chloroplast genome (Asaf et al., 2020). Contraction and expansion of the IR regions leads to the size differences in the Plastomes (Mo et al., 2020). IRs are thought to stabilize the plastome with studies showing that Plastomes that lack one or all IRs are less stable in terms of their genome arrangements than the species genome that have the IRs (Jin et al., 2020a, b).
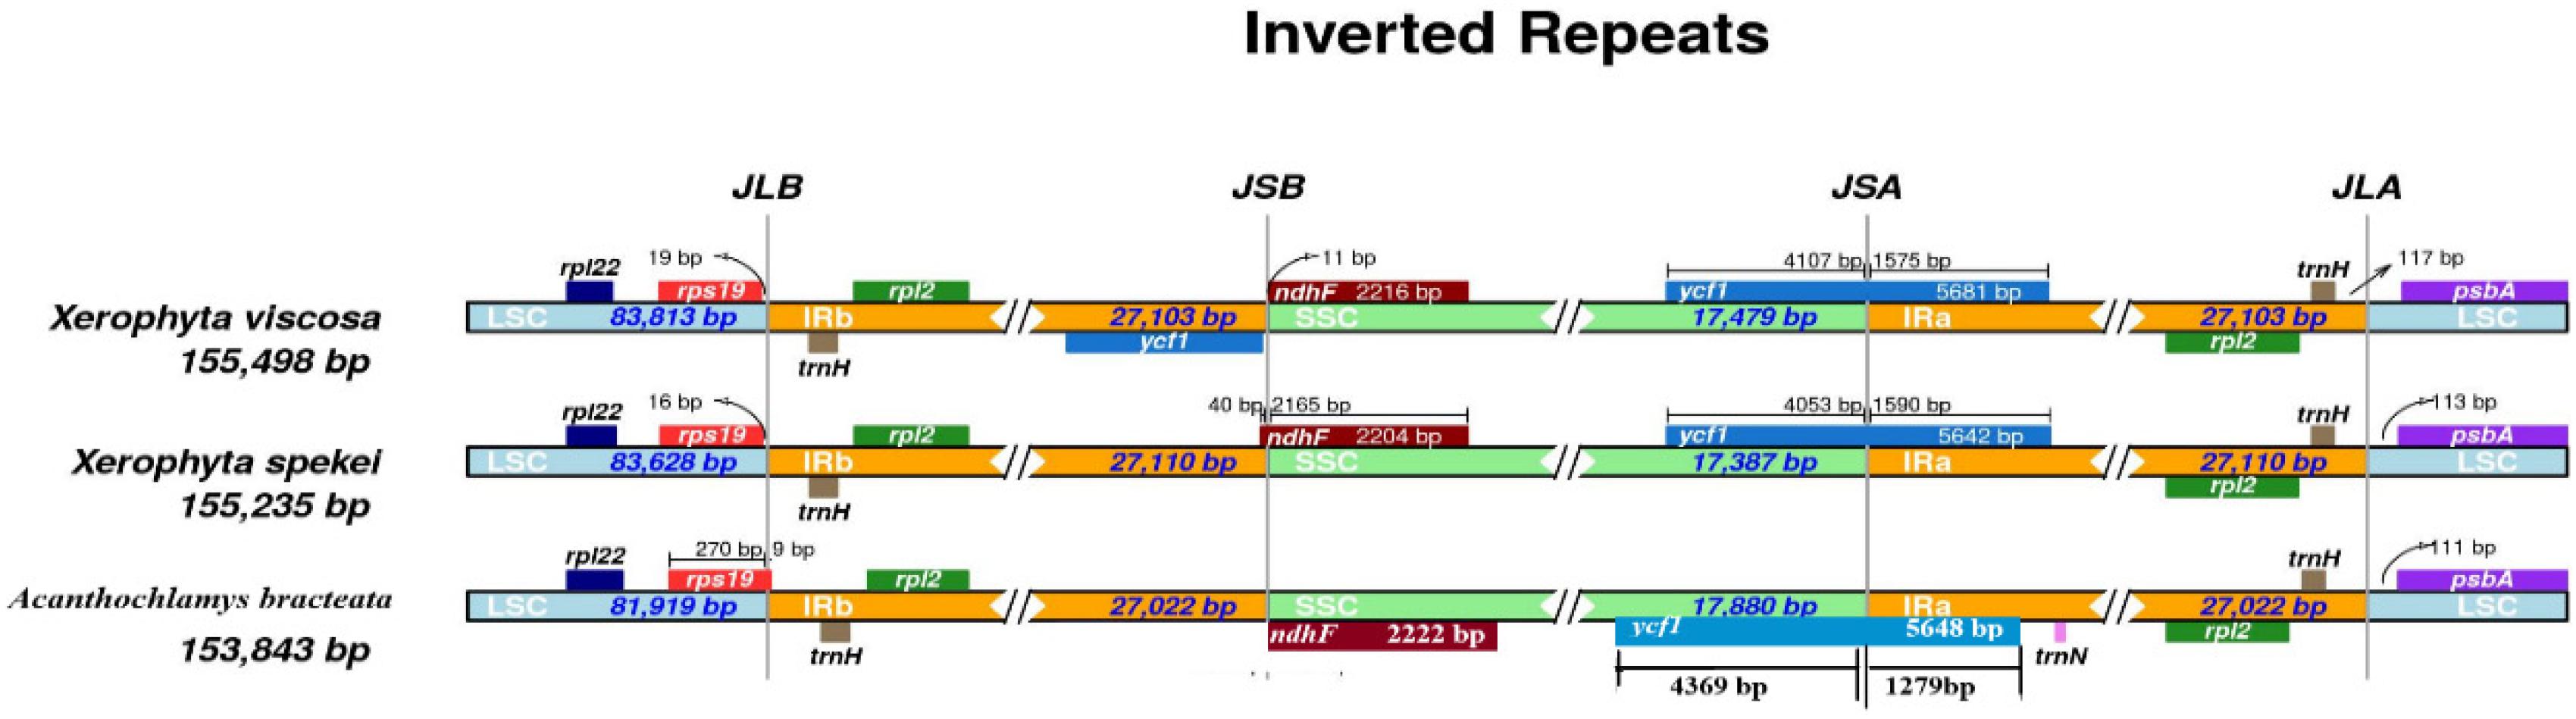
Figure 8. Junction sites comparison of the chloroplast genomes of the three species. JLB: junction line between LSC and IRb; JSB: junction line between IRb and SSC; JSA: junction line between SSC and IRa; JLA: junction line between IRa and LSC.
To understand structural characteristics of the cp genomes of the three species of Velloziaceae, whole sequence alignment was conducted using the annotation of A. bracteata as a reference (Figure 9). These three species all belong to the family Velloziaceae. The gene number, order and orientation were relatively conserved, although some highly divergent regions were found. The results show that all the three species cp genomes were 70% similar. High genetic inconsistency, however, occurred in the single-copy (LSC and SSC) regions compared to the IR regions. Similarly, non-coding regions also had higher gene variations than in the coding regions. The LSC and SSC regions are more divergent than the two IR regions. In addition, within the LSC and the SSC regions, the non-coding regions are more divergent than the coding regions. This kind of phenomenon has been shown in other studies (Wang et al., 2018). The most highly divergent regions include psbI-trnS(GCU), trnS(GCU)-trnG(UCC), ycf3-trnT(UGU), matK, psbK, ycf2, ndhF, rpl32, ycf1, ndhE, ndhD, ndhA, rps4, trnH-psbA, trnG-psaA, atpB-rbcL, and ndhF-rpl23. The IR regions were highly conserved in terms of gene order and abundance. However, at the border of the IR and single-copy regions there were notable significant differences. Hence, Velloziaceae Plastomes were quite well conserved, with few variations detected (Figure 9). Variations in the size of the genome, expansion and contraction of the IR junctions were the major differences in the 3 cp genomes structure. DNA barcodes are sections of DNA sequences with a high mutation rate that can be useful to identify a species in a given taxonomic group (Rousseau-Gueutin et al., 2015; Xu et al., 2015; Zhou et al., 2016). These major regions of variations can be important markers for barcoding and studies on the evolution within the species of Velloziaceae.
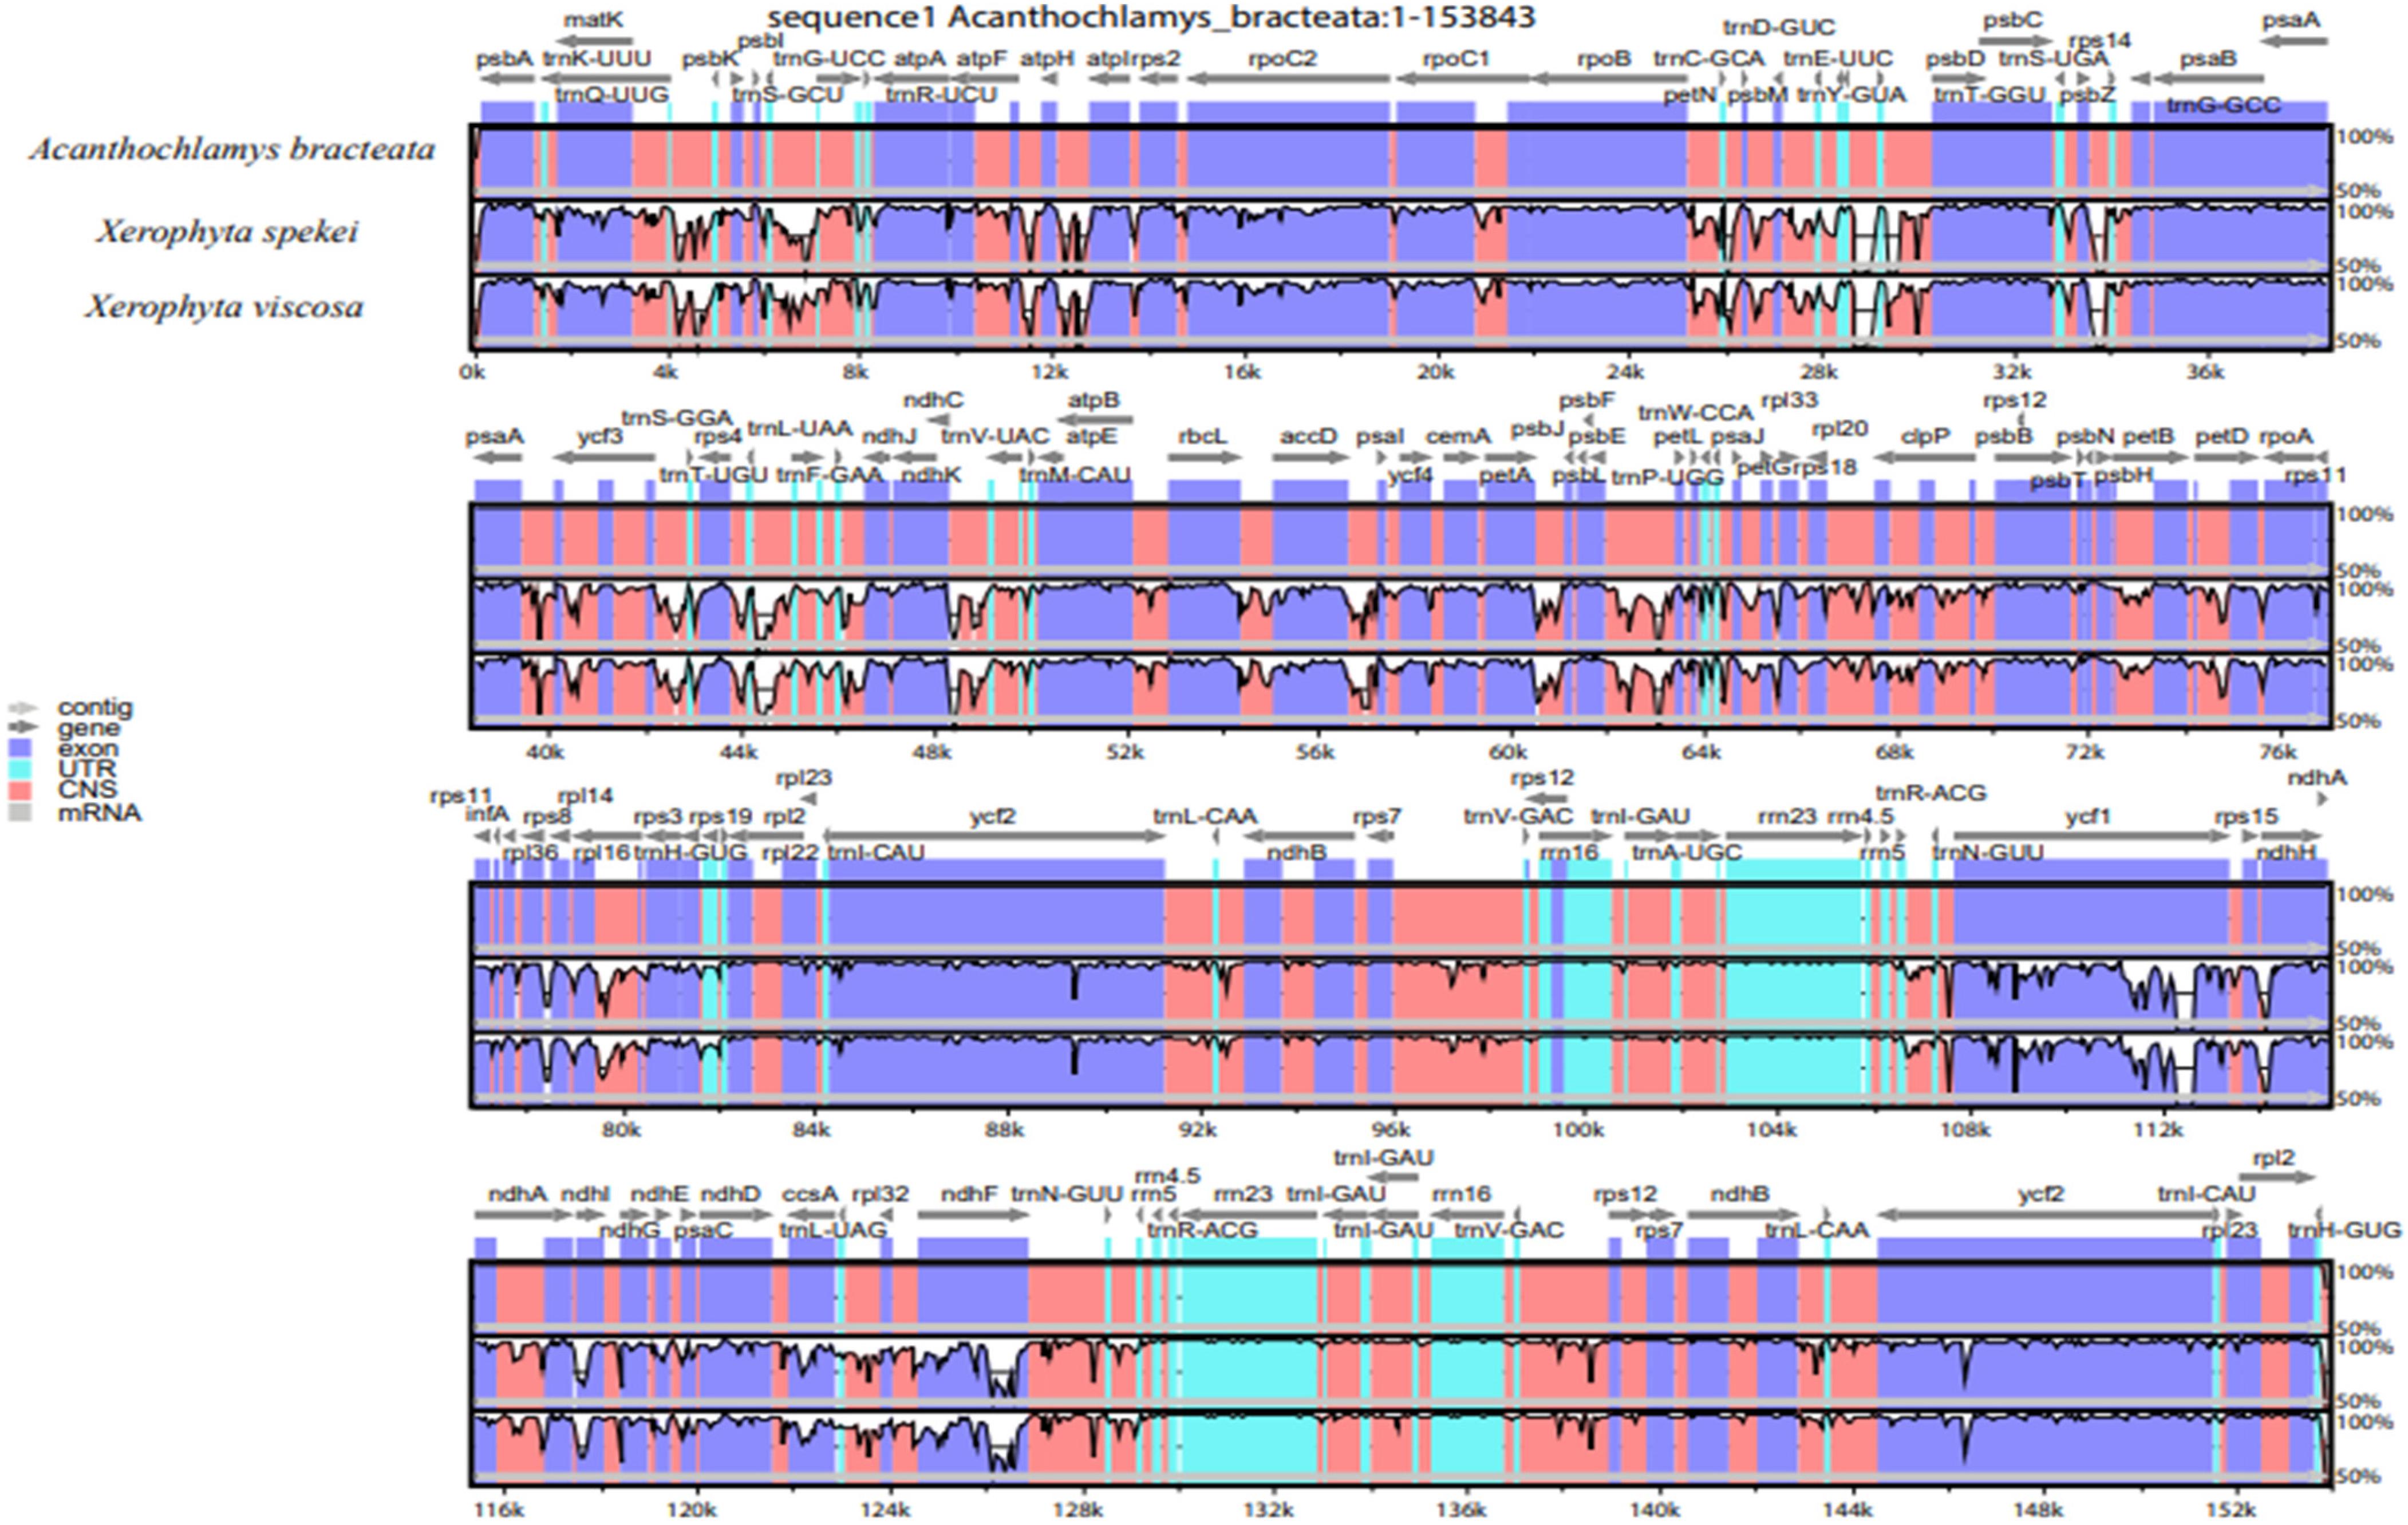
Figure 9. DNA sequence comparison of the three chloroplast genomes using mVISTA program. Above gray lines show the gene orientation and the position in the LSC, SSC, and IRs regions. The vertical scale indicates the percentage of identity of 70%.
Phylogenetic Analysis
Plastomes are important for explaining intra-and interspecific evolutionary histories with recent studies showing significant power in phylogenetic, evolution, and molecular systematic studies (Asaf et al., 2018). The cp genomes that have sufficient variable sites have shown to be useful in solving the phylogenetic relationships (Ma et al., 2014; Carbonell-Caballero et al., 2015). The phylogeny of the Velloziaceae was reconstructed using 59 shared protein-coding genes from the orders; Pandanales, Liliales and Dioscoreales, to evaluate the position of Acanthochlamys and the Xerophyta species. The three selected orders (Liliales, Pandanales, and Dioscoreales) were clustered into three different clades. In the reconstructed phylogeny (Figure 10), all the families for the order Pandanales were Cyclanthaceae, Pandanaceae, Stemonaceae, and Velloziaceae with exception of Triuridaceae which has lost most of its genes over time. The families in the Order Pandanales form a monophyletic group at this current taxon sampling analysis. Acanthochlamys bracteata was the early diverged in the family Velloziaceae based on this analysis because it was sister to the rest of the Velloziaceae species. Xerophyta spekei was sister to the clade that consisted of Xerophyta elegans and Xerophyta viscosa with a high support (100). Barbacenia involucrata L.B.Sm. was sister to the group [Vellozia sp. + Barbaceniopsis castillonii (Hauman) Ibisch] which was different to the previous analysis that used three genes (Soto Gomez et al., 2020). However, the tree topology of the Velloziaceae clade was similar to the same previous study that performed the analysis using a 12-gene mitochondrial data set. Pandanaceae and Cyclanthaceae clustered together and this clade was sister the clade formed by Velloziaceae and Stemonaceae. The phylogenetic relationship of the taxa in this study was consistent to the previous study that combined 18S rDNA (mitochondrial), Nuclear atpA, matR, and nad1b-c intron dataset (Mennes et al., 2013) and showed that Velloziaceae was sister to the other families in the order Pandanales, whereas, Stemonaceae was related to the clade (Pandanaceae + Cyclanthaceae; which are sisters). However, in our study we excluded family Triuridaceae from the analysis due to the huge number of genes lost from its cp genome. This phylogenetic tree topology therefore showed a close relationship between the taxa. Furthermore, the three species of Velloziaceae analyzed, A. bracteata and the two Xerophyta species (X. spekei, and X. viscosa) clustered together in the same clade, hence revealing a closer relationship of these species. This is similar to an early phylogenetic inference of the family Velloziaceae using the Chloroplast trnL-F sequence which supported a close relationship between Acanthochlamys and other Velloziaceae hence its inclusion into the family (Salatino et al., 2001). From this phylogenetic analysis, shared genes could be as well provide more reliable phylogenetic insights for species that have undergone genome-wide rearrangement and gene losses. The phylogenetic analyses done so far are largely increasing our understanding of the evolutionary relationship among species in Velloziaceae. Although our results clarified the phylogenetic relationships of the seven Velloziaceae together with species of Order Pandanales, more cp genome of the family and Order need to be sequenced and analyzed to completely understand the phylogeny. Low taxon sampling may produce inconsistencies in the topology of the tree (Leebens-Mack et al., 2005).
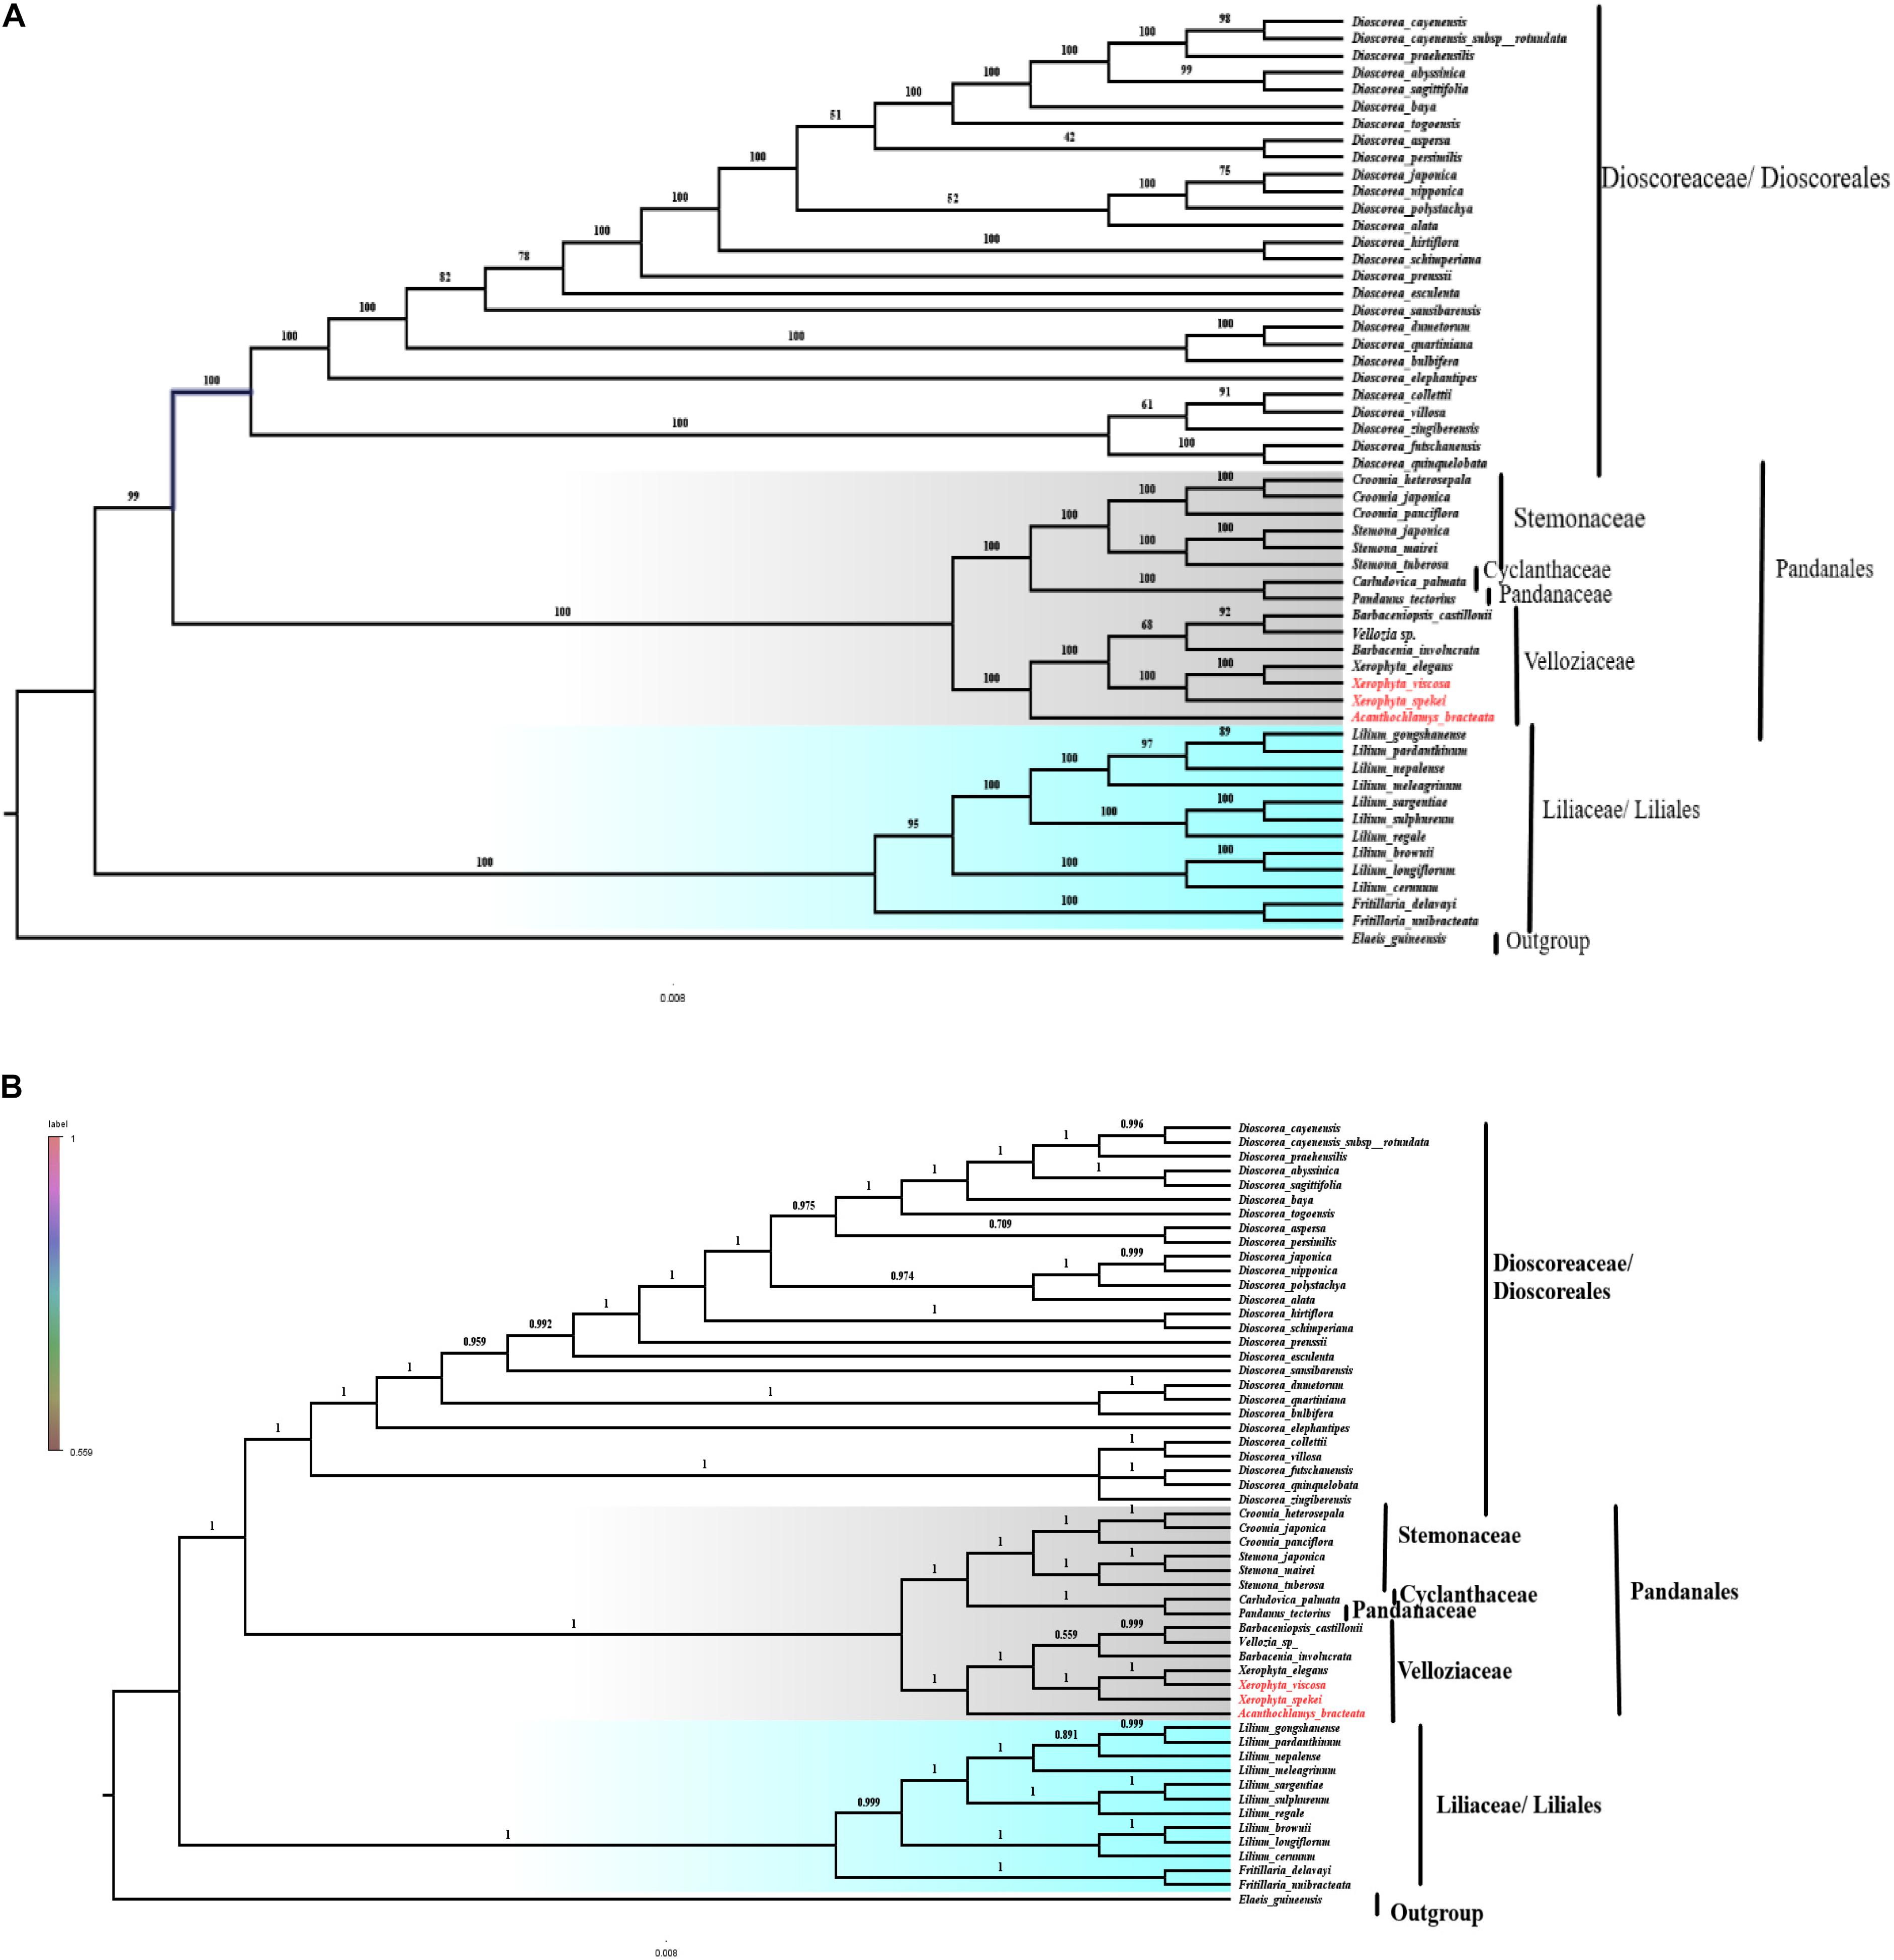
Figure 10. Phylogenetic relationship of the three species of Velloziaceae based on 59 single-copy genes shared by all cp genomes. (A) The Maximum likelihood (ML) tree with bootstrap value on the branches; (B) Bayesian inference (BI) tree with posterior probabilities values on the branches.
Morphological Comparison
Integrating morphology into phylogenetic analyses is important as it reveals suites of phenotypic novelties that characterize molecular classification hence assists systematists come up with species and clades (Lee and Palci, 2015). In this section we review the morphological importance as specifically used in the classification of A. bracteata P.C. Kao. Velloziaceae are xeromorphic and sometimes tree-like monocots with persistent leaf-sheath (Stevens, 2002). Despite the discordance in the treatment of the family Velloziaceae, morphological characters have always provided a foundation in the classification of the family. Velloziaceae are xerophytes adapted to inselbergs which generally favors their endemism (Behnke et al., 2013). The taxonomic history of Velloziaceae is linked mainly to its floral characters, stamen and stigma (Mello-Silva et al., 2011), however, this was misleading because of its variations among the taxa. The anatomical characters that were first used to classify A. bracteata were very unique among other monocotyledonous plants including the eustele in rhizome, protostele in root and leaf-stem compound structure in scape. Due to this unique structure in the vascular bundles, it was classified in a separate family Acanthochlamydaceae. However, basing on the morphological and molecular phylogenetic studies, even in this present study molecular analysis, shows a close relationship to the Velloziaceae. This in turn brought into lime-light the close relationship between the Handgun mountains and the African tropical regions, and its classification into family Velloziaceae. Acanthochlamys is clearly sister to but morphologically and anatomically different from the rest of the family, with exception of its sieve tube plastids which seem rather similar. The family Velloziaceae is supported currently by at least four-character states: Persistent leaves, presence of abscission zone, two phloem strands and violet tepals (Mello-Silva et al., 2011). In this section, the morphological characters summary among the African genera and the Asian genera are summarized in Table 4 above. Morphological summary of the three species of the family, despite their geographical occurrence differences, fit the classification into similar taxa.

Table 3. Group of genes encoded in the Acanthochlamys bracteata, Xerophyta spekei, and X. viscose.

Table 4. Comparison of morphological characters between Xerophyta and Acanthochlamys.
Conclusion
The complete chloroplast genome of the A. bracteata was reported and comparative and phylogenetic analyses with the two species from genus Xerophyta revealed similarities in their genomic structure and composition. Additionally, it provided valuable genetic information for further studies on the three species, A. bracteata, X. spekei, and X. viscosa, in terms of chloroplast sequence variations, assembly and evolution. Valuable genetic resources such as SSRs, large repeats and variable loci can be used as genetic markers important for barcoding. Additionally, to understand the sequence divergences in terms of phylogeny, the genetic markers can perhaps be used in the phylogenetic tree analysis upon further analyses. Furthermore, since these species are desiccation and drought tolerant, the genetic markers can be used in the agricultural sector with broad studies on the species compatibility in breeding research.
Genome Sequence Data
The complete chloroplast sequences Acanthochlamys bracteata and other species used in the study are available in GenBank, https://www.ncbi.nlm.nih.gov/(Supplementary Table 6).
Data Availability Statement
The datasets presented in this study can be found in online repositories. The names of the repository/repositories and accession number(s) can be found in the article/Supplementary Material.
Author Contributions
VW, XD, G-WH, Q-FW, and RG participated in design of the study can carried out the experiment. XD and G-WH collected the materials. VW, MO, EM, GO, MG, PK, and J-XY contributed in data analysis and draft manuscript writing. VW, XD, G-WH, MG, MO, and EM revised the draft manuscript. All the authors read and approved the final version of the manuscript.
Funding
This work was supported by grants from the International Partnership Program of Chinese Academy of Sciences (151853KYSB20190027), Sino-Africa Joint Research Center, CAS (SAJC202101), and The ANSO Scholarship for Young Talents, Ph.D. Fellowship Program University of Chinese Academy of Sciences, China.
Conflict of Interest
The authors declare that the research was conducted in the absence of any commercial or financial relationships that could be construed as a potential conflict of interest.
Acknowledgments
We sincerely thank Josephat Saina and John Mulinge for the help in some of the data analyses.
Supplementary Material
The Supplementary Material for this article can be found online at: https://www.frontiersin.org/articles/10.3389/fpls.2021.691833/full#supplementary-material
Footnotes
- ^ https://chlorobox.mpimp-golm.mpg.de/geseq.Html
- ^ http://pgrc.ipk-gatersleben.de/misa/misa.html
- ^ https://www.megasoftware.net
References
Alcantara, S., de Mello-Silva, R., Teodoro, G. S., Drequeceler, K., Ackerly, D. D., and Oliveira, R. S. (2015). Carbon assimilation and habitat segregation in resurrection plants: a comparison between desiccation- and non-desiccation-tolerant species of neotropical velloziaceae (Pandanales). Funct. Ecol. 29, 1499–1512. doi: 10.1111/1365-2435.12462
Alves, R. J. V., and Kolbek, J. (2010). Vegetation strategy of Vellozia crinita (Velloziaceae). Biologia 65, 254–264. doi: 10.2478/s11756-010-0005-y
Angiosperm Phylogeny Group. (2009). An update of the angiosperm phylogeny group classification for the orders and families of flowering plants: APG III. Botan. J. Linnean Soc. 161, 105–121. doi: 10.1111/j.1095-8339.2009.00996.x
Asaf, S., Khan, A., Khan, A. L., Al-Harrasi, A., and Al-Rawahi, A. (2019). Complete chloroplast genomes of Vachellia nilotica and Senegalia senegal: comparative genomics and phylogenomic placement in a new generic system. PLoS One 14:e0225469. doi: 10.1371/journal.pone.0225469
Asaf, S., Khan, A. L., Khan, A., Khan, A., Khan, G., Lee, I. J., et al. (2020). Expanded inverted repeat region with large scale inversion in the first complete plastid genome sequence of Plantago ovata. Sci. Rep. 10:3881. doi: 10.1038/s41598-020-60803-y
Asaf, S., Khan, A. L., Khan, M. A., Shahzad, R., Lubna, Kang, S. M., et al. (2018). Complete chloroplast genome sequence and comparative analysis of loblolly pine (Pinus taeda L.) with related species. PLoS One 13:e0192966. doi: 10.1371/journal.pone.0192966
Bao-Chun, G. (2017). Systematic study of acanthochlamydaceae—a new endemic family of China. Universal J. Agricultural Res. 5, 85–97. doi: 10.13189/ujar.2017.050202
Behnke, H. D., Hummel, E., Hillmer, S., Sauer-Gürth, H., Gonzalez, J., and Wink, M. (2013). A revision of African Velloziaceae based on leaf anatomy characters and rbcL nucleotide sequences. Botan. J. Linnean Soc. 172, 22–94. doi: 10.1111/boj.12018
Benson, G. (1999). Tandem repeats finder: a program to analyze DNA sequences. Nucleic Acids Res. 27, 573–580. doi: 10.1093/nar/27.2.573
Carbonell-Caballero, J., Alonso, R., Ibañez, V., Terol, J., Talon, M., and Dopazo, J. (2015). A phylogenetic analysis of 34 chloroplast genomes elucidates the relationships between wild and domestic species within the genus Citrus. Mol. Biol. Evol. 32, 2015–2035. doi: 10.1093/molbev/msv082
Chase, M. W., Christenhusz, M. J. M., Fay, M. F., Byng, J. W., Judd, W. S., Soltis, D. E., et al. (2016). An update of the angiosperm phylogeny group classification for the orders and families of flowering plants: APG IV. Botan. J. Linnean Soc. 181, 1–20. doi: 10.1111/boj.12385
Chase, M. W., and Hills, H. H. (1991). Silica gel: an ideal material for field preservation of leaf samples for DNA studies. Taxon 40, 215–220. doi: 10.2307/1222975
Chen, Z., Feng, K., Grover, C. E., Li, P., Liu, F., Wang, Y., et al. (2016). Chloroplast DNA structural variation, phylogeny, and age of divergence among diploid cotton species. PLoS One 11:e0157183. doi: 10.1371/journal.pone.0157183
Chen, Z. X., Yao, X. Y., and Wang, Q. Z. (2019). The complete chloroplast genome of Sanicula chinensis. Mitochondrial DNA Part B 4, 734–735. doi: 10.1080/23802359.2018.1564386
Dai, A. (2011). Drought under global warming: a review. wiley interdisciplinary reviews. Climate Change 2, 45–65. doi: 10.1002/wcc.81
Daniell, H., Lin, C. S., Yu, M., and Chang, W. J. (2016). Chloroplast genomes: diversity, evolution, and applications in genetic engineering. Genome Biol. 17, 1–29. doi: 10.1186/s13059-016-1004-2
De Las Rivas, J., Lozano, J. J., and Ortiz, A. R. (2002). Comparative analysis of chloroplast genomes: functional annotation, genome-based phylogeny, and deduced evolutionary patterns. Genome Res. 12, 567–583. doi: 10.1101/gr.209402.chloroplasts
Deeba, F., and Pandey, V. (2017). Adaptive Mechanisms of Desiccation Tolerance in Resurrection Plants. In Plant Adaptation Strategies in Changing Environment. (Singapore: Springer), 29–75. doi: 10.1007/978-981-10-6744-0_2
Deguilloux, M. F., Pemonge, M. H., and Petit, R. J. (2004). Use of chloroplast microsatellites to differentiate oak populations. Annals Forest Sci. 61, 825–830. doi: 10.1051/forest:2004078
Doyle, J. (1991). “DNA protocols for plants,” in Molecular Techniques in Taxonomy, (Berlin: Springer), 283–293. doi: 10.1007/978-3-642-83962-7_18
Farrant, J. M., Cooper, K., Hilgart, A., Abdalla, K. O., Bentley, J., Thomson, J. A., et al. (2015). A molecular physiological review of vegetative desiccation tolerance in the resurrection plant Xerophyta viscosa (Baker). Planta 242, 407–426. doi: 10.1007/s00425-015-2320-6
Frazer, K. A., Pachter, L., Poliakov, A., Rubin, E. M., and Dubchak, I. (2004). VISTA: computational tools for comparative genomics. Nucleic Acids Res. 32(Suppl. 2), W273–W279. doi: 10.1093/nar/gkh458
Gandhi, S. G., Awasthi, P., and Bedi, Y. S. (2010). Analysis of SSR dynamics in chloroplast genomes of Brassicaceae family. Bioinformation 5:16. doi: 10.6026/97320630005016
Gao, F., Chen, C., Arab, D. A., Du, Z., He, Y., and Ho, S. Y. W. (2019). EasyCodeML: a visual tool for analysis of selection using CodeML. Ecol. Evol. 9, 3891–3898. doi: 10.1002/ece3.5015
Gao, L. Z., Liu, Y. L., Zhang, D., Li, W., Gao, J., Liu, Y., et al. (2019). Evolution of Oryza chloroplast genomes promoted adaptation to diverse ecological habitats. Commun. Biol. 2, 1–13. doi: 10.1038/s42003-019-0531-2
Gao, X., Zhang, X., Meng, H., Li, J., Zhang, D., and Liu, C. (2018). Comparative chloroplast genomes of paris sect. marmorata: insights into repeat regions and evolutionary implications. BMC Genomics 19, 133–144. doi: 10.1186/s12864-018-5281-x
Gardens, K. R. B. (2016). World Checklist of Selected Plant Families. Available online at: http://apps.kew.org/wcsp/prepareChecklist.do.
Greiner, S., Lehwark, P., and Bock, R. (2019). OrganellarGenomeDRAW (OGDRAW) version 1.3.1: expanded toolkit for the graphical visualization of organellar genomes. Nucleic Acids Res. 47, W59–W64. doi: 10.1093/nar/gkz238
Gu, C., Ma, L., Wu, Z., Chen, K., and Wang, Y. (2019). Comparative analyses of chloroplast genomes from 22 Lythraceae species: inferences for phylogenetic relationships and genome evolution within Myrtales. BMC Plant Biol. 19:281. doi: 10.1186/s12870-019-1870-3
Ibisch, P. L., Nowicki, C., Vásquez, R., and Koch, K. (2001). Taxonomy and biology of andean velloziaceae: Vellozia andina sp. nov. and Notes on Barbaceniopsis (including Barbaceniopsis castillonii comb. nov.). Systematic Botany 26, 5–16. doi: 10.1043/0363-6445-26.1.5
Jin, D. M., Wicke, S., Gan, L., Yang, J. B., Jin, J. J., and Yi, T. S. (2020a). The loss of the inverted repeat in the putranjivoid clade of Malpighiales. Front. Plant Sci. 11:942. doi: 10.3389/fpls.2020.00942
Jin, J. J., Yu, W. B., Yang, J. B., Song, Y., Depamphilis, C. W., Yi, T. S., et al. (2020b). GetOrganelle: a fast and versatile toolkit for accurate de novo assembly of organelle genomes. Genome Biol. 21, 1–31.
Kalyaanamoorthy, S., Minh, B. Q., Wong, T. K. F., Von Haeseler, A., and Jermiin, L. S. (2017). ModelFinder: fast model selection for accurate phylogenetic estimates. Nat. Methods 14, 587–589. doi: 10.1038/nmeth.4285
Khan, A., Asaf, S., Khan, A. L., Al-harrasi, A., Al-sudairy, O., Abdulkareem, N. M., et al. (2019). First complete chloroplast genomics and comparative phylogenetic analysis of Commiphora gileadensis and C. foliacea: Myrrh producing trees. PLoS One 14:e0208511. doi: 10.1371/journal.pone.0208511
Khayi, S., Gaboun, F., Pirro, S., Tatusova, T., El Mousadik, A., Ghazal, H., et al. (2020). Complete chloroplast genome of Argania spinosa: structural organization and phylogenetic relationships in Sapotaceae. Plants 9:1354. doi: 10.3390/plants9101354
Konhar, R., Debnath, M., Vishwakarma, S., Bhattacharjee, A., et al. (2019). The complete chloroplast genome of Dendrobium nobile, an endangered medicinal orchid from north-east India and its comparison with related chloroplast genomes of Dendrobium species. PeerJ 7:e7756. doi: 10.7717/peerj.7756
Kumar, S., Stecher, G., Li, M., Knyaz, C., and Tamura, K. (2018). MEGA X: molecular evolutionary genetics analysis across computing platforms. Mol. Biol. Evol. 35, 1547–1549. doi: 10.1093/molbev/msy096
Kumar, S., Stecher, G., and Tamura, K. (2016). MEGA7: molecular evolutionary genetics analysis version 7.0 for bigger datasets. Mol. Biol. Evol. 33, 1870–1874. doi: 10.1093/molbev/msw054
Kurtz, S., Choudhuri, J. V., Ohlebusch, E., Schleiermacher, C., Stoye, J., and Giegerich, R. (2001). REPuter: the manifold applications of repeat analysis on a genomic scale. Nucleic Acids Res. 29, 4633–4642. doi: 10.1093/nar/29.22.4633
Lee, J., Kang, Y., Shin, S. C., Park, H., and Lee, H. (2014). Combined analysis of the chloroplast genome and transcriptome of the Antarctic vascular plant Deschampsia placeantarctica Desv. PLoS One 9:e92501. doi: 10.1371/journal.pone.0092501
Lee, M. S. Y., and Palci, A. (2015). Morphological phylogenetics in the genomic age. Curr. Biol. 25, R922–R929. doi: 10.1016/j.cub.2015.07.009
Leebens-Mack, J., Raubeson, L. A., Cui, L., Kuehl, J. V., Fourcade, M. H., Chumley, T. W., et al. (2005). Identifying the basal angiosperm node in chloroplast genome phylogenies: sampling one’s way out of the Felsenstein zone. Mol. Biol. Evol. 22, 1948–1963. doi: 10.1093/molbev/msi191
Li, B., Lin, F., Huang, P., Guo, W., and Zheng, Y. (2017). Complete chloroplast genome sequence of Decaisnea insignis: genome organization, genomic resources and comparative analysis. Sci. Rep. 7:10073. doi: 10.1038/s41598-017-10409-8
Li, W., Zhang, C., Guo, X., Liu, Q., and Wang, K. (2019). Complete chloroplast genome of Camellia japonica genome structures, comparative and phylogenetic analysis. PLoS One 14:e0216645. doi: 10.1371/journal.pone.0216645
Li, X., Li, Y., Zang, M., and Fang, Y. (2018). Complete chloroplast genome sequence and phylogenetic analysis of Quercus acutissima. Int. J. Mol. Sci. 19:2443. doi: 10.3390/ijms19082443
Li, X., Yang, Y., Henry, R. J., Rossetto, M., Wang, Y., and Chen, S. (2015). Plant DNA barcoding: from gene to genome. Biol. Rev. Camb. Philos. Soc. 90, 157–166. doi: 10.1111/brv.12104
Liu, E., Yang, C., Liu, J., Jin, S., Harijati, N., Hu, Z., et al. (2019). Comparative analysis of complete chloroplast genome sequences of four major Amorphophallus species. Sci. Rep. 9:809. doi: 10.1038/s41598-018-37456-z
Liu, J., Qi, Z. C., Zhao, Y. P., Fu, C. X., and Jenny Xiang, Q. Y. (2012). Complete cpDNA genome sequence of Smilax china and phylogenetic placement of Liliales - Influences of gene partitions and taxon sampling. Mol. Phylogenet. Evol. 64, 545–562. doi: 10.1016/j.ympev.2012.05.010
Liu, L., Wang, Y., He, P., Li, P., Lee, J., Soltis, D. E., et al. (2018). Chloroplast genome analyses and genomic resource development for epilithic sister genera Oresitrophe and Mukdenia (Saxifragaceae), using genome skimming data. BMC Genomics 19:235. doi: 10.1186/s12864-018-4633-x
Lyu, X., and Liu, Y. (2020). Nonoptimal codon usage is critical for protein structure and function of the master general amino acid control regulator CPC-1. Mbio 11. doi: 10.1128/mBio.02605-20
Ma, P. F., Zhang, Y. X., Zeng, C. X., Guo, Z. H., and Li, D. Z. (2014). Chloroplast phylogenomic analyses resolve deep-level relationships of an intractable bamboo tribe Arundinarieae (Poaceae). Systematic Biol. 63, 933–950. doi: 10.1093/sysbio/syu054
Mello-Silva, R., Santos, D. Y. A. C., Salatino, M. L. F., Motta, L. B., Cattai, M. B., Sasaki, D., et al. (2011). Five vicarious genera from gondwana: the Velloziaceae as shown by molecules and morphology. Ann. Bot. 108, 87–102. doi: 10.1093/aob/mcr107
Mennes, C. B., Smets, E. F., Moses, S. N., and Merckx, V. S. (2013). New insights in the long-debated evolutionary history of Triuridaceae (Pandanales). Mol. Phylogenet. Evol. 69, 994–1004. doi: 10.1016/j.ympev.2013.05.031
Mo, Z., Lou, W., Chen, Y., Jia, X., Zhai, M., Guo, Z., et al. (2020). The chloroplast genome of Carya illinoinensis: genome structure, adaptive evolution, and phylogenetic analysis. Forests 11:207. doi: 10.3390/f11020207
Moon, B. C. (2018). The complete chloroplast genomes of six Ipomoea species and indel marker development for the discrimination of authentic Pharbitidis Semen (Seeds of I. nil or I. purpurea). Front. Plant Sci. 9:965. doi: 10.3389/fpls.2018.00965
Munyao, J. N., Dong, X., Yang, J. X., Mbandi, E. M., Wanga, V. O., Oulo, M. A., et al. (2020). Complete chloroplast genomes of Chlorophytum comosum and Chlorophytum gallabatense: genome structures, comparative and phylogenetic analysis. Plants 9:296. doi: 10.3390/plants9030296
Oulo, M. A., Yang, J. X., Dong, X., Wanga, V. O., Mkala, E. M., Munyao, J. N., et al. (2020). Complete chloroplast genome of Rhipsalis baccifera, the only cactus with natural distribution in the old world: genome rearrangement, intron gain and loss, and implications for phylogenetic studies. Plants 9:979. doi: 10.3390/plants9080979
Palmer, J. D. (1987). Chloroplast DNA evolution and biosystematic uses of chloroplast DNA variation. Am. Nat. 130, S6–S29. doi: 10.1086/284689
Piya, S., Nepal, M. P., Butler, J. L., Larson, G. E., and Neupane, A. (2014). Genetic diversity and population structure of sickleweed (Falcaria vulgaris; Apiaceae) in the upper Midwest USA. Biol. Invasions 16, 2115–2125. doi: 10.1007/s10530-014-0651-z
Porembski, S., and Barthlott, W. (2000). Granitic and gneissic outcrops (inselbergs) as centers of diversity for desiccation-tolerant vascular plants. Plant Ecol. 151, 19–28. doi: 10.1023/A:1026565817218
Qu, X. J., Moore, M. J., Li, D. Z., and Yi, T. S. (2019). PGA: a software package for rapid, accurate, and flexible batch annotation of plastomes. Plant Methods 15, 1–12. doi: 10.1186/s13007-019-0435-7
Rajendrakumar, P., Biswal, A. K., Balachandran, S. M., Srinivasarao, K., and Sundaram, R. M. (2007). Simple sequence repeats in organellar genomes of rice: frequency and distribution in genic and intergenic regions. Bioinformatics 23, 1–4. doi: 10.1093/bioinformatics/btl547
Redwan, R. M., Saidin, A., and Kumar, S. V. (2015). Complete chloroplast genome sequence of MD-2 pineapple and its comparative analysis among nine other plants from the subclass commelinidae. BMC Plant Biol. 15:1–20. doi: 10.1186/s12870-015-0587-1
Rono, P. C., Dong, X., Yang, J. X., Mutie, F. M., Oulo, M. A., Malombe, I., et al. (2020). Initial complete chloroplast genomes of Alchemilla (Rosaceae): comparative analysis and phylogenetic relationships. Front. Genetics 11:560368. doi: 10.3389/fgene.2020.560368
Rousseau-Gueutin, M., Bellot, S., Martin, G. E., Boutte, J., Chelaifa, H., Lima, O., et al. (2015). The chloroplast genome of the hexaploid Spartina maritima (Poaceae, Chloridoideae): comparative analyses and molecular dating. Mol. Phylogenet. Evol. 93, 5–16. doi: 10.1016/j.ympev.2015.06.013
Rozas, J., Ferrer-Mata, A., Sanchez-DelBarrio, J. C., Guirao-Rico, S., Librado, P., Ramos-Onsins, S. E., et al. (2017). DnaSP 6: DNA sequence polymorphism analysis of large data sets. Mol. Biol. Evol. 34, 3299–3302. doi: 10.1093/molbev/msx248
Sabater, B. (2018). Evolution and function of the chloroplast. current investigations and perspectives. Int. J. Mol. Sci. 19:3095. doi: 10.3390/ijms19103095
Salatino, A., Salatino, M. L. F., De Mello-Silva, R., van Sluys, M. A., Giannasi, D. E., and Price, R. A. (2001). Phylogenetic inference in Velloziaceae using chloroplast trnL-F sequences. Systematic Botany 26, 92–103. doi: 10.1043/0363-6445-26.1.92
Sale, M. M., Pott, B. M., Wesfi, A. K., and Reid, J. B. (1993). Relationships within Eucalyptus using chloroplast DNA. Australian Systematic Botany 6, 127–138. doi: 10.1071/SB9930127
Shukla, N., Kuntal, H., Shanker, A., and Sharma, S. N. (2018). Mining and analysis of simple sequence repeats in the chloroplast genomes of genus Vigna. Biotechnol. Res. Innovat. 2, 9–18. doi: 10.1016/j.biori.2018.08.001
Soto Gomez, M., Lin, Q., da Silva, Leal, E., Gallaher, T. J., Scherberich, D., et al. (2020). A bi-organellar phylogenomic study of Pandanales: inference of higher-order relationships and unusual rate-variation patterns. Cladistics 36, 481–504. doi: 10.1111/cla.12417
Stevens, P. F. (2002). Money, morphology and molecules. some comments on wortley, Bennett and Scotland (2002), Taxonomy and phylogeny reconstruction: two distinct research agendas in systematics.(see p. 335 of this issue). Edinburgh J. Botany 59:451. doi: 10.1017/s0960428602000288
Talat, F., and Wang, K. (2015). Comparative bioinformatics analysis of the chloroplast genomes of a wild diploid Gossypium and two cultivated allotetraploid species. Iranian J. Biotechnol. 13:47. doi: 10.15171/ijb.1231
Thiel, T., Michalek, W., Varshney, R. K., and Graner, A. (2003). Exploiting EST databases for the development and characterization of gene-derived SSR-markers in barley (Hordeum vulgare L.). Theoret. Appl. Genet. 106, 411–422. doi: 10.1007/s00122-002-1031-0
Tillich, M., Lehwark, P., Pellizzer, T., Ulbricht-Jones, E. S., Fischer, A., Bock, R., et al. (2017). GeSeq - versatile and accurate annotation of organelle genomes. Nucleic Acids Res. 45, W6–W11. doi: 10.1093/nar/gkx391
Tuba, Z., Lichtenthaler, H. K., Csintalan, Z., Nagy, Z., and Szente, K. (1996). Loss of chlorophylls, cessation of photosynthetic CO2 assimilation and respiration in the poikilochlorophyllous plant Xerophyta scabrida during desiccation. Physiol. Plant. 96, 383–388. doi: 10.1111/j.1399-3054.1996.tb00448.x
Vendramin, G. G., Degen, B., Petit, R. J., Anzidei, M., Madaghiele, A., and Ziegenhagen, B. (1999). High level of variation at Abies alba chloroplast microsatellite loci in Europe. Mol. Ecol. 8, 1117–1126. doi: 10.1046/j.1365-294X.1999.00666.x
Wang, D., Zhang, Y., Zhang, Z., Zhu, J., and Yu, J. (2010). KaKs_Calculator 2.0: a toolkit incorporating gamma-series methods and sliding window strategies. Genom. Proteom. Bioinform. 8, 77–80. doi: 10.1016/S1672-0229(10)60008-3
Wang, W., Yu, H., Wang, J., Lei, W., Gao, J., Qiu, X., et al. (2017). The complete chloroplast genome sequences of the medicinal plant Forsythia suspensa (Oleaceae). Int. J. Mol. Sci. 18:2288. doi: 10.3390/ijms18112288
Wang, X., Zhou, T., Bai, G., and Zhao, Y. (2018). Complete chloroplast genome sequence of Fagopyrum dibotrys: genome features, comparative analysis and phylogenetic relationships. Sci. Rep. 8:12379. doi: 10.1038/s41598-018-30398-6
Wanga, V. O., Dong, X., Oulo, M. A., Ndunge, J., Mkala, E. M., Kirika, P., et al. (2020). The complete chloroplast genome sequence of Xerophyta spekei (Velloziaceae). Mitochondrial DNA Part B 5, 100–101. doi: 10.1080/23802359.2019.1698365
Xie, D. F., Yu, Y., Deng, Y. Q., Li, J., Liu, H. Y., Zhou, S. D., et al. (2018). Comparative analysis of the chloroplast genomes of the chinese endemic genus Urophysa and their contribution to chloroplast phylogeny and adaptive evolution. Int. J. Mol. Sci. 19:1847. doi: 10.3390/ijms19071847
Xu, C., Cai, X., Chen, Q., Zhou, H., Cai, Y., and Ben, A. (2011). Factors affecting synonymous codon usage bias in chloroplast genome of Oncidium gower Ramsey. Evol. Bioinform. 7, 271–278. doi: 10.4137/EBO.S8092
Xu, J. H., Liu, Q., Hu, W., Wang, T., Xue, Q., and Messing, J. (2015). Dynamics of chloroplast genomes in green plants. Genomics 106, 221–231. doi: 10.1016/j.ygeno.2015.07.004
Xu, X., and Wang, D. (2021). Comparative chloroplast genomics of Corydalis species (Papaveraceae): evolutionary perspectives on their unusual large scale rearrangements. Front. Plant Sci. 11:600354. doi: 10.3389/fpls.2020.600354
Yang, Z. (2007). PAML 4: phylogenetic analysis by maximum likelihood. Mol. Biol. Evol. 24, 1586–1591. doi: 10.1093/molbev/msm088
Zhang, D., Gao, F., Li, W. X., Jakovlić, I., Zou, H., Zhang, J., et al. (2018). PhyloSuite: an integrated and scalable desktop platform for streamlined molecular sequence data management and evolutionary phylogenetics studies. bioRxiv [preprint] doi: 10.1101/489088
Zhang, Z., Chen, Y., Jiang, X., Zhu, P., Li, L., Zeng, Y., et al. (2019). The complete chloroplast genome of Aesculus chinensis. Mitochondrial DNA Part B 4, 1955–1956. doi: 10.1080/23802359.2019.1617056
Zhang, Z., Li, J., Zhao, X. Q., Wang, J., Wong, G. K. S., and Yu, J. (2006). KaKs_calculator: calculating ka and ks through model selection and model averaging. Genom. Proteom. Bioinform. 4, 259–263. doi: 10.1016/S1672-0229(07)60007-2
Zhao, Y., Yin, J., Guo, H., Zhang, Y., Xiao, W., Sun, C., et al. (2015). The complete chloroplast genome provides insight into the evolution and polymorphism of Panax ginseng. Front. Plant Sci. 5:696. doi: 10.3389/fpls.2014.00696
Zhou, T., Chen, C., Wei, Y., Chang, Y., Bai, G., Li, Z., et al. (2016). Comparative transcriptome and chloroplast genome analyses of two related Dipteronia species. Front. Plant Sci. 7:1512. doi: 10.3389/fpls.2016.01512
Keywords: Acanthochlamys bracteata, Xerophyta, chloroplast genome, comparative genomics, repeat analysis, SSRs, phylogeny
Citation: Wanga VO, Dong X, Oulo MA, Mkala EM, Yang J-X, Onjalalaina GE, Gichua MK, Kirika PM, Gituru RW, Hu G-W and Wang Q-F (2021) Complete Chloroplast Genomes of Acanthochlamys bracteata (China) and Xerophyta (Africa) (Velloziaceae): Comparative Genomics and Phylogenomic Placement. Front. Plant Sci. 12:691833. doi: 10.3389/fpls.2021.691833
Received: 07 April 2021; Accepted: 19 May 2021;
Published: 14 June 2021.
Edited by:
Yuannian Jiao, Institute of Botany, Chinese Academy of Sciences, ChinaReviewed by:
Russell L. Barrett, Royal Botanic Gardens and Domain Trust, AustraliaGang Yao, South China Agricultural University, China
Copyright © 2021 Wanga, Dong, Oulo, Mkala, Yang, Onjalalaina, Gichua, Kirika, Gituru, Hu and Wang. This is an open-access article distributed under the terms of the Creative Commons Attribution License (CC BY). The use, distribution or reproduction in other forums is permitted, provided the original author(s) and the copyright owner(s) are credited and that the original publication in this journal is cited, in accordance with accepted academic practice. No use, distribution or reproduction is permitted which does not comply with these terms.
*Correspondence: Guang-Wan Hu, guangwanhu@wbgcas.cn
†These authors have contributed equally to this work