Article

Comparative Analysis of the Complete Mitochondrial Genomes of Apium graveolens and Apium leptophyllum Provide Insights into Evolution and Phylogeny Relationships

1
College of Horticulture, Sichuan Agricultural University, Chengdu 611130, China
2
Institute of Horticulture, Guizhou Academy of Agricultural Sciences, Guiyang 550006, China
3
College of Horticulture, Nanjing Agricultural University, Nanjing 611130, China
*
Authors to whom correspondence should be addressed.
These authors contributed equally to this work.
Int. J. Mol. Sci. 2023, 24(19), 14615; https://doi.org/10.3390/ijms241914615
Submission received: 9 August 2023 / Revised: 14 September 2023 / Accepted: 25 September 2023 / Published: 27 September 2023

Abstract

:
The genus Apium, belonging to the family Apiaceae, comprises roughly 20 species. Only two species, Apium graveolens and Apium leptophyllum, are available in China and are both rich in nutrients and have favorable medicinal properties. However, the lack of genomic data has severely constrained the study of genetics and evolution in Apium plants. In this study, Illumina NovaSeq 6000 and Nanopore sequencing platforms were employed to identify the mitochondrial genomes of A. graveolens and A. leptophyllum. The complete lengths of the mitochondrial genomes of A. graveolens and A. leptophyllum were 263,017 bp and 260,164 bp, respectively, and contained 39 and 36 protein-coding genes, five and six rRNA genes, and 19 and 20 tRNA genes. Consistent with most angiosperms, both A. graveolens and A. leptophyllum showed a preference for codons encoding leucine (Leu). In the mitochondrial genome of A. graveolens, 335 SSRs were detected, which is higher than the 196 SSRs found in the mitochondrial genome of A. leptophyllum. Studies have shown that the most common RNA editing type is C-to-U, but, in our study, both A. graveolens and A. leptophyllum exhibited the U-C editing type. Furthermore, the transfer of the mitochondrial genomes of A. graveolens and A. leptophyllum into the chloroplast genomes revealed homologous sequences, accounting for 8.14% and 4.89% of the mitochondrial genome, respectively. Lastly, in comparing the mitochondrial genomes of 29 species, it was found that A. graveolens, A. leptophyllum, and Daucus carota form a sister group with a support rate of 100%. Overall, this investigation furnishes extensive insights into the mitochondrial genomes of A. graveolens and A. leptophyllum, thereby enhancing comprehension of the traits and evolutionary patterns within the Apium genus. Additionally, it offers supplementary data for evolutionary and comparative genomic analyses of other species within the Apiaceae family.

1. Introduction

According to previous studies, plant organelle genomes originated from ancient endosymbiotic bacteria approximately one billion years ago and play a decisive role in various essential life processes such as photosynthesis, cellular respiration, and ATP synthesis [1,2]. Mitochondria, as key organelles for energy metabolism in eukaryotic cells, play an instrumental role in development, reproduction, and various biochemical processes [3]. In addition to synthesizing adenosine triphosphate (ATP) to provide cellular energy [4], they also participate in cell differentiation, signal transduction, and apoptosis [5]. The mitochondrial genome (also known as the mitogenome) has significant gene coding capacity [6]. Unlike the nuclear genome, mitochondria are variable-sized double-stranded DNA molecules, and each cell may contain more than 1000 mitochondrial genomes, known as heteroplasmy [7]. The advent of high-throughput sequencing technologies has greatly facilitated the exploration of animal and plant mitochondrial genomes, revealing the diversity in genome organization, structure, and gene content [8]. Moreover, the high conservation of mitochondrial genomes makes them powerful markers for genetic and phylogenetic research applications [9]. The size of mitochondrial genomes considerably varies among different classes of plants and even among species within the same family [10]. For example, the mitochondrial DNA size of Citrullus lanatus is 379 kb [11], while Cucumis melo has a mitochondrial genome size of 2740 kb [12]. Recent research has found that plant mitochondrial genomes generally exist in circular, linear, or branched forms, and some exhibit multi-branch structures such as the Picea sitchens [13]. These structural variations reflect differences in the amount of repetitive DNA, leading to genome recombination and structural dynamics. Notably, their sizes range from 222 kb in Brassica napus to 11.3 Mb in Silene conica [14]. The Siberian larch (Larix sibirica Ledeb.) mitochondrial genome is currently known to be the largest mitogenome in plants, estimated to have a total size of 11.7 Mb [15].
Plant mitochondrial genomes possess many unique features, with complex and dynamic structures [16]. They contain abundant repetitive sequences, which can lead to rapid genome rearrangements [17]. The utility of mitochondrial genome sequences as genetic markers has been extensively documented, with several mitochondrial genes such as atp1, cob, and cox1/2/3 being widely utilized for resolving phylogenetic relationships between lineages and conducting biodiversity analyses [18,19]. Assembling and annotating the mitochondrial genome of the medicinal plant Bupleurum chinense revealed that mitochondrial genes are conserved during evolution, providing a foundation for understanding the genetic variation, phylogenetics, and breeding of B. chinense [20]. Varré et al. reported that the variation among potato varieties was zero based on the analyses of the potato mitochondrial whole-genome sequence, multi-chromosomal configuration, and transcriptome, while a comparative analysis with other Solanaceae species aided in studying the evolutionary history of its mitochondrial genome [21]. Therefore, investigating mitochondrial genomes has considerable implications for understanding mitochondrial function, and the regulation of cellular metabolism. Moreover, it offers crucial points of reference and theoretical underpinnings for the investigation of species evolution and genetic diversity.
The genus Apium, belonging to the family Apiaceae, consists of annual or perennial herbaceous plants distributed in temperate regions [22]. In China, there are only two celery varieties, namely Apium graveolens L. and Apium leptophyllum (Pers.) F. Muell. The former is one of the most important vegetables in the Apiaceae family and is extensively cultivated worldwide [23]. Apart from being rich in vitamins, phenolic compounds, apigenin, and other nutrients, celery extracts also have medicinal value, such as antibacterial, anti-inflammatory, glucose-lowering, and lipid-lowering properties [24]. Similarly, the latter exerts antibacterial activity against pathogens and fungal strains in its volatile oil, and also exhibits a satisfactory free radical scavenging activity against DPPH(2,2-Diphenyl-1-picrylhydrazyl) [25]. Both of these plants possess desirable medicinal functions and have certain similarities in terms of plant morphology. However, the lack of genetic information and studies on the systematic evolution of the Apium genus has hindered the development and utilization of this genus.
Therefore, in this study, the mitochondrial genomes of A. graveolens and A. leptophyllum were sequenced and assembled. The genome repeats, RNA editing sites, and gene transfer events in the mitochondrial genomes of these two celery species were analyzed and compared with mitochondrial sequences of other Apiaceae plants. Our study provides comprehensive information on the mitochondrial genomes of A. graveolens and A. leptophyllum, allowing for a better understanding of the characteristics and evolution of the Apium genus. Additionally, our research provides additional information for the evolution and comparative genomics studies of other species in the Apiaceae family.

2. Results

2.1. Analysis of Mitochondrial Genome Assembly and Annotation Results
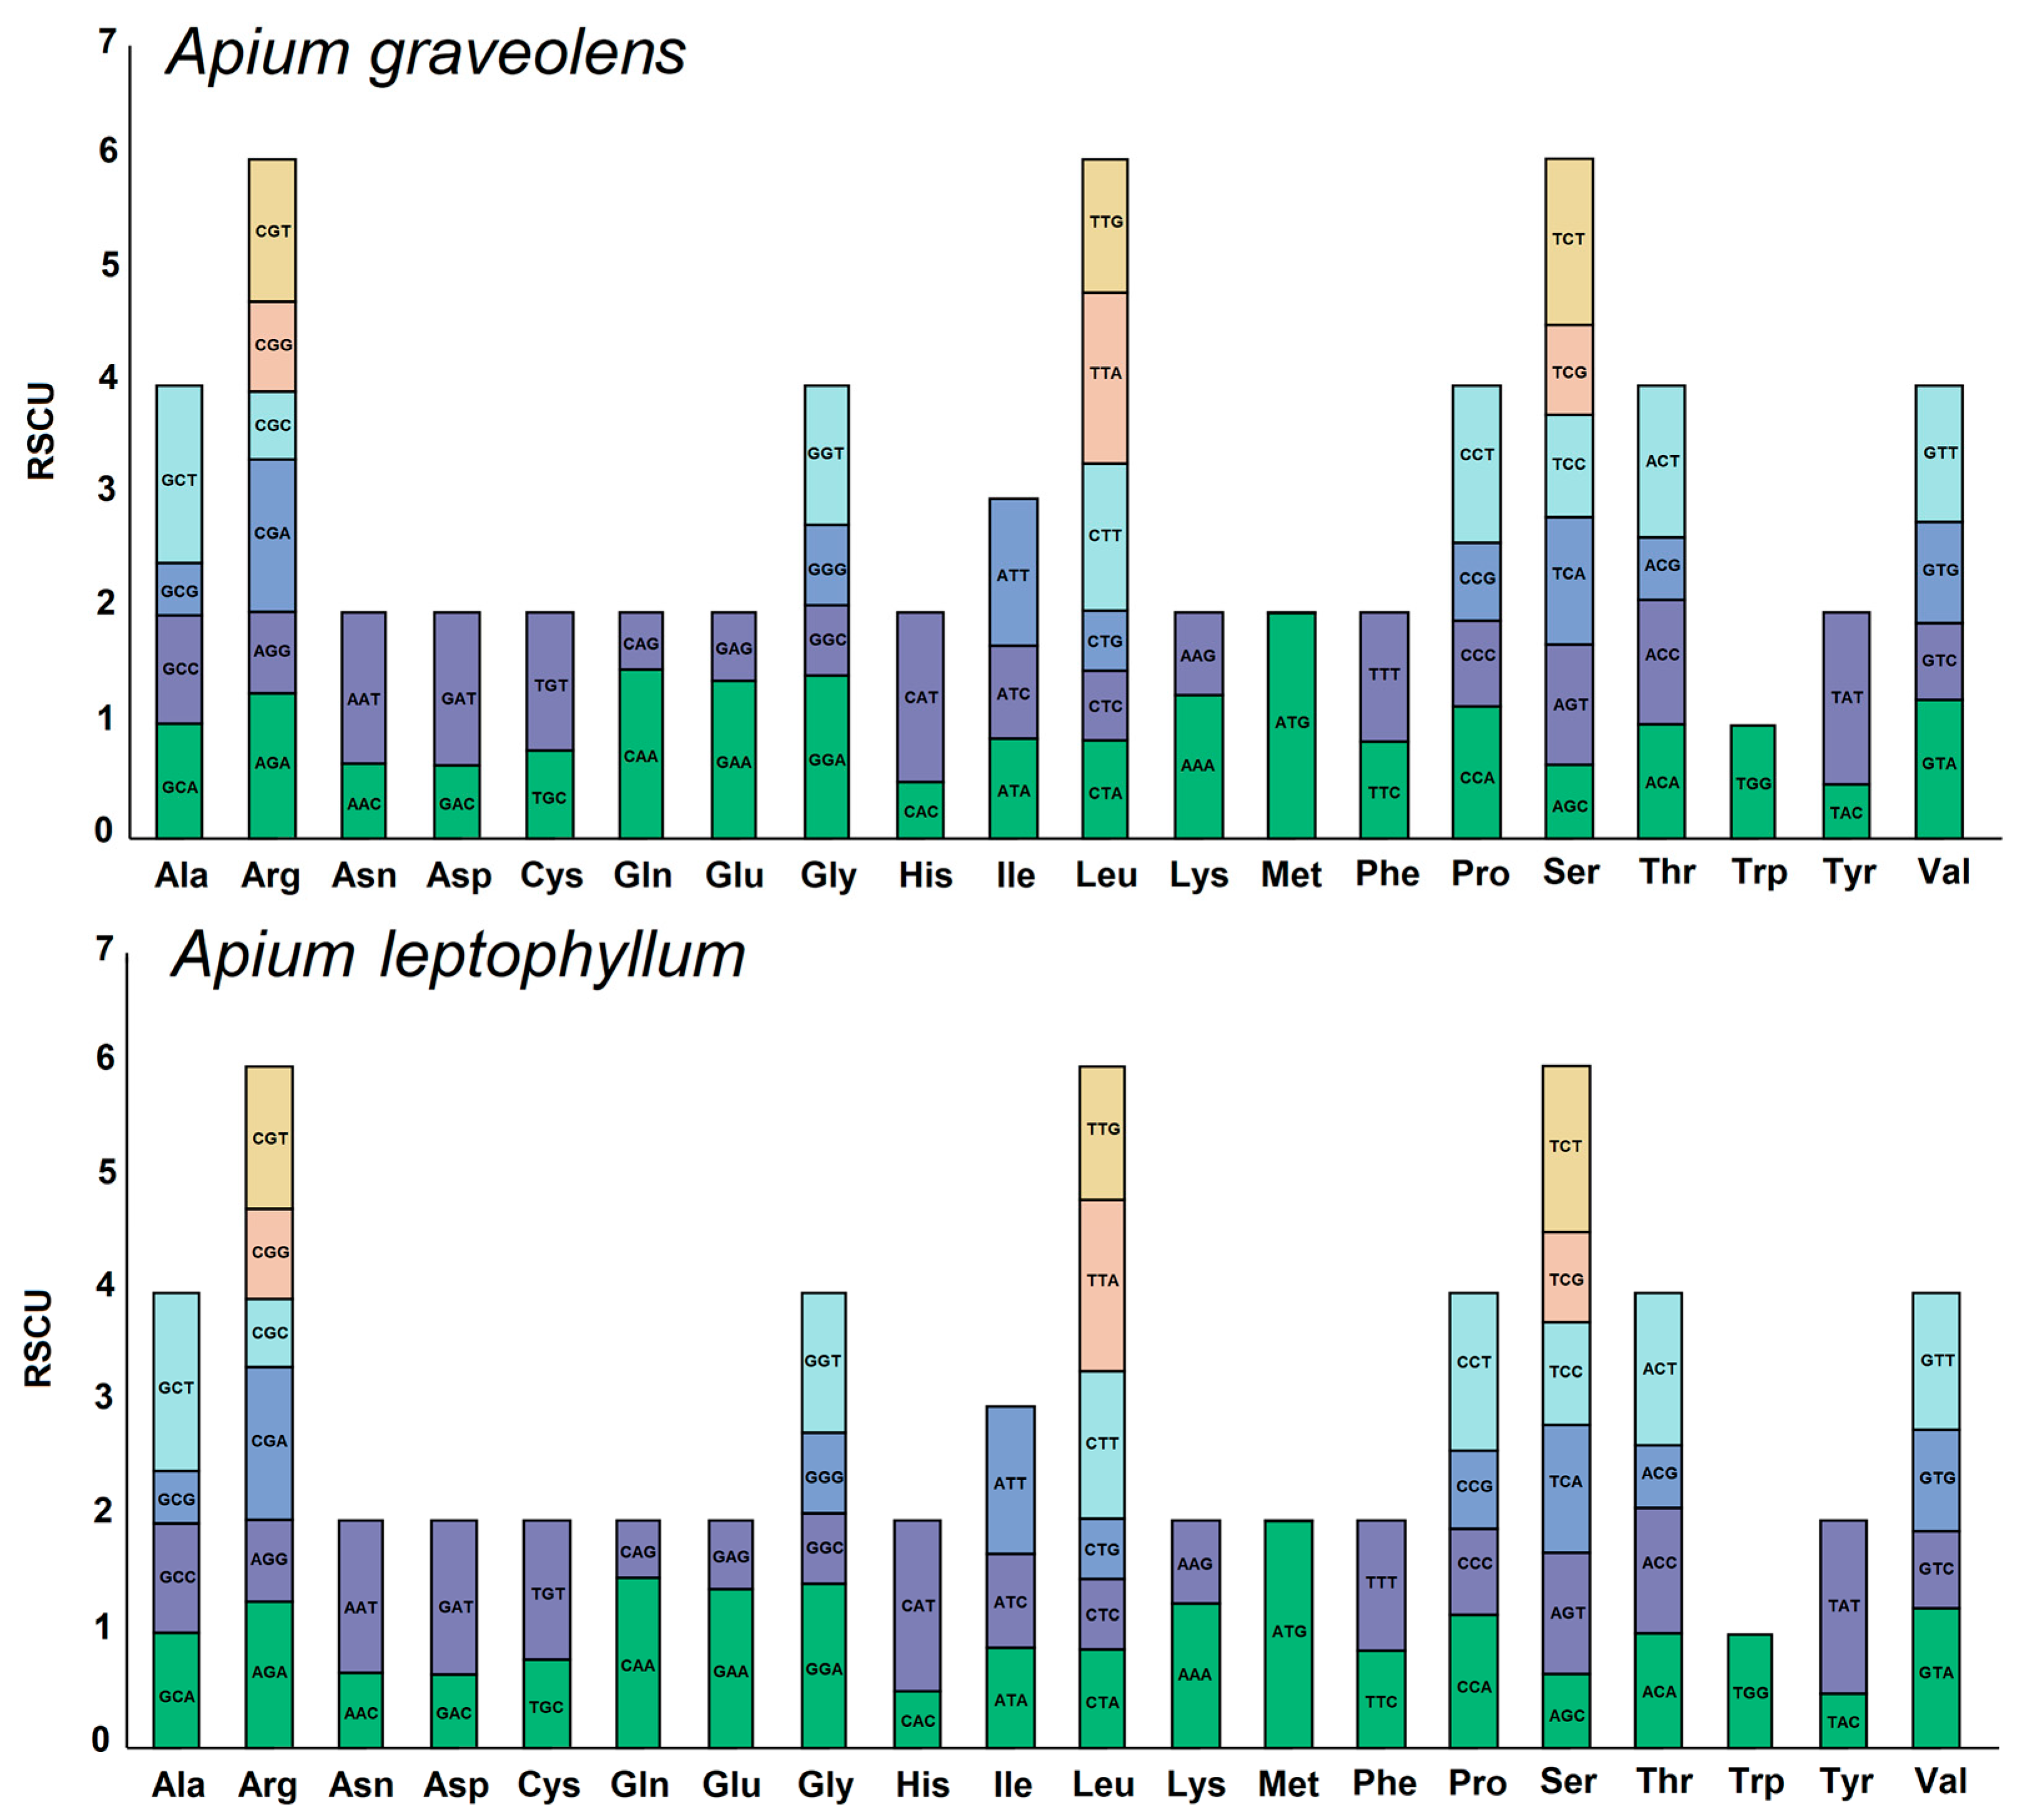
The complete circular mitochondrial genomes of A. graveolens and A. leptophyllum were obtained by the filtering, assembly, and correction of raw data using the Illumina NovaSeq 6000 sequencing platform. The mitochondrial genome lengths of A. graveolens and A. leptophyllum were 263,017 bp and 260,164 bp, respectively (Figure 1 and Supplementary Table S1). Likewise, the genome sequences of both species were very similar in length, with GC contents of 45.16% and 45.44% for A. graveolens and A. leptophyllum, respectively. As anticipated, their base composition showed an AT preference. A total of 63 genes were identified in the mitochondrial genome of A. graveolens, including 19 tRNA genes, five rRNA genes, and 39 protein-coding genes. In contrast, A. leptophyllum had 62 genes, including 20 tRNA genes, six rRNA genes, and 36 protein-coding genes (Supplementary Table S2). Comparing the annotated genomes exposed significant differences in the genes of both species. For instance, A. graveolens contained four additional duplicated protein-coding genes (atp1, atp4, nad4L, and rps4) and three duplicated trnM-CAT genes compared to A. leptophyllum. Meanwhile, A. leptophyllum had five unique tRNA genes (trnA-TGC, trnG-GCC, trnK-TTT, trnP-CGG, and trnQ-TTG) (Supplementary Table S3). Interestingly, the AT-skew and GC-skew values in the complete genome of A. graveolens were negative, whereas they were positive in A. leptophyllum. Additionally, the AT-skew values of protein-coding genes and tRNA in both A. graveolens and A. leptophyllum were negative, whereas the GC-skew values were positive. Lastly, the AT-skew values of the complete genome and rRNA were positive, whilst the AT-skew values of protein-coding genes and tRNA were negative (Supplementary Table S4).

2.2. RSCU Analysis

Codon usage bias analysis of the mitochondria of A. graveolens and A. leptophyllum revealed consistent usage patterns of codons for different amino acids. The usage patterns are detailed in Figure 2 and Supplementary Table S5. In the mitochondrial genomes of A. graveolens and A. leptophyllum, 9050 and 9338 codons were detected, respectively. The usage frequency of the leucine (Leu) codon was highest in both genomes, with 964 and 955 occurrences for A. graveolens and A. leptophyllum, respectively. Serine (Ser) codons had the next highest frequency, with 880 and 885 occurrences. This phenomenon is consistent with most species. Furthermore, the analysis determined that among the codons in the mitochondrial protein-coding genes (PCGs), excluding the start codon methionine (AUG) with an RSCU (Relative synonymous codon usage) value of one, a total of 31 codons in A. graveolens and 32 codons in A. leptophyllum had an RSCU value greater than one, indicating a general preference for codon usage in mitochondrial PCGs. Notably, methionine (Met) showed a high preference for the AUG codon, with the highest RSCU value of 1.99 in A. graveolens and A. leptophyllum. Termination codon (Ter) UAA also exhibited a higher preference, with RSCU values of 1.78 in A. graveolens and 1.68 in A. leptophyllum. It is worthwhile emphasizing that phenylalanine (Phe) had a maximum RSCU value lower than 1.2, indicating a weaker codon usage preference. Among the 31 codons in A. graveolens and the 32 codons in A. leptophyllum with RSCU values greater than one, only three codons (CUC, UUG, and AUG) ended with G/C, whereas the remaining ended with A/T bases, accounting for 90.3% and 90.6% of codons in A. graveolens and A. leptophyllum, respectively. This observation implies that the mitochondrial genome codons in A. graveolens and A. leptophyllum are more inclined to end with A/T bases than G/C.

2.3. SSRs and Repeat Sequence Analysis

A total of 335 and 196 simple sequence repeats (SSRs) were detected in the mitochondrial genomes of A. graveolens and A. leptophyllum, respectively (with lengths greater than or equal to 30 bp). Among them, 163 and 111 were forward repeats, and 172 and 84 were palindromic repeats. Additionally, there was one reverse repeat in the mitochondrial genome of A. leptophyllum but no complementary repeats in either species (Figure 3). The number of repeats in the mitochondrial genomes of A. graveolens and A. leptophyllum accounted for 18.90% and 11.02% of their respective genomes. The longest repeat sequence in A. graveolens was a forward repeat with a length of 10,968 bp, while that in A. leptophyllum was a palindromic repeat with a length of 11,643 bp. The majority of repeat sequences in both species (96.11–97.95%) had lengths ranging from 30 to 199 bp. Nevertheless, there were eight repeat sequences longer than 1000 bp in A. graveolens and four in A. leptophyllum, accounting for 13.03% and 7.79% of their respective genomes (Supplementary Tables S6 and S7).

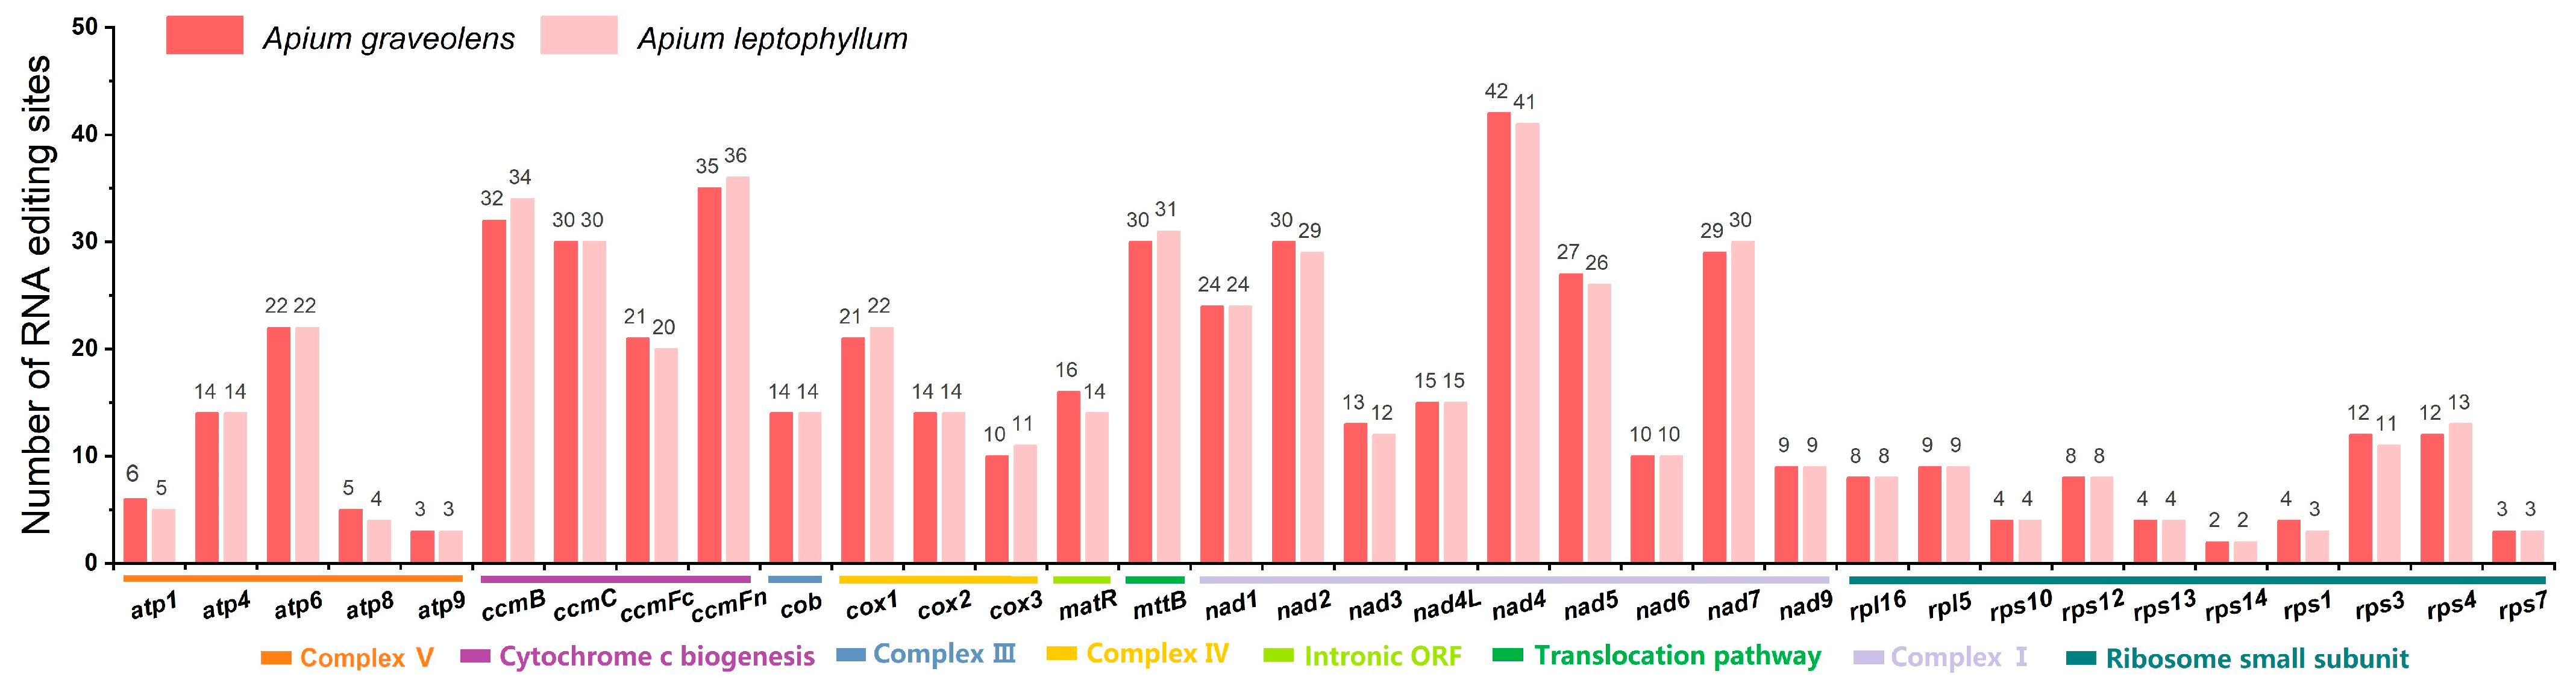
2.4. The Prediction of RNA Editing

RNA editing site analysis was performed on the two celery species, A. graveolens and A. leptophyllum, of which 538 and 535 RNA editing sites were identified in 35 gene types, respectively. Among them, the nad4 gene was found to have the highest number of predicted RNA editing sites, with 42 in A. graveolens and 41 in A. leptophyllum (Figure 4). Current research suggests that the most prevalent type of RNA editing is C-to-U, although, in some species, U-to-C editing can also be observed. Interestingly, both A. graveolens and A. leptophyllum showed U-to-C editing, with 20 and 27 instances, respectively (Supplementary Table S8). Moreover, there were 24 common substitution patterns of RNA editing between the two species. Among these substitutions, the most frequent amino acid changes were serine-to-leucine (S-to-L), proline-to-leucine (P-to-L), and serine-to-phenylalanine (S-to-F), whereas serine-to-proline (S-to-P) was the least common. Ribosomal proteins (rps1, rps7, rps13, rps14, and rps16) and ATPase subunit (atp8) had relatively fewer derived RNA editing substitutions (1–8 sites), whereas other genes had 12–95 editing sites. Additionally, the nad1, nad2, and nad5 genes contained both cis- and trans-spliced introns, whereas the ccmFC, nad4, nad7, rps3, rps10, and rps14 genes only encompassed trans-spliced introns, indicating significant editing in NADH dehydrogenase subunit transcripts.

2.5. Structural Comparison of A. graveolens and A. leptophyllum

Owing to the relatively large size of the mitochondrial genome, a protein-coding region was extracted from the rrn18 of A. graveolens and the nad5 of A. leptophyllum to generate a new circular map. This sequence comprised 68 genes, of which 48 were protein-coding genes. As illustrated in Figure 5, there were 21 plastid-derived fragments in the mitochondrial genome of A. graveolens, fewer than the 27 fragments in A. leptophyllum, insinuating a faster turnover of DNA in A. leptophyllum compared to A. graveolens. Aside from this, the mitochondrial genomes of both species exhibited extremely high homology in their sequence structure.

2.6. Sequence Similarity between Mitochondrial and Chloroplast Genomes

Sequence similarity analysis determined that the identified homologous sequences in the mitochondrial and chloroplast genomes of A. graveolens and A. leptophyllum were 21,435 bp and 12,739 bp, respectively, accounting for 8.14% and 4.89% of the mitochondrial genome (Figure 6). In both celery species, 23 plastid-derived genome fragments, including genes and intergenic regions, were detected, with 12 fragments ranging from 152 to 7488 bp. Furthermore, among the genome fragments with over 93% sequence homology to the original chloroplast, 17 fragments were present in A. graveolens and 15 fragments in A. leptophyllum. Moreover, it was found that psbA in A. graveolens and trnH-GUG in A. leptophyllum had 100% sequence homology. There were also 11 complete chloroplast genes (ndhB, rps7, rps12, ycf2, rpl23, atpe, atpB, rbcL, psbB, pet1, and petg), six tRNAs (trnL-caa, trnV-gac, tRNA-Ile, trnM-cau, trnW-cca, and trnP-UgG), and one rRNA (Rrn16). Finally, nucleotide substitutions were observed in tRNAs, attributable to plastid copy.

2.7. The Ka/Ks Ratio and Nucleotide Diversity (Pi) Values

According to Figure 7A, three Apiaceae plants, ginseng, carrot, and Bupleurum, manifested certain variations in protein-coding genes compared to A. graveolens and A. leptophyllum, with all genes having a Ka/Ks value less than 0.5 (Supplementary Table S9). This finding signaled that these genes are highly conserved during plant evolution and are subject to purifying selection pressure. In A. leptophyllum vs. Panax ginseng (KF735063.1) and A. leptophyllum vs. Daucus carota (JQ248574.1), two genes (atp4, rpl10, and mttB, rps1) had a Ka/Ks value greater than one, whilst no genes had a Ka/Ks value greater than one in A. graveolens vs. B. falcatum (KX887330.1) and A. leptophyllum vs. B. falcatum, inferring that these genes have undergone significant purifying selection. Furthermore, in comparison to three other plants, A. graveolens and A. leptophyllum had Ka/Ks values less than one for nad1, nad2, nad3, and nad4, suggesting positive selection in these four genes among different plants in the Apiaceae family.
The calculation of the Pi values for the 52 shared genes between A. graveolens and A. leptophyllum uncovered that the variation for 47 genes ranged between 0.00533 and 0.06164 (Figure 7B). More importantly, the gene with the highest variation level was atp9, with a Pi value of 0.09333, followed by rps1 and rpl5, with Pi values of 0.06164 and 0.5344, respectively. Among the detected variant genes, 35 were protein-coding genes, 10 were tRNA genes, and three were rRNA genes. Indeed, the three genes with the highest variation level were all protein-coding genes, signifying that these three hotspots likely contain information on evolutionary sites and could be potential molecular markers. Collectively, these results indicate that nucleotide sequence variation chiefly occurs in the coding regions (CDs) of protein-coding genes, which may be the primary cause of variation among Apiaceae plants.

2.8. Comparative Genomics Analysis

Using the mitochondrial genome sequence of celery as a reference, a comparative analysis of the mitochondrial genomes of A. graveolens, A. leptophyllum, and three other Apiaceae plants was conducted to assess their co-linearity. The results exposed significant gene rearrangements and complex structural variations among the five plant mitochondrial genomes (Figure 8A,B). A. graveolens and A. leptophyllum possessed similar genome sizes but exhibited substantial structural differences, indicating a weak co-linearity between them. At the same time, D. carota had a comparable mitochondrial genome size and structure to A. graveolens, displaying some degree of co-linearity. Compared to the remaining three Apiaceae plants, A. graveolens and A. leptophyllum had smaller mitochondrial genomes and relatively shorter homologous regions, suggesting a close correlation between the degree of variation among Apiaceae species and mitochondrial genome size.

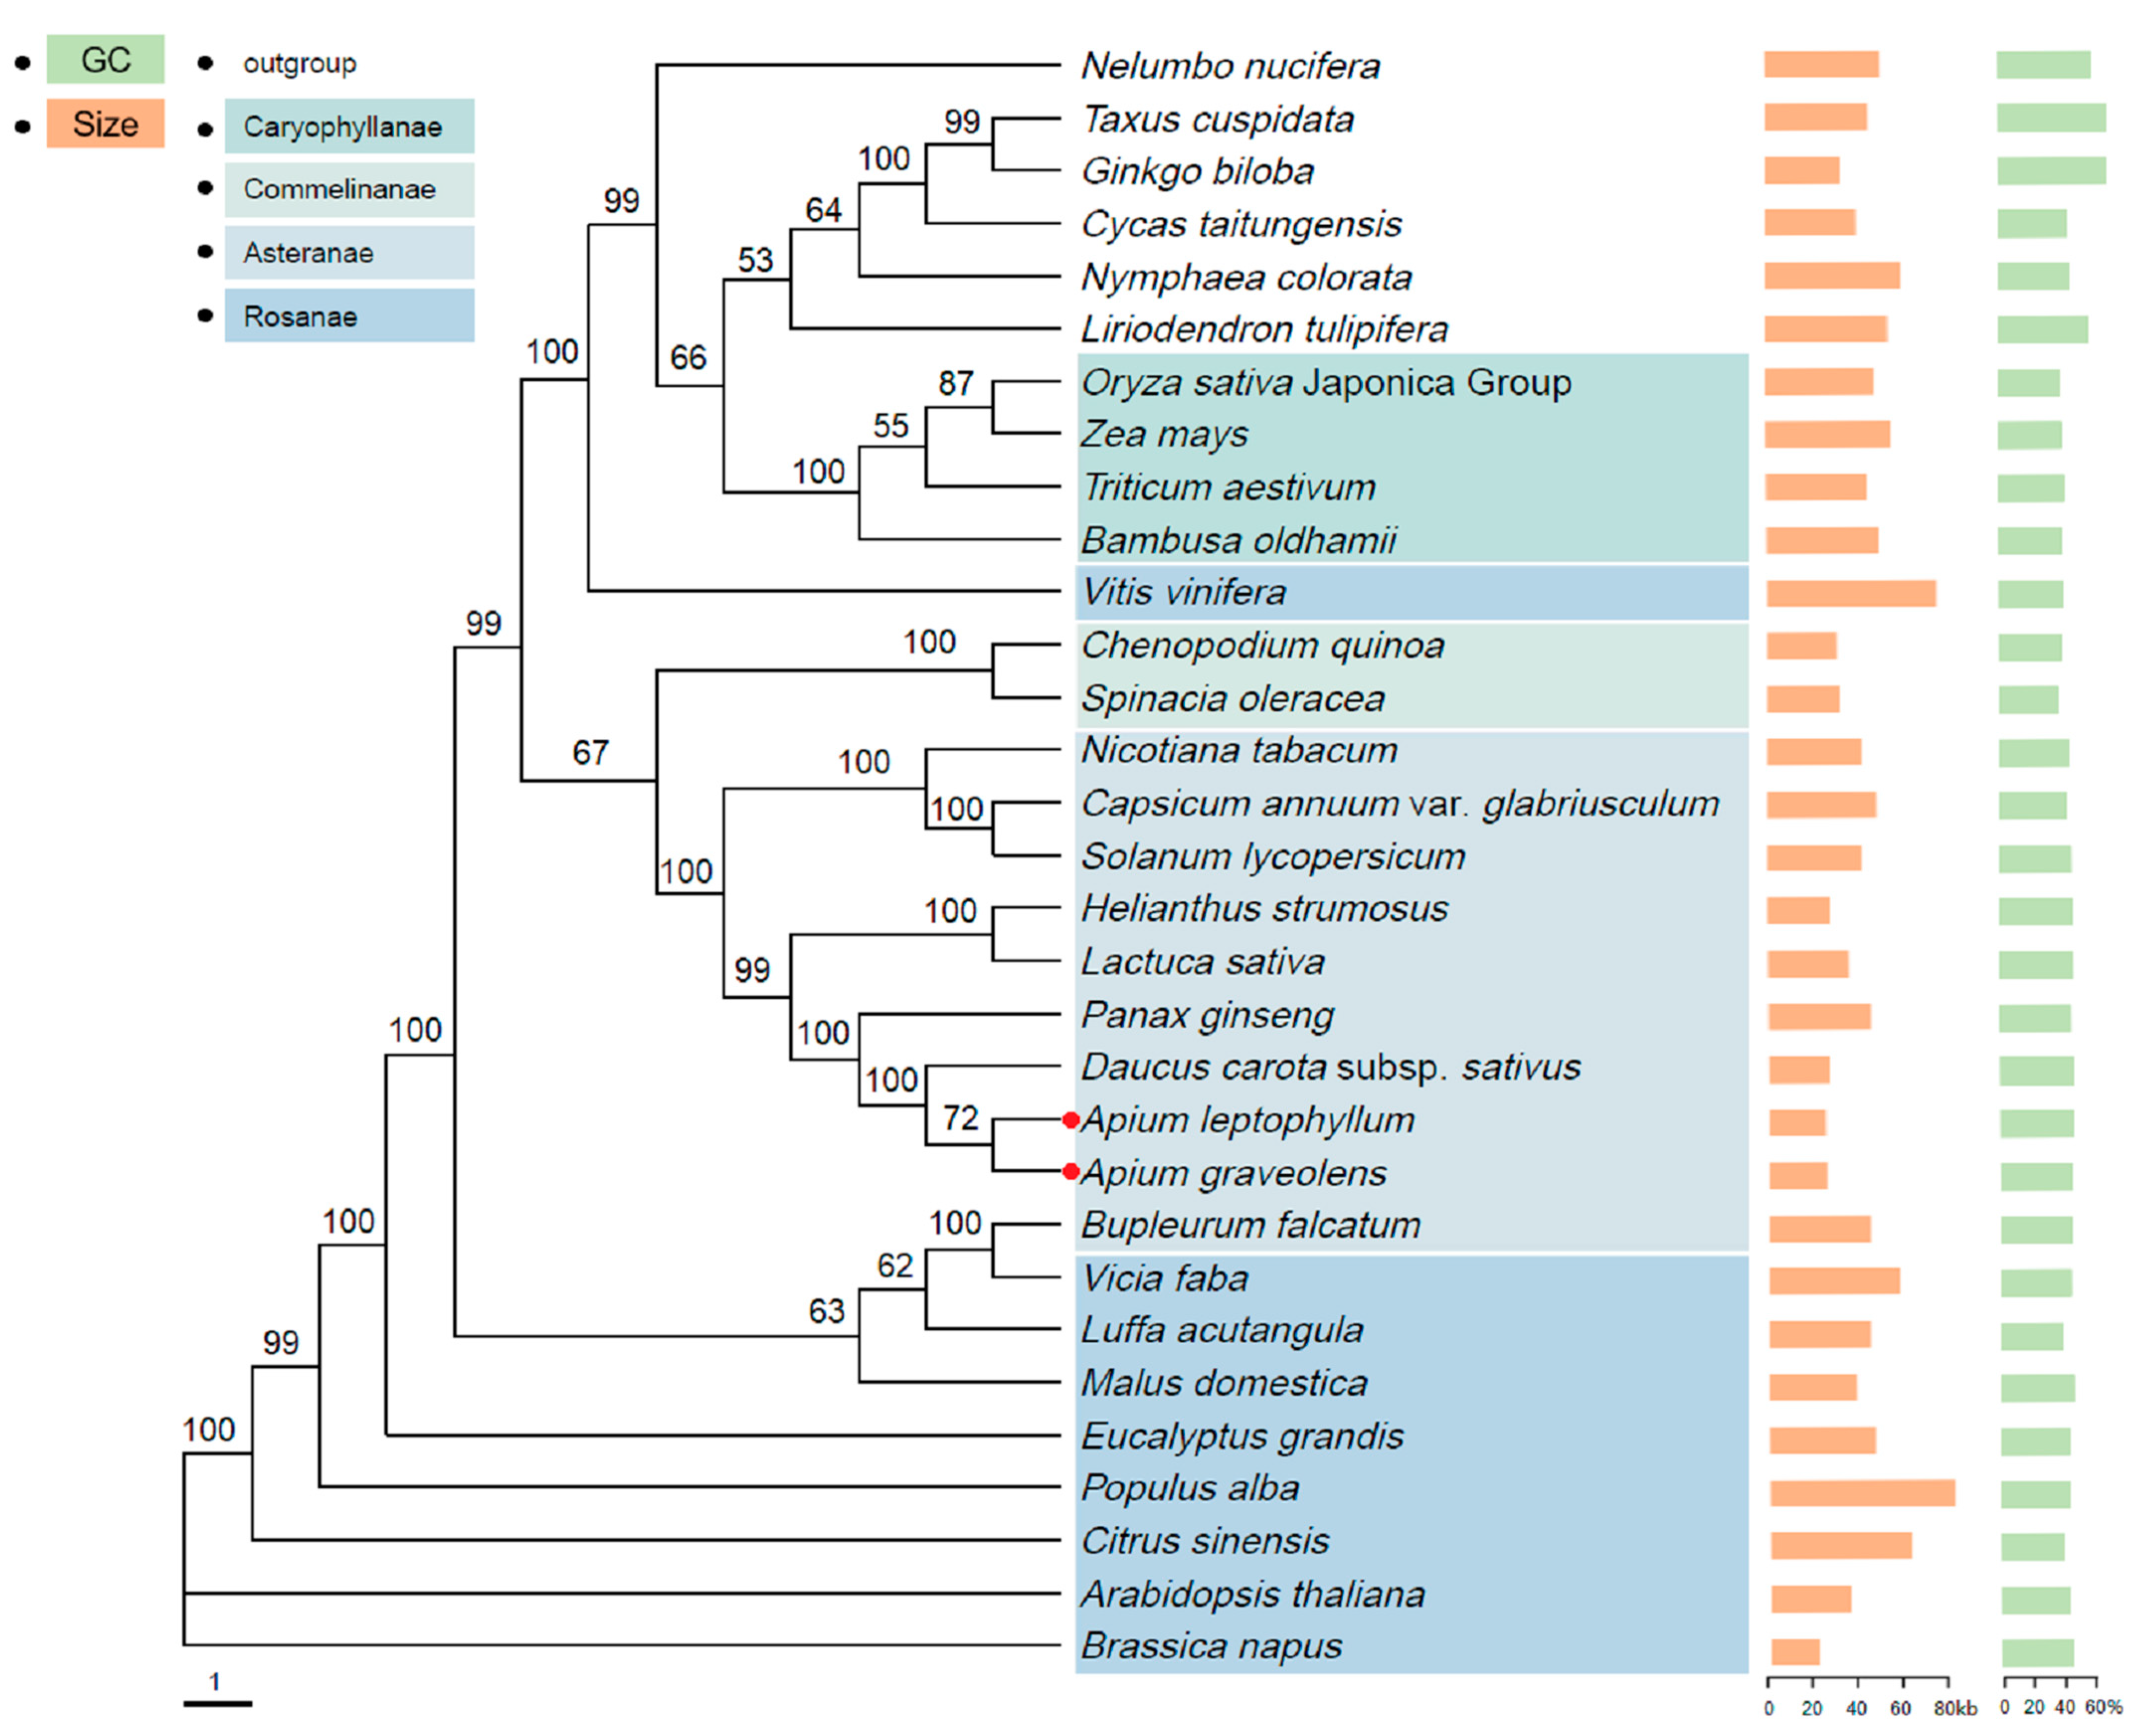
2.9. Phylogenetic Relationship

Based on the annotation of the mitochondrial genomes of A. graveolens and A. leptophyllum, a phylogenetic tree was constructed using maximum likelihood analysis, with Nelumbo nucifera (KR610474.1), Liriodendron tulipifera (MK340747.1), Nymphaea colorata (KY889142.1), Taxus cuspidata (MN593023.1), Ginkgo biloba (KM672373.1), and Cycas taitungensis (AP009381.1) as outgroups, whilst the mitochondrial genome data of 29 other plant species were downloaded from NCBI. As depicted in Figure 9, A. graveolens and A. leptophyllum formed a branch within Asteranae, with marginal differences in mitochondrial genome size and GC content, supported by a node support value of 72%. Additionally, the two celery species are sister groups to Daucus carota, forming a highly supported clade with 100% support. Furthermore, A. graveolens, A. leptophyllum, Daucus carota, Panax ginseng, Lactuca sativa, and Helianthus strumosus clustered together within Rosanae, indicating moderate relatedness. More importantly, the mitochondrial genome sizes within Rosanae significantly differed from those of the two Apium species, implying substantial differences between Rosanae and the two celery species.

3. Discussion

Herein, the mitochondrial genomes of A. graveolens and A. leptophyllum were assembled using second- and third-generation high-throughput sequencing technologies. The results revealed that the genome sequence lengths and GC contents of the two plants were very similar. The mitochondrial genome of A. graveolens had a length of 263,017 bp and a GC content of 45.16%. Similarly, the mitochondrial genome of A. leptophyllum had a length of 260,164 bp and a GC content of 45.44%. These values were comparable to the mitochondrial genomes of other sequenced plants such as C.duntsa (45.62%) [26], B. chinense (45.68%) [20], and B. juncea (45.24%) [27]. Nonetheless, significant differences were noted in the identified genes between the two species. To begin, A. graveolens had seven additional genes (atp1, atp4, nad4L, rps4, and 3 trnM-CAT) compared to A. leptophyllum. However, A. leptophyllum contained five unique tRNA genes (trnA-TGC, trnG-GCC, trnK-TTT, trnP-CGG, and trnQ-TTG). Therefore, it can be deduced that at the whole genome level, the mitochondrial genome size, structure, number, and types of A. graveolens and A. leptophyllum, as well as their base composition and GC content, are highly conserved. Most mitochondrial variations occur in the intergenic regions, which is consistent with the findings from the grape mitochondrial genome study [14].
Throughout the course of plant evolution, the mitochondrial genome undergoes a multitude of modifications, including alterations in genome structure and nucleotide composition, as well as the loss and transfer of protein-coding and tRNA genes [28]. This preference is considered the result of a combination of natural selection, species mutation, and genetic drift [29]. Therefore, exploring the characteristics and fluctuations in codon usage strategies can assist in the analysis of the phylogenetics and evolutionary process of the mitochondrial genome [30]. The codon preference analysis results showed that, in line with most plant species, both A. graveolens and A. leptophyllum had the highest frequency of leucine (Leu) codons, with 964 and 955 occurrences, respectively [31]. Additionally, the research also revealed that dicot plants exhibit a bias towards A/T-ending codons [32]. In the protein-coding genes of A. graveolens and A. leptophyllum, a strong A/T bias was observed in the preferred codons with RSCU values greater than one. RNA editing is closely associated with the potential molecular functions and physiological processes of mitochondria in higher plants [33]. Thus, investigating RNA editing sites yields a better understanding of the expression of mitochondrial and chloroplast genes in plants. In our study, 544 and 520 RNA editing sites were predicted in A. graveolens and A. leptophyllum, slightly higher than those predicted in other plants such as Arabidopsis (441 sites) [34] and rice (491 sites) [35].
Genomic repetitive sequences are abundant in mitotic genomes and serve as important evidence for assessing species evolution and genetic characteristics [36]. Simple sequence repeats (SSRs) can be used to identify different types of genomes and environmental characteristics of species, providing a scientific basis for species genetics [37]. The mitochondrial genomes of A. graveolens and A. leptophyllum contain 335 and 196 pairs of repetitive sequences (length ≥ 30 bp), accounting for 18.90% and 11.02% of the two mitochondrial genomes, respectively, and no complementary repetitive sequences were detected. However, the differences in the quantity and types of repeats may be caused by gene duplication or variation, as well as geographical and ecological factors [38]. To further analyze the degree of evolution among species, a Ka/Ks analysis was carried out on the mitochondrial genes of three other Apiaceae plants. The results indicate that, compared to A. graveolens and A. leptophyllum, the protein-coding genes of the other three Apiaceae plants have undergone some degree of variation. The Ka/Ks values for all genes are less than 0.5, indicating that these coding genes are highly conserved and have not undergone rapid evolution during plant evolution [39].
During the evolutionary process of mitochondria, there is a frequent occurrence of DNA transfer events between the mitochondrial genome and the nuclear genome, as well as between different species [40]. Some chloroplast fragments migrate to the mitotic genome, and the length and sequence similarity of the migrated fragments vary among species [41]. In our study, the total lengths of the chloroplast genome transferred to the mitochondrial genome in A. graveolens and A. leptophyllum were 21,435 bp and 12,739 bp, accounting for 8.14% and 4.89% of the mitochondrial genome, respectively, with tRNA gene transfer being the most common [42]. With rapid advances in sequencing technologies, mitochondrial genome sequencing has become a fundamental approach to solving phylogenetic relationships [43]. In this study, the phylogenetic analysis based on mitochondrial genome sequences of 29 angiosperms demonstrated that A. graveolens and A. leptophyllum clustered together, signifying highly conserved mitochondrial genomes between them, with the differences potentially originating from intra-species evolution. In summary, the analysis of the mitochondrial genomes of A. graveolens and A. leptophyllum is anticipated to provide novel insights and evidence for studies on phylogenetics, evolution, and conservation genetics of the Apium species.

4. Materials and Methods

4.1. Materials, DNA Extraction, and Sequencing

The A. graveolens cultivar of ‘Jinnan Shiqin’ and the wild seeds of A. leptophyllum were obtained from the Modern Agricultural Base of Sichuan Agricultural University, located at coordinates 103°37′39″–103°40′5″ E and 30°32′21″–30°34′35″ N. The seedlings were grown in pots within a controlled-environment growth chamber set at a temperature of 20 °C and a relative humidity of 80%. After two months, the seedlings of A. graveolens and A. leptophyllum were harvested and quickly frozen in liquid nitrogen. Plant DNA extraction kits (TransGene, Beijing, China) were used to extract genomic DNA from A. graveolens and A. leptophyllum, and the quality of DNA was checked by using NanoDrop ND 2000 (ThermoFischer, Waltham, MA, USA). The extracted DNA was sheared into fragments using an ultrasonic crusher, and two 150 bp paired-end libraries were prepared from two DNA samples. The sequencing was performed at Genepioneer Biotechnologies (Nanjing, China) using two sequencing strategies Illumina novaseq6000 and Nanopore with paired-end reads of 150 bp.

4.2. Mitochondrial Genome Assembly

The raw reads generated from second-generation sequencing were deduplicated and quality-filtered using Fastp software (version 0.20.0, https://github.com/OpenGene/fastp, accessed on 5 October 2022). Canu [R] was used to assemble the three generations of sequencing data into contigs using the following parameters: genomeSize = 5 m and correctedErrorRate = 0.03. Then, contigs were aligned to other completely assembled mitochondrial genomes by blast v2.6 (https://blast.ncbi.nlm.nih.gov/Blast.cgi, accessed on 10 October 2022) and further assembled by NextPolish (version 1.3.1, https://github.com/Nextomics/NextPolish, accessed on 10 October 2022) [44]. Finally, Pilon was used to correct the assembly sequences. The complete mitochondrial genomes of Apium graveolens and Apium leptophyllum were submitted into the NCBI database with the accession numbers MZ328722 and MZ328723, respectively.

4.3. Genome Annotations and Analysis

Protein-coding genes and rRNA were annotated by their similarity to published plant mitochondrial sequences and by using BLAST searches. The tRNA genes were annotated using tRNAscanSE (http://lowelab.ucsc.edu/tRNAscan-SE/, accessed on 20 October 2022) [13]. ORFs were predicted using the NCBI Open Reading Frame Finder (https://www.ncbi.nlm.nih.gov/orffinder/, accessed on 20 October 2022) with the minimum ORF length set at 100 bp. The RNA editing sites (C-to-U) in protein-coding genes were predicted using the online program PREPACT (v3.12.0, http://www.prepact.de/prepact-main.php, accessed on 21 October 2022). The circular map of the mitochondrial genome was constructed using OGDRAW (v1.3.1, https://chlorobox.mpimp-golm.mpg.de/OGDraw.html, accessed on 21 October 2022) [45].

4.4. RNA Editing Analysis and Characteristic Analysis of Mitochondrial Genome

The intron splicing pattern, RNA editing site map, and RNA editing sites were predicted using the http://prep.unl.edu/ (accessed on 25 October 2022) method. The protein coding genes of the mitochondrial genome were analyzed for codon preference using Mega 7.0 (v11.0.10) software, and RSCU values were calculated. Interspersed repetitive sequences (IRSs) across the mitochondrial genome were determined by REPuter (https://bibiserv.cebitec.uni-bielefeld.de/reputer/, accessed on 27 October 2022) with the minimum repeat size set to 30 and the hamming distance set to 3. There were four identification forms (forward, palindromic, reverse, complement) for IRS. A BLAST search (https://blast.ncbi.nlm.nih.gov/Blast.cgi, accessed on 27 October 2022) program was used to find the homologous sequences between the chloroplast genome and mitochondrial genome; the similarity was set to 70%, and the E-value was set to 10 × 10−5. Homologous sequence results were visualized using Circos (v0.69-5, http://circos.ca/software/download/, accessed on 27 October 2022). The chloroplast genomes of A. graveolens and A. leptophyllum were downloaded from NCBI with accession numbers MZ328720 and MZ328721, respectively.

4.5. Comparative Analysis of Mitochondrial Genome

Sequences of six species from the Apiaceae family, including Daucus carota (JQ248574.1), Bupleurum falcatum (KX887330.1), Panax ginseng (KF735063.1), and Dendropanax morbifer (MW073906.1), with their mitochondrial genome, were selected for comparative mitogenome analysis. The MAFFT software (v7.310, https://mafft.cbrc.jp/alignment/software/, accessed on 3 November 2022) was used for multiple nucleotide sequence alignment, and the slide window analysis was subsequently carried out using DnaSP (v5.0, http://www.ub.edu/dnasp, accessed on 3 November 2022) to determine the Pi value. KaKs_Calculator (v2.0, https://sourceforge.net/projects/kakscalculator2/, accessed on 6 November 2022) was used to calculate the values of the nonsynonymous substitution rate (Ka) and synonymous substitution rate (Ks). The genomic alignment was performed by the Mauve software (http://darlinglab.org/mauve, accessed on 10 November 2022) using default parameters, and whole genome alignment visualization was created using CGVIEW (https://www.bioinformatics.org/cgview/download.html, accessed on 3 November 2022) [46].

4.6. Phylogenetic Analysis

To investigate the mitochondrial genome evolutionary relationship, 28 completely sequenced mitochondrial genomes of plants, including Malus domestica (FR714868.1), Luffa acutangula (MT374097.1), Vicia faba (KC189947.1), Populus alba (MK034705.1), Citrus sinensis (MG736621.1), Brassica napus (AP006444.1), Arabidopsis thaliana (Y08501.2), Eucalyptus grandis (MG925370.1), Vitis vinifera (FM179380.1), Solanum lycopersicum (MF034193.1), Nicotiana tabacum (KR780036.1), Capsicum annuum (MN196478.1), Daucus carota (JQ248574.1), Bupleurum falcatum (KX887330.1), Panax ginseng (KF735063.1), Dendropanax morbifer (MW073906.1), Lactuca sativa (MK642355.1), Helianthus strumosus (MT588181.1), Spinacia oleracea (KY768855.1), Liriodendron tulipifera (MK340747.1), Chenopodium quinoa (MK182703.1), Oryza sativa (BA000029.3), Zea mays (AY506529.1), Triticum aestivum (AP008982.1), Bambusa oldhamii (EU365401.1), Taxus cuspidata (MN593023.1), Cycas taitungensis (AP009381.1), Ginkgo biloba (KM672373.1), Nymphaea colorata (KY889142.1), and Nelumbo nucifera (KR610474.1), were downloaded from the NCBI (accessed on 25 November 2022). Phylogenetic analysis was performed based on all mitochondrial gene sequences among two Apium plants and another 28 species. Sequence alignments were conducted by MAFFT (v7.427) and a maximum-likelihood phylogenetic tree was constructed using RAxML (v8.2.10) with 1000 bootstraps.

5. Conclusions

Plant mitochondrial genomes have highly conserved gene content and a relatively slow evolution rate, while their genomic structure, size, and repetitive sequences tend to be variable. Herein, the mitochondrial genomes of A. graveolens and A. leptophyllum were assembled and annotated, and the annotated genes were analyzed. The total lengths of the A. graveolens and A. leptophyllum genomes were 263,017 bp and 260,164 bp, with GC contents of 45.16% and 45.44%, respectively, and both showed a preference for AT base composition. Additionally, the usage of codons, repetitive sequences, genome recombination, chloroplast-to-mitochondria DNA transformation, and RNA editing sites was analyzed. Moreover, the phylogenetic tree based on mitochondrial genomes of 29 angiosperms contributed to the scientific classification of A. graveolens and A. leptophyllum. Our study not only provides information on the genetic characteristics, phylogenetic relationships, and evolution of A. graveolens and A. leptophyllum, but also serves as an important resource for future investigations into the evolution of mitochondrial genomes in the Apiaceae species.

Supplementary Materials

The following supporting information can be downloaded at https://www.mdpi.com/article/10.3390/ijms241914615/s1.

Author Contributions

Conceptualization, M.L. and G.T.; data processing, X.L. and W.L. (Weilong Li); formal analysis, X.L. and J.Z.; investigation, Q.H. and W.L. (Wei Lu); software, Q.L.; A.X. and S.Z.; writing—original draft preparation, X.L. and M.L.; writing—review and editing, Y.Z. and G.T.; funding acquisition, A.X. and Y.Z. All authors have read and agreed to the published version of the manuscript.

Funding

This research was funded by the National Natural Science Foundation of China (32002027), and the National Natural Science Foundation of Sichuan Province (2022NSFSC1647), the Project of Guizhou Provincial Department of Science and Technology “Construction and Utilization of Horticultural Platform of Plant GenBank Creation” (No. Qiankehe Fuqi [2022] 005, No. Qiankehe Support [2022] Key 019), Shaanxi Provincial Department of Science and Technology (2022ZY1-CGZY-07), and the Project of Research and Demonstration of Key Technologies for Quality Improvement and Efficiency Enhancement of Vegetables in Bazhong City.

Data Availability Statement

The mitochondrial genome sequences of Apium graveolens and Apium leptophyllum that were generated are deposited at NCBI under the accession numbers MZ328722 and MZ328723, respectively.

Conflicts of Interest

The authors declare no conflict of interest.

References

  1. Woloszynska, M. Heteroplasmy and stoichiometric complexity of plant mitochondrial genomes though this be madness, yet there’s method in’t. J. Exp. Bot. 2010, 61, 657–671. [Google Scholar] [CrossRef] [PubMed]
  2. Wu, Z.Q.; Liao, X.Z.; Zhang, X.N.; Tembrock, L.R.; Broz, A. Genomic architectural variation of plant mitochondria—A review of multichromosomal structuring. J. Syst. Evol. 2022, 60, 160–168. [Google Scholar] [CrossRef]
  3. Niu, L.; Zhang, Y.; Yang, C.; Yang, J.; Ren, W.; Zhong, X.; Zhao, Q.; Xing, G.; Zhao, Y.; Yang, X. Complete mitochondrial genome sequence and comparative analysis of the cultivated yellow nutsedge. Plant Genome 2022, 15, e20239. [Google Scholar] [CrossRef] [PubMed]
  4. Daloso, D.M.; Müller, K.; Obata, T.; Florian, A.; Tohge, T.; Bottcher, A.; Riondet, C.; Bariat, L.; Carrari, F.; Nunes-Nesi, A.; et al. Thioredoxin, a master regulator of the tricarboxylic acid cycle in plant mitochondria. Proc. Natl. Acad. Sci. USA 2015, 112, E1392–E1400. [Google Scholar] [CrossRef]
  5. Valero, T. Mitochondrial biogenesis: Pharmacological approaches. Curr. Pharm. Des. 2014, 20, 5507–5509. [Google Scholar] [CrossRef]
  6. Dong, S.; Chen, L.; Liu, Y.; Wang, Y.; Zhang, S.; Yang, L.; Lang, X.; Zhang, S. The draft mitochondrial genome of Magnolia biondii and mitochondrial phylogenomics of angiosperms. PLoS ONE 2020, 15, e0231020. [Google Scholar] [CrossRef]
  7. Smith, D.R.; Keeling, P.J. Mitochondrial and plastid genome architecture: Reoccurring themes, but significant differences at the extremes. Proc. Natl. Acad. Sci. USA 2015, 112, 10177–10184. [Google Scholar] [CrossRef]
  8. Noutahi, E.; Calderon, V.; Blanchette, M.; El-Mabrouk, N.; Lang, B.F. Rapid genetic code evolution in green algal mitochondrial genomes. Mol. Biol. Evol. 2019, 36, 766–783. [Google Scholar] [CrossRef]
  9. Yoon, Y.J.; Kang, Y.; Kim, M.K.; Lee, J.; Park, H.; Kim, J.H.; Lee, H. The complete mitochondrial genome of an Antarctic moss Syntrichia filaris (Müll.Hal.) R.H. Zander. Mitochondrial DNA B Resour. 2016, 27, 2779–2780. [Google Scholar] [CrossRef]
  10. Yurina, N.P.; Odintsova, M.S. Mitochondrial genome structure of photosynthetic eukaryotes. Biochemistry 2016, 81, 101–113. [Google Scholar] [CrossRef]
  11. Alverson, A.J.; Wei, X.; Rice, D.W.; Stern, D.B.; Barry, K.; Palmer, J.D. Insights into the evolution of mitochondrial genome size from complete sequences of Citrullus lanatus and Cucurbita pepo (Cucurbitaceae). Mol. Biol. Evol. 2010, 27, 1436–1448. [Google Scholar] [CrossRef] [PubMed]
  12. Rodríguez-Moreno, L.; González, V.M.; Benjak, A.; Martí, M.C.; Puigdomènech, P.; Aranda, M.A.; Garcia-Mas, J. Determination of the melon chloroplast and mitochondrial genome sequences reveals that the largest reported mitochondrial genome in plants contains a significant amount of DNA having a nuclear origin. BMC Genome 2011, 12, 424. [Google Scholar] [CrossRef] [PubMed]
  13. Jackman, S.D.; Lauren, C.; Warren, R.L.; Heather, K.; Eva, T.; MacLeod, T.; Pleasance, S.; Pandoh, P.; Zhao, Y.; Coope, R.J.; et al. Complete mitochondrial genome of a gymnosperm, Sitka spruce (Picea sitchensis), indicates a complex physical structure. Genome Biol. Evol. 2020, 12, 1174–1179. [Google Scholar] [CrossRef] [PubMed]
  14. Goremykin, V.V.; Lockhart, P.J.; Viola, R.; Velasco, R. The mitochondrial genome of Malus domestica and the import-driven hypothesis of mitochondrial genome expansion in seed plants. Plant J. 2012, 71, 615–626. [Google Scholar] [CrossRef] [PubMed]
  15. Putintseva, Y.A.; Bondar, E.I.; Simonov, E.P.; Sharov, V.V.; Oreshkova, N.V.; Kuzmin, D.A.; Konstantinov, Y.M.; Shmakov, V.N.; Belkov, V.I.; Sadovsky, M.G.; et al. Siberian larch (Larix sibirica Ledeb.) mitochondrial genome assembled using both short and long nucleotide sequence reads is currently the largest known mitogenome. BMC Genom. 2020, 21, 654. [Google Scholar] [CrossRef] [PubMed]
  16. Kozik, A.; Rowan, B.A.; Lavelle, D.; Berke, L.; Schranz, M.E.; Michelmore, R.W.; Christensen, A.C. The alternative reality of plant mitochondrial DNA: One ring does not rule them all. PLoS Genet. 2019, 15, e1008373. [Google Scholar] [CrossRef]
  17. Zou, Y.; Zhu, W.D.; Sloan, D.B.; Wu, Z.Q. Long-read sequencing characterizes mitochondrial and plastid genome variants in Arabidopsis msh1 mutants. Plant J. 2022, 112, 738–755. [Google Scholar] [CrossRef]
  18. Van de Paer, C.; Bouchez, O.; Besnard, G. Prospects on the evolutionary mitogenomics of plants: A case study on the olive family (Oleaceae). Mol. Ecol. Resour. 2018, 18, 407–423. [Google Scholar] [CrossRef]
  19. Preston, M.D.; Campino, S.; Assefa, S.A.; Echeverry, D.F.; Ocholla, H.; Amambua-Ngwa, A.; Stewart, L.B.; Conway, D.J.; Borrmann, S.; Michon, P.; et al. A barcode of organellar genome polymorphisms identifies the geographic origin of Plasmodium falciparum strains. Nat. Commun. 2014, 5, 4052. [Google Scholar] [CrossRef]
  20. Qiao, Y.; Zhang, X.; Li, Z.; Song, Y.; Sun, Z. Assembly and comparative analysis of the complete mitochondrial genome of Bupleurum chinense DC. BMC Genom. 2022, 23, 664. [Google Scholar] [CrossRef]
  21. Varré, J.S.; D’Agostino, N.; Touzet, P.; Gallina, S.; Tamburino, R.; Cantarella, C.; Ubrig, E.; Cardi, T.; Drouard, L.; Gualberto, J.M.; et al. Complete sequence, multichromosomal architecture and transcriptome analysis of the Solanum tuberosum mitochondrial genome. Int. J. Mol. Sci. 2019, 20, 4788. [Google Scholar] [CrossRef] [PubMed]
  22. Gui, Y.; Yu, W.; Ge, X.; Li, H.; Sun, C.; Mao, X.; Yuan, K. Root exudation of prometryn and its metabolites from Chinese celery (Apium graveolens). J. Pestic. Sci. 2022, 47, 1–7. [Google Scholar] [CrossRef] [PubMed]
  23. Li, M.; Li, X.; Zhou, J.; Sun, Y.; Du, J.; Wang, Z.; Luo, Y.; Zhang, Y.; Chen, Q.; Wang, Y.; et al. Genome-wide identification and analysis of terpene synthase (TPS) genes in celery reveals their regulatory roles in terpenoid biosynthesis. Front. Plant Sci. 2022, 13, 1010780. [Google Scholar] [CrossRef] [PubMed]
  24. Li, M.Y.; Hou, X.L.; Wang, F.; Tan, G.F.; Xu, Z.S.; Xiong, A.S. Advances in the research of celery, an important Apiaceae vegetable crop. Crit. Rev. Biotechnol. 2018, 38, 172–183. [Google Scholar] [CrossRef]
  25. Asamenew, G.; Tadesse, S.; Asres, K.; Mazumder, A.; Bucar, F. A study on the composition, antimicrobial and antioxidant activities of the leaf essential oil of Apiumleptophyllum (Pers.) Benth. Growing in Ethiopia. Ethiop. Pharm. J. 2008, 26, 94–99. [Google Scholar]
  26. Li, J.; Tang, H.; Luo, H.; Tang, J.; Zhong, N.; Xiao, L. Complete mitochondrial genome assembly and comparison of Camellia sinensis var. Assamica cv. Duntsa. Front. Plant Sci. 2023, 14, 1117002. [Google Scholar] [CrossRef]
  27. Chang, S.; Yang, T.; Du, T.; Huang, Y.; Chen, J.; Yan, J.; He, J.; Guan, R. Mitochondrial genome sequencing helps show the evolutionary mechanism of mitochondrial genome formation in brassica. BMC Genom. 2011, 12, 497. [Google Scholar] [CrossRef]
  28. Myszczyński, K.; Ślipiko, M.; Sawicki, J. Potential of transcript editing across mitogenomes of early land plants Shows Novel and Familiar Trends. Int. J. Mol. Sci. 2019, 20, 2963. [Google Scholar] [CrossRef]
  29. Liu, Y.; Cox, C.J.; Wang, W.; Goffinet, B. Mitochondrial phylogenomics of early land plants: Mitigating the effects of saturation, compositional heterogeneity, and codon-usage bias. Syst. Biol. 2014, 63, 862–878. [Google Scholar] [CrossRef]
  30. Verhage, L. Targeted editing of the Arabidopsis mitochondrial genome. Plant J. 2020, 104, 1457–1458. [Google Scholar] [CrossRef]
  31. Fang, B.; Li, J.; Zhao, Q.; Liang, Y.; Yu, J. Assembly of the complete mitochondrial genome of chinese plum (Prunus salicina): Characterization of genome recombination and RNA editing sites. Genes 2021, 12, 1970. [Google Scholar] [CrossRef] [PubMed]
  32. Mower, J.P. Variation in protein gene and intron content among land plant mitogenomes. Mitochondrion 2020, 53, 203–213. [Google Scholar] [CrossRef] [PubMed]
  33. He, P.; Xiao, G.; Liu, H.; Zhang, L.; Zhao, L.; Tang, M.; Huang, S.; An, Y.; Yu, J. Two pivotal RNA editing sites in the mitochondrial atp1 mRNA are required for ATP synthase to produce sufficient ATP for cotton fiber cell elongation. New Phytol. 2018, 218, 167–182. [Google Scholar] [CrossRef] [PubMed]
  34. Giegé, P.; Brennicke, A. RNA editing in Arabidopsis mitochondria effects 441 C to U changes in ORFs. Proc. Natl. Acad. Sci. USA 1999, 96, 15324–15329. [Google Scholar] [CrossRef] [PubMed]
  35. Notsu, Y.; Masood, S.; Nishikawa, T.; Kubo, N.; Akiduki, G.; Naka-zono, M.; Hirai, A. The complete sequence of the rice (Oryza sativa L.) mitochondrial genome: Frequent DNA sequence acquisition and loss during the evo-lution of flowering plants. Mol. Genet. Genom. 2002, 268, 434–445. [Google Scholar] [CrossRef]
  36. Hu, J.H.; Gui, S.T.; Zhu, Z.X.; Wang, X.; Ke, W.; Ding, Y. Genome-wide identification of SSR and SNP markers based on whole-genome re-sequencing of a Thailand wild sacred Lotus (Nelumbo nucifera). PLoS ONE 2015, 10, e0143765. [Google Scholar] [CrossRef]
  37. Ammiraju, J.S.S.; Zuccolo, A.; Yu, Y.; Song, X.; Piegu, B.; Chevalier, F.; Walling, J.G.; Ma, J.; Talag, J.; Brar, D.S.; et al. Evolutionary dynamics of an ancient retrotransposon family provides insights into evolution of genome size in the genus Oryza. Plant J. 2007, 52, 34. [Google Scholar] [CrossRef]
  38. Han, F.; Qu, Y.; Chen, Y.; Xu, L.; Bi, C. Assembly and comparative analysis of the complete mitochondrial genome of Salix wilsonii using PacBio HiFi sequencing. Front. Plant Sci. 2022, 13, 1031769. [Google Scholar] [CrossRef]
  39. Bi, C.; Qu, Y.; Hou, J.; Wu, K.; Ye, N.; Yin, T. Deciphering the multi-chromosomal mitochondrial genome of Populus simonii. Front. Plant Sci. 2022, 13, 914635. [Google Scholar] [CrossRef]
  40. Timmis, J.N.; Aylife, M.A.; Huang, C.Y.; Martin, W. Endosymbiotic gene transfer: Organelle genomes forge eukaryotic chromosomes. Nat. Rev. Genet. 2004, 5, 123–135. [Google Scholar] [CrossRef]
  41. Cheng, Y.; He, X.; Priyadarshani, S.V.G.N.; Wang, Y.; Ye, L.; Shi, C.; Ye, K.; Zhou, Q.; Luo, Z.; Deng, F.; et al. Assembly and comparative analysis of the complete mitogenomes of Suaeda Glauca. BMC Genom. 2021, 22, 167. [Google Scholar] [CrossRef] [PubMed]
  42. Bi, C.; Paterson, A.H.; Wang, X.; Xu, Y.; Wu, D.; Qu, Y.; Jiang, A.; Ye, Q.; Ye, N. Analysis of the complete mitochondrial genome sequence of the diploid cotton Gossypium raimondii by comparative genomics approaches. Biomed. Res. Int. 2016, 2016, 5040598. [Google Scholar] [CrossRef] [PubMed]
  43. Lu, M.; Zhang, H.S.; An, H.M. Chloroplast DNA-based genetic variation of Rosa roxburghii in Southwest China: Phylogeography and conservation implications. Hortic. Plant J. 2021, 7, 286–294. [Google Scholar] [CrossRef]
  44. Xiong, Y.; Yu, Q.; Xiong, Y.; Zhao, J.; Lei, X.; Liu, L.; Liu, W.; Peng, Y.; Zhang, J.; Li, D. The complete mitogenome of Elymus sibiricus and insights into its evolutionary pattern based on simple repeat sequences of seed plant mitogenomes. Front. Plant Sci. 2022, 12, 802321. [Google Scholar] [CrossRef] [PubMed]
  45. Chan, P.P.; Lowe, T.M. tRNAscan-SE: Searching for tRNA genes in genomic sequences. Methods Mol. Biol. 2019, 1962, 1–14. [Google Scholar]
  46. Li, M.Y.; Zhang, R.; Li, R.; Zheng, K.M.; Xiao, J.C.; Zheng, Y.X. Analyses of chloroplast genome of Eutrema japonicum provide new Insights into the evolution of Eutrema Species. Agronomy 2021, 11, 2546. [Google Scholar] [CrossRef]
Figure 1. Gene map of the complete mitochondrial genome of A. graveolens (A) and A. leptophyllum (B). Genomic characteristics transcribed counter-clockwise are indicated on the inside of the circles. GC content is presented on the inner circle indicated by the dark green plot.
Ijms 24 14615 g001
Figure 2. Relative synonymous codon usage (RSCU) of mitochondrial genomes of A. graveolens and A. leptophyllum.
Ijms 24 14615 g002
Figure 3. Number of repeat sequences in A. graveolens and A. leptophyllum mitochondrial genomes. The horizontal coordinate is the type of scattered repeat sequences and the vertical coordinate is the number of scattered repeat sequences. F: forward repeats; P: palindromic repeats: R: reverse repeats.
Ijms 24 14615 g003
Figure 4. RNA editing sites in different coding genes of A. graveolens and A. leptophyllum.
Ijms 24 14615 g004
Figure 5. Schematic representation of homologous sequences between A. graveolens and A. leptophyllum mitogenomes. (a) Gene blocks shown on the outside and inside the circle were transcribed clockwise and counter-clockwise, respectively. Genes from the same complex are similarly colored. (b) Plastid-derived fragments characterized by the black blocks inlaid in the karyotypes. (c) The GC content in 1000 bp windows. (d) The orange-colored band in the center show links between syntenic blocks among the two mitogenomes.
Ijms 24 14615 g005
Figure 6. Schematic for the chloroplast-to-mitochondrial gene transfer in A. graveolens and A. leptophyllum. (A) Sequence similarity between the mitochondrial and chloroplast genomes in A. graveolens. (B) Sequence similarity between the mitochondrial and chloroplast genomes in A. leptophyllum. Note: The sequences above represent chloroplast sequences, while the sequences below represent mitochondrial sequences. Chloroplast coding sequences (CDS) are shown in green, while mitochondrial CDS are shown in red. Yellow indicates rRNA, blue represents tRNA, and gray represents introns. The green lines connecting regions indicate homologous sequences.
Ijms 24 14615 g006
Figure 7. KaKs substitution rates and Pi values of genes. (A) Analysis of KaKs substitution rates among five Apiaceae species. Ag: A. graveolens; Al: A. leptophyllum; Pg: P. ginseng; Dc: D. carota; Bf: B. falcatum. (B) Nucleotide diversity (Pi) values among A. graveolens and A. leptophyllum.
Ijms 24 14615 g007
Figure 8. Collinearity analysis of the mitochondrial genome of Apiaceae. (A) Analysis of covariance between the mitochondrial sequences of A. graveolens, A. leptophyllum, and near-origin species. The long squares in the figure represent the similarity between genomes, and the connecting lines between the long squares represent the covariance relationship. The short squares denote the gene positions of each genome. Additionally, white represents CDS, green represents tRNA, and red represents rRNA. (B) Dot plot of two celery species with close relatives. Horizontal coordinates in each box represent assembly sequences, vertical coordinates represent other sequences, purple lines in the boxes represent forward comparisons, and blue lines represent reverse complementary comparisons.
Ijms 24 14615 g008
Figure 9. Maximum likelihood (ML) phylogenetic tree based on 31 species. Four colored lines represent four families and their phylogenetic relationships, namely Caryophyllance, Commelinanae, Asteranae, and Rosanae. The remaining species had no color and were classified as outgroups. The green and orange colors on the right represent GC content and mitogenome size, respectively. Numbers beside nodes indicate bootstrap support values.
Ijms 24 14615 g009
Disclaimer/Publisher’s Note: The statements, opinions and data contained in all publications are solely those of the individual author(s) and contributor(s) and not of MDPI and/or the editor(s). MDPI and/or the editor(s) disclaim responsibility for any injury to people or property resulting from any ideas, methods, instructions or products referred to in the content.

