Article

Multiple Factors Influence Seasonal and Interannual Litterfall Production in a Tropical Dry Forest in Mexico

by
Hernán Morffi-Mestre
1,
Gregorio Ángeles-Pérez
2,
Jennifer S. Powers
3,
José Luis Andrade
1,
Astrid Helena Huechacona Ruiz
1,
Filogonio May-Pat
1,
Francisco Chi-May
1 and
Juan Manuel Dupuy
1,*
1
Unidad de Recursos Naturales, Centro de Investigación Científica de Yucatán, Calle 43 # 130 x 32 y 34. Colonia Chuburná de Hidalgo, Mérida, Yucatán 97205, Mexico
2
Colegio de Postgraduados, Campus Montecillo, Carretera México-Texcoco Km. 36.5, Montecillo, Texcoco, Estado de México 56230, Mexico
3
Department of Ecology, Evolution and Behavior, University of Minnesota, 140 Gortner Lab, 1479 Gortner Avenue, Saint Paul, MN 55108, USA
*
Author to whom correspondence should be addressed.
Forests 2020, 11(12), 1241; https://doi.org/10.3390/f11121241
Submission received: 8 October 2020 / Revised: 5 November 2020 / Accepted: 8 November 2020 / Published: 24 November 2020
(This article belongs to the Section Forest Ecology and Management)

Abstract

:
Litterfall production plays a fundamental role in the dynamics and function of tropical forest ecosystems, as it supplies 70–80% of nutrients entering the soil. This process varies annually and seasonally, depending on multiple environmental factors. However, few studies spanning several years have addressed the combined effect of climate variables, successional age, topography, and vegetation structure in tropical dry forests. In this study, we evaluated monthly, seasonal, and annual litterfall production over a five-year period in semideciduous dry forests of different successional ages growing on contrasting topographic conditions (sloping or flat terrain) in Yucatan, Mexico. Its relationship with climate and vegetation structural variables were also analyzed using multiple linear regression and generalized linear models. Litterfall was measured monthly in 12 litterfall traps of 0.5 m2 in three sampling clusters (sets of four 400 m2 sampling plots) established in forests of five successional age classes, 3–5, 10–17, 18–25, 60–79, and >80 years (in the latter two classes either on slopping or on flat terrain), for a total of 15 sampling clusters and 180 litterfall traps. Litterfall production varied between years (negatively correlated with precipitation), seasons (positively correlated with wind speed and maximum temperature), and months (negatively correlated with relative humidity) and was higher in flat than in sloping sites. Litterfall production also increased with successional age until 18–25 years after abandonment, when it attained values similar to those of mature forests. It was positively correlated with the aboveground biomass of deciduous species but negatively correlated with the basal area of evergreen species. Our results show a rapid recovery of litterfall production with successional age of these forests, which may increase with climate changes such as less precipitation, higher temperatures, and higher incidence of hurricanes.

1. Introduction

Litterfall production (amount of plant material that falls to the ground per unit area and time) is a key process of the carbon cycle in terrestrial ecosystems [1,2,3,4,5]. It is the main source of reincorporation of organic nutrients to the soil, where they can be mineralized for plant uptake [6,7,8], as well as an important component of net primary production [9]. Quantifying litterfall production is a necessary step to estimate productivity and evaluate phenology, carbon dynamics, biogeochemical cycles, and the capacity of forests to recover from natural and human disturbances [10]. Moreover, identifying the factors that govern litterfall production can help us to better understand the response of forest ecosystems to climate change [11,12]. Most studies on litterfall production in tropical forests have been conducted in humid forests, while fewer have addressed tropical dry forests (TDF) [13], although the latter cover a greater extent and are more threatened by human activities [13,14].
Litterfall production in TDF occurs mostly in the dry season, as a strategy to avoid water loss by transpiration and cope with water stress—low soil water availability and high vapor-pressure deficit [15,16,17,18]. Therefore, litterfall production in TDF is negatively correlated with annual, seasonal, and monthly precipitation [16,19,20,21,22,23]. However, most studies conducted to date on litterfall production in TDF have been short-term [24,25], but see [26,27,28], which limit the possibility of evaluating, modeling, and predicting the effects of climate change. The few multi-year studies of litterfall production in TDF and its relationship with precipitation [29] have documented several patterns of monthly litterfall production with one, two, or irregular peaks at different times of the year [16,19], mostly associated with scarce or nil precipitation [16,19,30].
Other climatic factors shown to be (positively) correlated with litterfall production in tropical forests include temperature [24,31], wind speed [15,32], and solar radiation [33], which, together with drought, are closely related to the abscission of leaves—the main component of plant litter. Therefore, the temporal patterns of leaf abscission govern the variations in litterfall production both between and within ecosystems [19,34].
Litterfall production is also related to species composition and vegetation structure [35,36,37], which change over the course of forest succession [38,39,40,41]. Litterfall production increases during succession as tree size, aboveground biomass, and leaf area index increase as a result of changes in microenvironmental conditions [15,40,42] and the life history strategies of species [43,44,45,46,47]. Environmental conditions such as high solar radiation, high temperature, and low water availability in the uppermost layers of the soil prevail during the early successional stages in TDFs. Species with strategies that allow for conserving acquired and allocated resources (e.g., evergreen, long-lived leaves) tend to predominate under such conditions, while species with strategies that maximize resource acquisition when they are in high availability (e.g., deciduous, short-lived leaves) tend to predominate in later successional stages, when environmental conditions become less restrictive [40,42,48,49]. However, some authors have reported an inverse successional pattern in TDF: predominance of plants with acquisitive strategies in early successional stages, which are then replaced by species with conservative strategies in later stages [50,51,52]. Such conflicting behaviors suggest that plant species in TDF possess a wide range of strategies to cope with drought.
Litterfall production is also influenced by landscape topography, as the latter affects incident solar radiation and soil water availability and, thus, plant phenology [35,53,54,55,56,57]. For instance, sites located on hilltops or hill slopes have shallower soils with lower water retention capacity, compared with sites located on flat areas [54,58,59]. Accordingly, species with conservative strategies (evergreen, slow-growing, with long-lived leaves) have been reported to predominate in sites located on hill slopes [50], where litterfall production is lower than on flat sites [27]. However, other studies [53,60] have reported the opposite pattern: a higher abundance of evergreen species on flat vs. sloping sites, which would lead to an opposite pattern of litterfall.
To the best of our knowledge, this is the first study that evaluates the influence of multiple factors (successional age, vegetation structure, topography, and climatic variables) on monthly, seasonal, and interannual litterfall production patterns in a TDF. We had three objectives: (a) to analyze the temporal (interannual, seasonal, and monthly) dynamics of litterfall production; (b) to evaluate the effects of successional age and topography on annual and seasonal litterfall production; and (c) to examine the relationships of seasonal and annual litterfall production with vegetation structure and climatic variables. We posit three hypotheses: (1) given that aboveground biomass and, likely, the proportion of deciduous species in TDF increase with successional age, we expect litterfall production to also increase with successional age and to be positively correlated with aboveground biomass or basal area (particularly of deciduous species); (2) since lower water availability in sloping sites leads to a predominance of drought-tolerant species (evergreen species with long-lived leaves and long roots), we expect litterfall production to be lower on sloping versus flat sites; (3) since litterfall production in TDF is correlated with periods of water stress, we expect a negative correlation with monthly, seasonal, and annual precipitation and a positive correlation with maximum temperature and vapor-pressure deficit.

2. Materials and Methods

2.1. Study Area

The study area is located in Kaxil Kiuic Biocultural Reserve and its surroundings (20°5′ 20°7′ N; 89°32′ 89°34′ W), at the central part of the Yucatán Peninsula (Figure 1a). The reserve stretches across 1800 ha, mostly covered by semi-deciduous tropical dry forest.
The local climate is warm subhumid (Aw), with mean annual temperature of 26 °C and mean annual precipitation of 1000–1200 mm [61]. The rainy season lasts from May to October and accounts for over three quarters of the total annual precipitation (763–916 mm), whereas the dry season lasts from November to April and contributes only 237–284 mm. The geomorphology of the region consists of karstic limestone, with flat areas alternating with gently sloping hills (10–25%). Cambisol and luvisol soils predominate in flat areas, and leptosol soils on hills and sites with rocky outcrops [62]. Secondary vegetation of different ages since abandonment predominates in the region as a result of the long-standing use of slash-and-burn subsistence agriculture [63,64]. The dominant vegetation is a medium-stature semideciduous tropical forest, in which 50–75% of the trees shed their leaves during the dry season and canopy height is 13–18 m in late successional forests. The most abundant tree species include Neomillspaughia emarginata (H. Gross) S.F. Blake and Gymnopodium floribundum Rolfe. (Polygonaceae), Lonchocarpus xuul Lundell, Mimosa bahamensis Benth. and Caesalpinia gaumeri Greenm (Fabaceae), and Bursera simaruba (L.) Sarg. (Burseraceae), among others.

2.2. Selection of Sampling Sites

The sampling design was based on the one used by the National Forest and Soil Inventory of Mexico [65], which consists of 1-ha sampling clusters of four 0.04-ha (400 m2) plots arranged in an inverted Y shape (Figure 1b,c). Three sampling clusters were established in forests of five successional age classes (years since abandonment from cultivation at the beginning of this study), I: 3–5, II: 10–17, III: 18–25, IV: 60–79, and V: ≥80 years, for a total of 15 sampling clusters and 60 plots (Appendix A). Sampling clusters in age classes I–III were selected to form a chronosequence of stands of different successional age on predominantly flat terrain (the prime land for farming activities). Sampling clusters in age classes IV and V were established following a stratified systematic design irrespective of topographic position, which varied among plots in each cluster. Thus, the effect of topography was assessed only in clusters in age classes IV and V. From these clusters, we used only those plots located on the predominant topographic position (flat (0–9% slope) or sloping (10–20% slope) terrain), including three plots from each of the three clusters for each topographic position (Appendix A).

2.3. Estimation of Litterfall Production

Litterfall production was measured over five years in a total of 180 litterfall traps (12 per sampling cluster). Three litterfall traps were established in each sampling plot, 6 m from the center, along three compass directions (north, east, and west) (Figure 1c). We used 80-cm-diameter (0.503 m2) circular traps made of fine, 1-mm mesh plastic net to allow rainwater to escape while retaining fine plant material; the traps were placed 80 cm above the ground. Litterfall (leaves, twigs, bark, flowers, fruits, seeds, and frass) was collected monthly, as recommended by Aceñolaza et al. [66], from October 2013 to September 2018. The litter samples were dried at 70 °C to constant weight and weighed using an analytical balance. The monthly litterfall production rate (P; Mg/ha/month) was estimated using the following equation (modified from Honorio and Baker, [67]):
P = Total   dry   weight   in   each   litterfall   trap ( g ) × 10 8   cm 2 × 30   days × 1   Mg Area   of   the   litterfall   trap ( 503.56   cm 2 ) × collection   duration   ( days ) × 1   ha × 1   month × 10 6   g

2.4. Climatic Variables

Climatic data were obtained from the weather station of the nearest town, Oxkutzcab, located 27.4 km from the study site and operated by the Comisión Nacional del Agua (National Water Commission). Data on monthly precipitation (mm), mean, maximum, and minimum air temperature (°C), relative air humidity (%), wind speed (km/h), and wind gusts (km/h) were recorded every 10 min over the entire study period by the automatic weather station. Cumulative temperature values were calculated from daily maximum and minimum temperature values recorded by a conventional weather station at the same site; the daily values were added up to obtain monthly cumulative maximum and minimum temperatures (ACTmax and ACTmin, respectively). Vapor-pressure deficit (δe) was estimated after the equations proposed by Jones [68].

2.5. Measurement and Estimation of Vegetation Variables

All woody plants (trees, shrubs, lianas, and palms) with DBH (diameter at breast height, measured at 1.3 m above the ground) ≥ 7.5 cm present in all the plots where litterfall production was monitored were censused from 2013 to 2016 and in 2018 (2465 plants in total). Plants with DBH ≥ 2.5 cm were sampled in 80 m2 subplots nested in the center of each 400 m2 plot (2660 plants in total). Each plant was identified to species (see the complete species list in Appendix B), and the diameter and height of each stem were measured. Sample specimens of those plants that could not be identified in the field were collected and taken to the herbarium of the Centro de Investigación Científica de Yucatán for identification.
Aboveground biomass was estimated using allometric equations either developed or used in previous studies on forests of the Yucatán Peninsula. We used the equation of Ramírez-Ramírez et al. [69] for trees with DBH < 10 cm, and the equation of Chave et al. [70] for larger trees. All plant species recorded in each plot were classified according to their leaf phenology (deciduous vs. evergreen) based on specialized literature [71,72] as well as on the knowledge of local inhabitants and one of the co-authors (F May-Pat). Basal area, aboveground biomass, and stem density in each plot were calculated for all species as well as for evergreen and deciduous species separately.

2.6. Data Analysis

Each cluster was regarded as a sampling unit; the litterfall production values of the 12 litterfall traps in each sampling cluster (three traps × four 400 m2 plots) were averaged. As indicated above, the effect of topographic position was evaluated based on the mean value of the three plots located on the predominant topographic position in the cluster. All sampling clusters were separated by at least 250 m; the spatial independence of the data was tested separately for each study year using Moran’s Index (I) [73] implemented in the spatial autocorrelation tool of ArcMap 10.2 or Qgis 3.0 [74,75]. No spatial autocorrelation was found in any year (I ≥ −0.216, Z ≥ −0.725, p ≥ 0.468).
Generalized linear mixed models (GLMM) were used, followed by Bonferroni post-hoc multiple comparison tests, to test for significant differences in the temporal (annual, seasonal, and monthly) litterfall production patterns between successional age classes or topographic positions. These analyses were carried out using the software SPSS v.17.0 [76].
The relationships between litterfall production and climatic or vegetation variables were examined by fitting multiple linear regression models using the regsubsets procedure in the “leaps” package in R (3.5.0) [77]. Annual and monthly averages of the climatic variables (over the entire study period) were used for these analyses, except for precipitation, for which the cumulative value was used. As vegetation variables were recorded only annually (except for 2017), climatic and vegetation variables (including successional age) were analyzed separately.
For each multiple regression analysis, the three best models identified by the regsubset procedure were considered and the best model was selected based on the Akaike information criterion (AIC). Akaike delta scores (∆ AIC, relative difference between the AIC of the best model and that of each other model) and Akaike weights (ωi) [78] were calculated for the three selected models. We checked for multicollinearity among the explanatory variables based on the variance inflation factor (VIF). The best model for each case was the one yielding the lowest ∆ AIC and the highest ωi [79,80], provided it included neither non-significant explanatory variables nor high multicollinearity (VIF ≥ 2).

3. Results

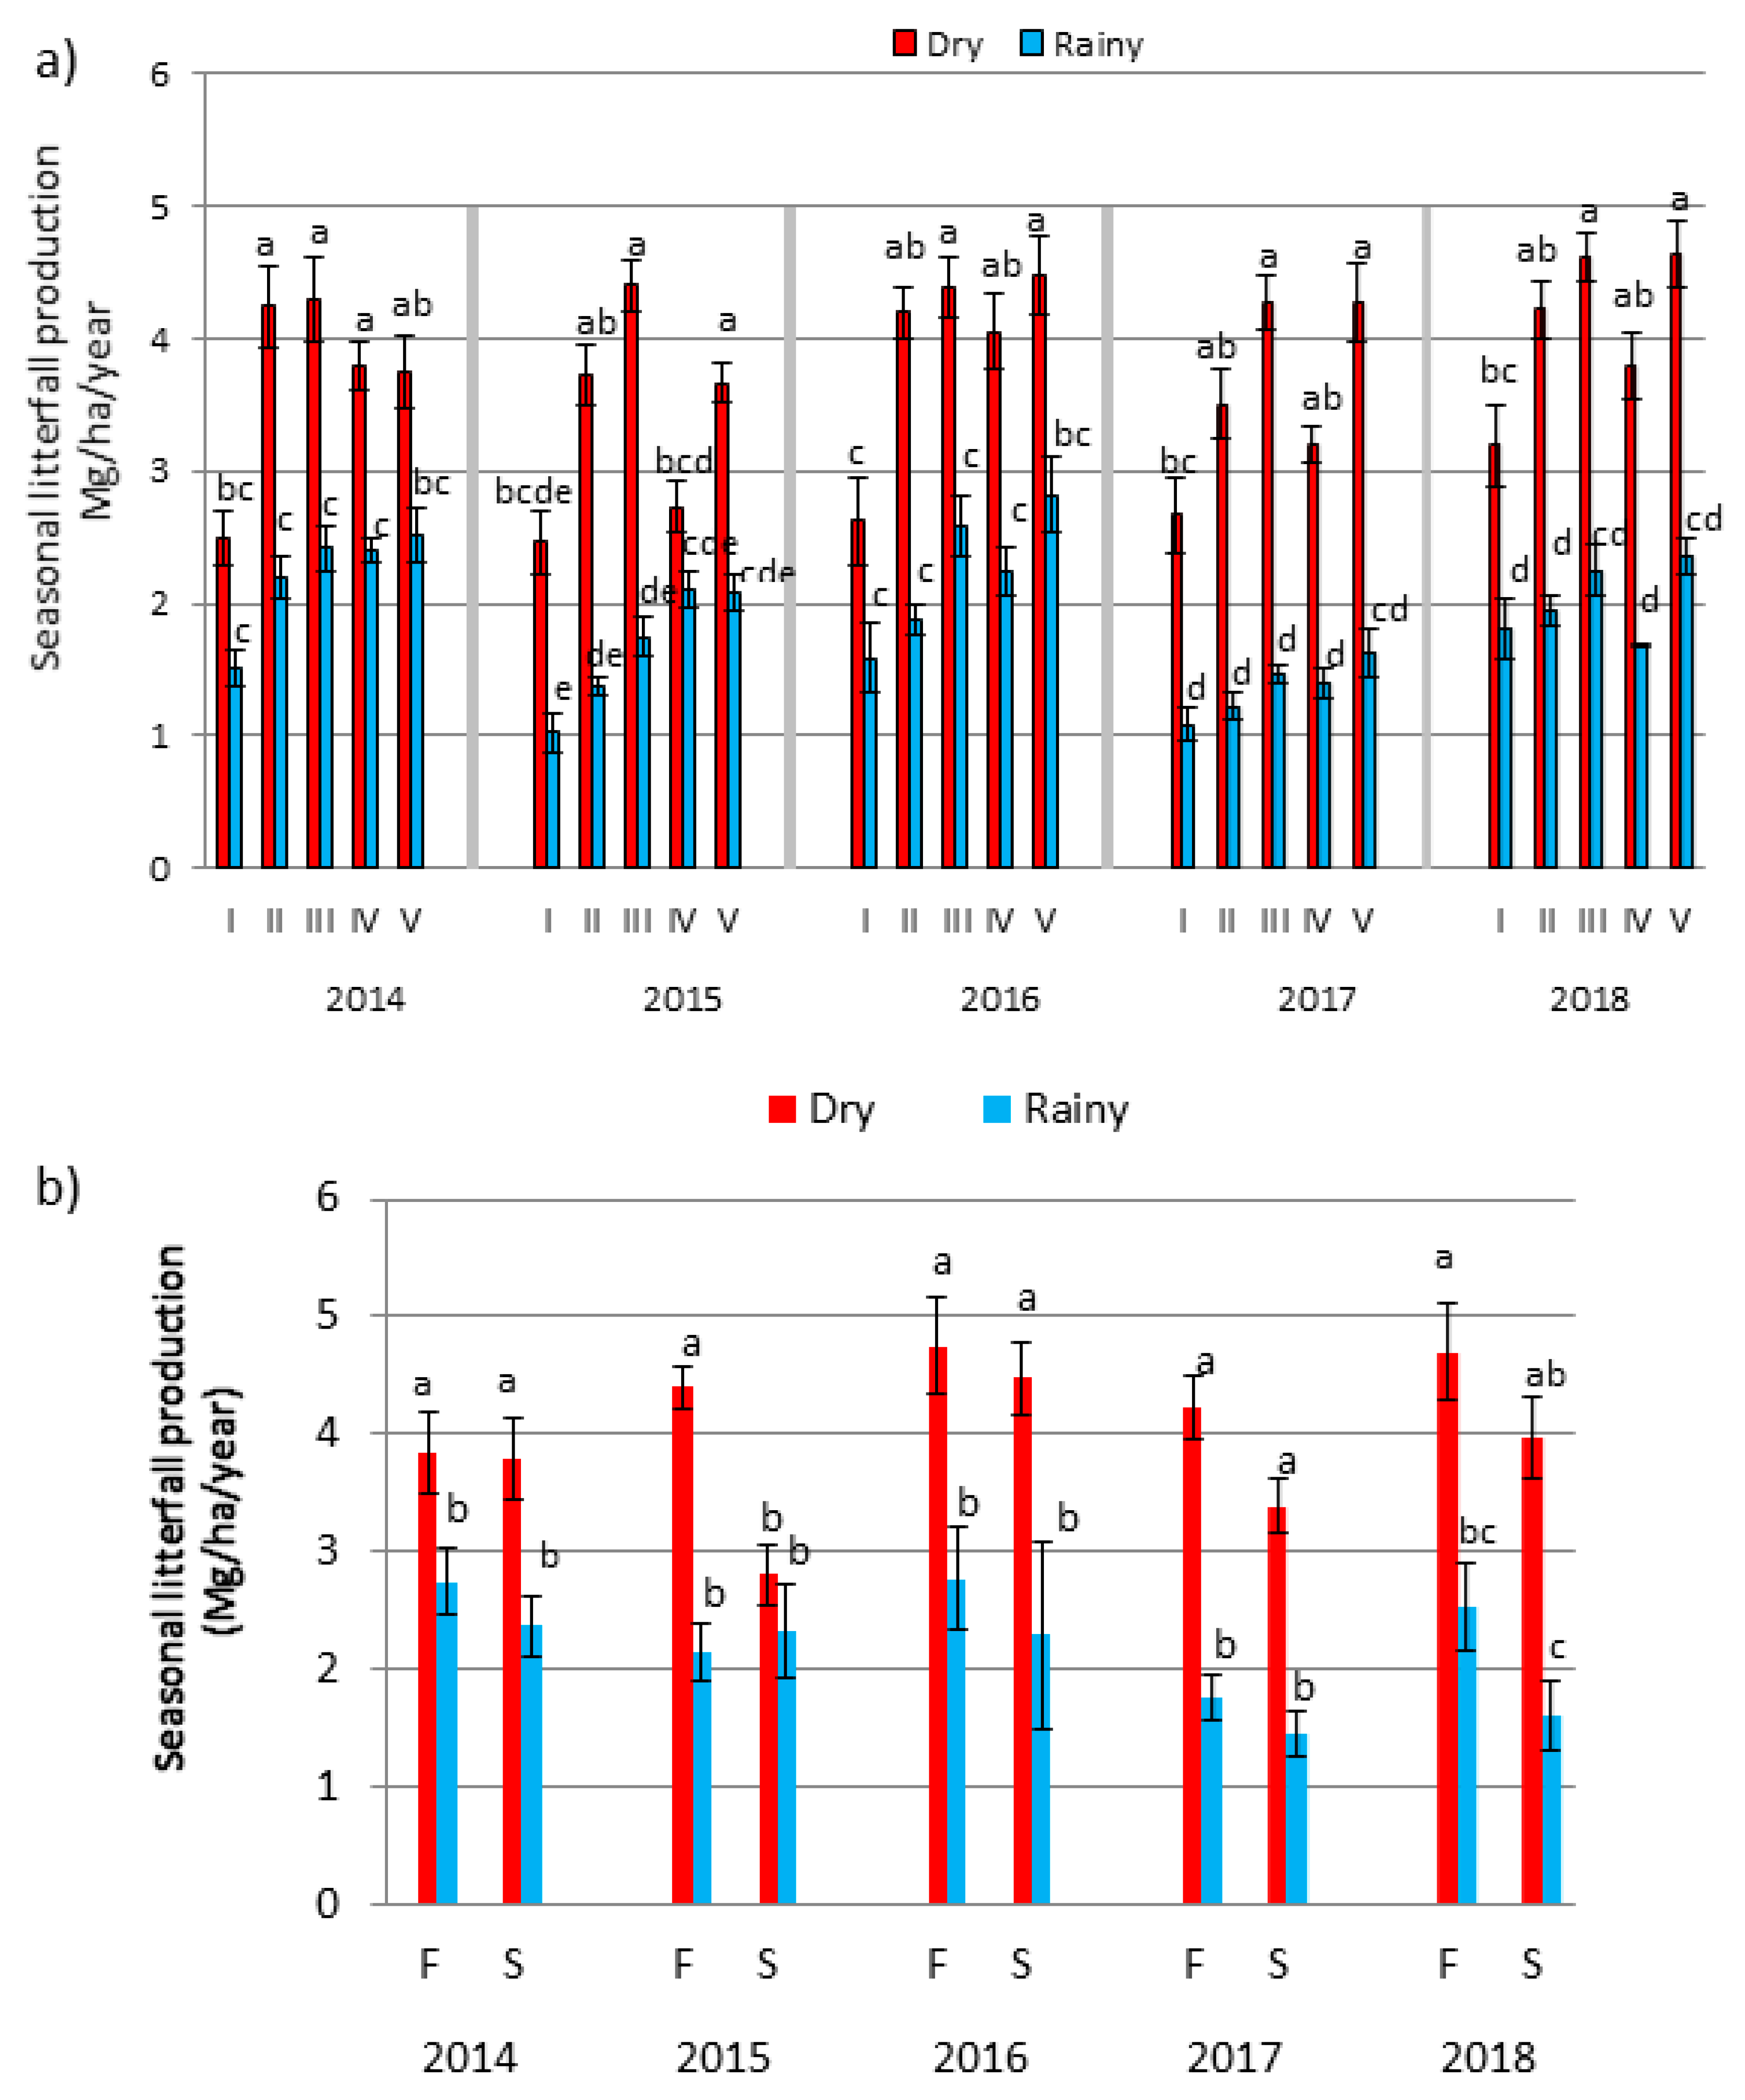
3.1. Total Annual Litterfall Production

Average annual litterfall production ± 95% confidence interval was 5.651 ± 0.266 Mg/ha/year; annual production varied among the study years (F = 43.047; p < 0.001), with the highest value recorded in 2016 (6.173 ± 0.654 Mg/ha/year) and the lowest in 2017 (4.941 ± 0.502 Mg/ha/year) (Table 1). The highest annual production (2016) coincided with the lowest annual precipitation of the study period; however, the lowest annual production (observed in 2017) coincided with a similarly low annual precipitation (the second lowest of the study period).

3.2. Influence of Successional Age and Topography on Inter-Annual Litterfall Production

Litterfall production varied significantly among successional age classes over the entire study period (F = 49.863, p < 0.001) (Table 2), as well as within years (F ≥ 12.595, p < 0.001 in all study years) (Figure 2). Although litterfall production varied widely among years, the lowest values were consistently recorded in forest age class I (3–5 years), whereas the highest values were observed in forest age class III (18–25 years) and/or V (≥80 years) (Figure 2).
Litterfall production also differed between topographic positions over the entire study period (F = 4.660, p = 0.042), as well as in 2015 (F = 22.39, p <0.001), but not in other years (F ≥ 0.277; p ≥ 0.067). Over the study period (and in 2015), litterfall production was higher (mean ± 95% CI) in flat (2.634 ± 0.321 Mg/ha/year) than in sloping sites (2.196 ± 0.244 Mg/ha/year).

3.3. Relationships between Litterfall Production and Vegetation Variables

The best multiple linear regression model over the study period explained 60.8% of the variation in total litterfall production. Litterfall production over the study period was positively correlated with aboveground biomass of deciduous species and negatively correlated with basal area of evergreen species (F = 11.87, p = 0.0014) (Table 3). The vegetation variables most closely related to annual litterfall production varied among years and included average tree height (positive correlation), biomass of evergreen species (negative correlation), basal area of deciduous species (positive), successional age (positive), and mean tree diameter (positive) (Table 3).

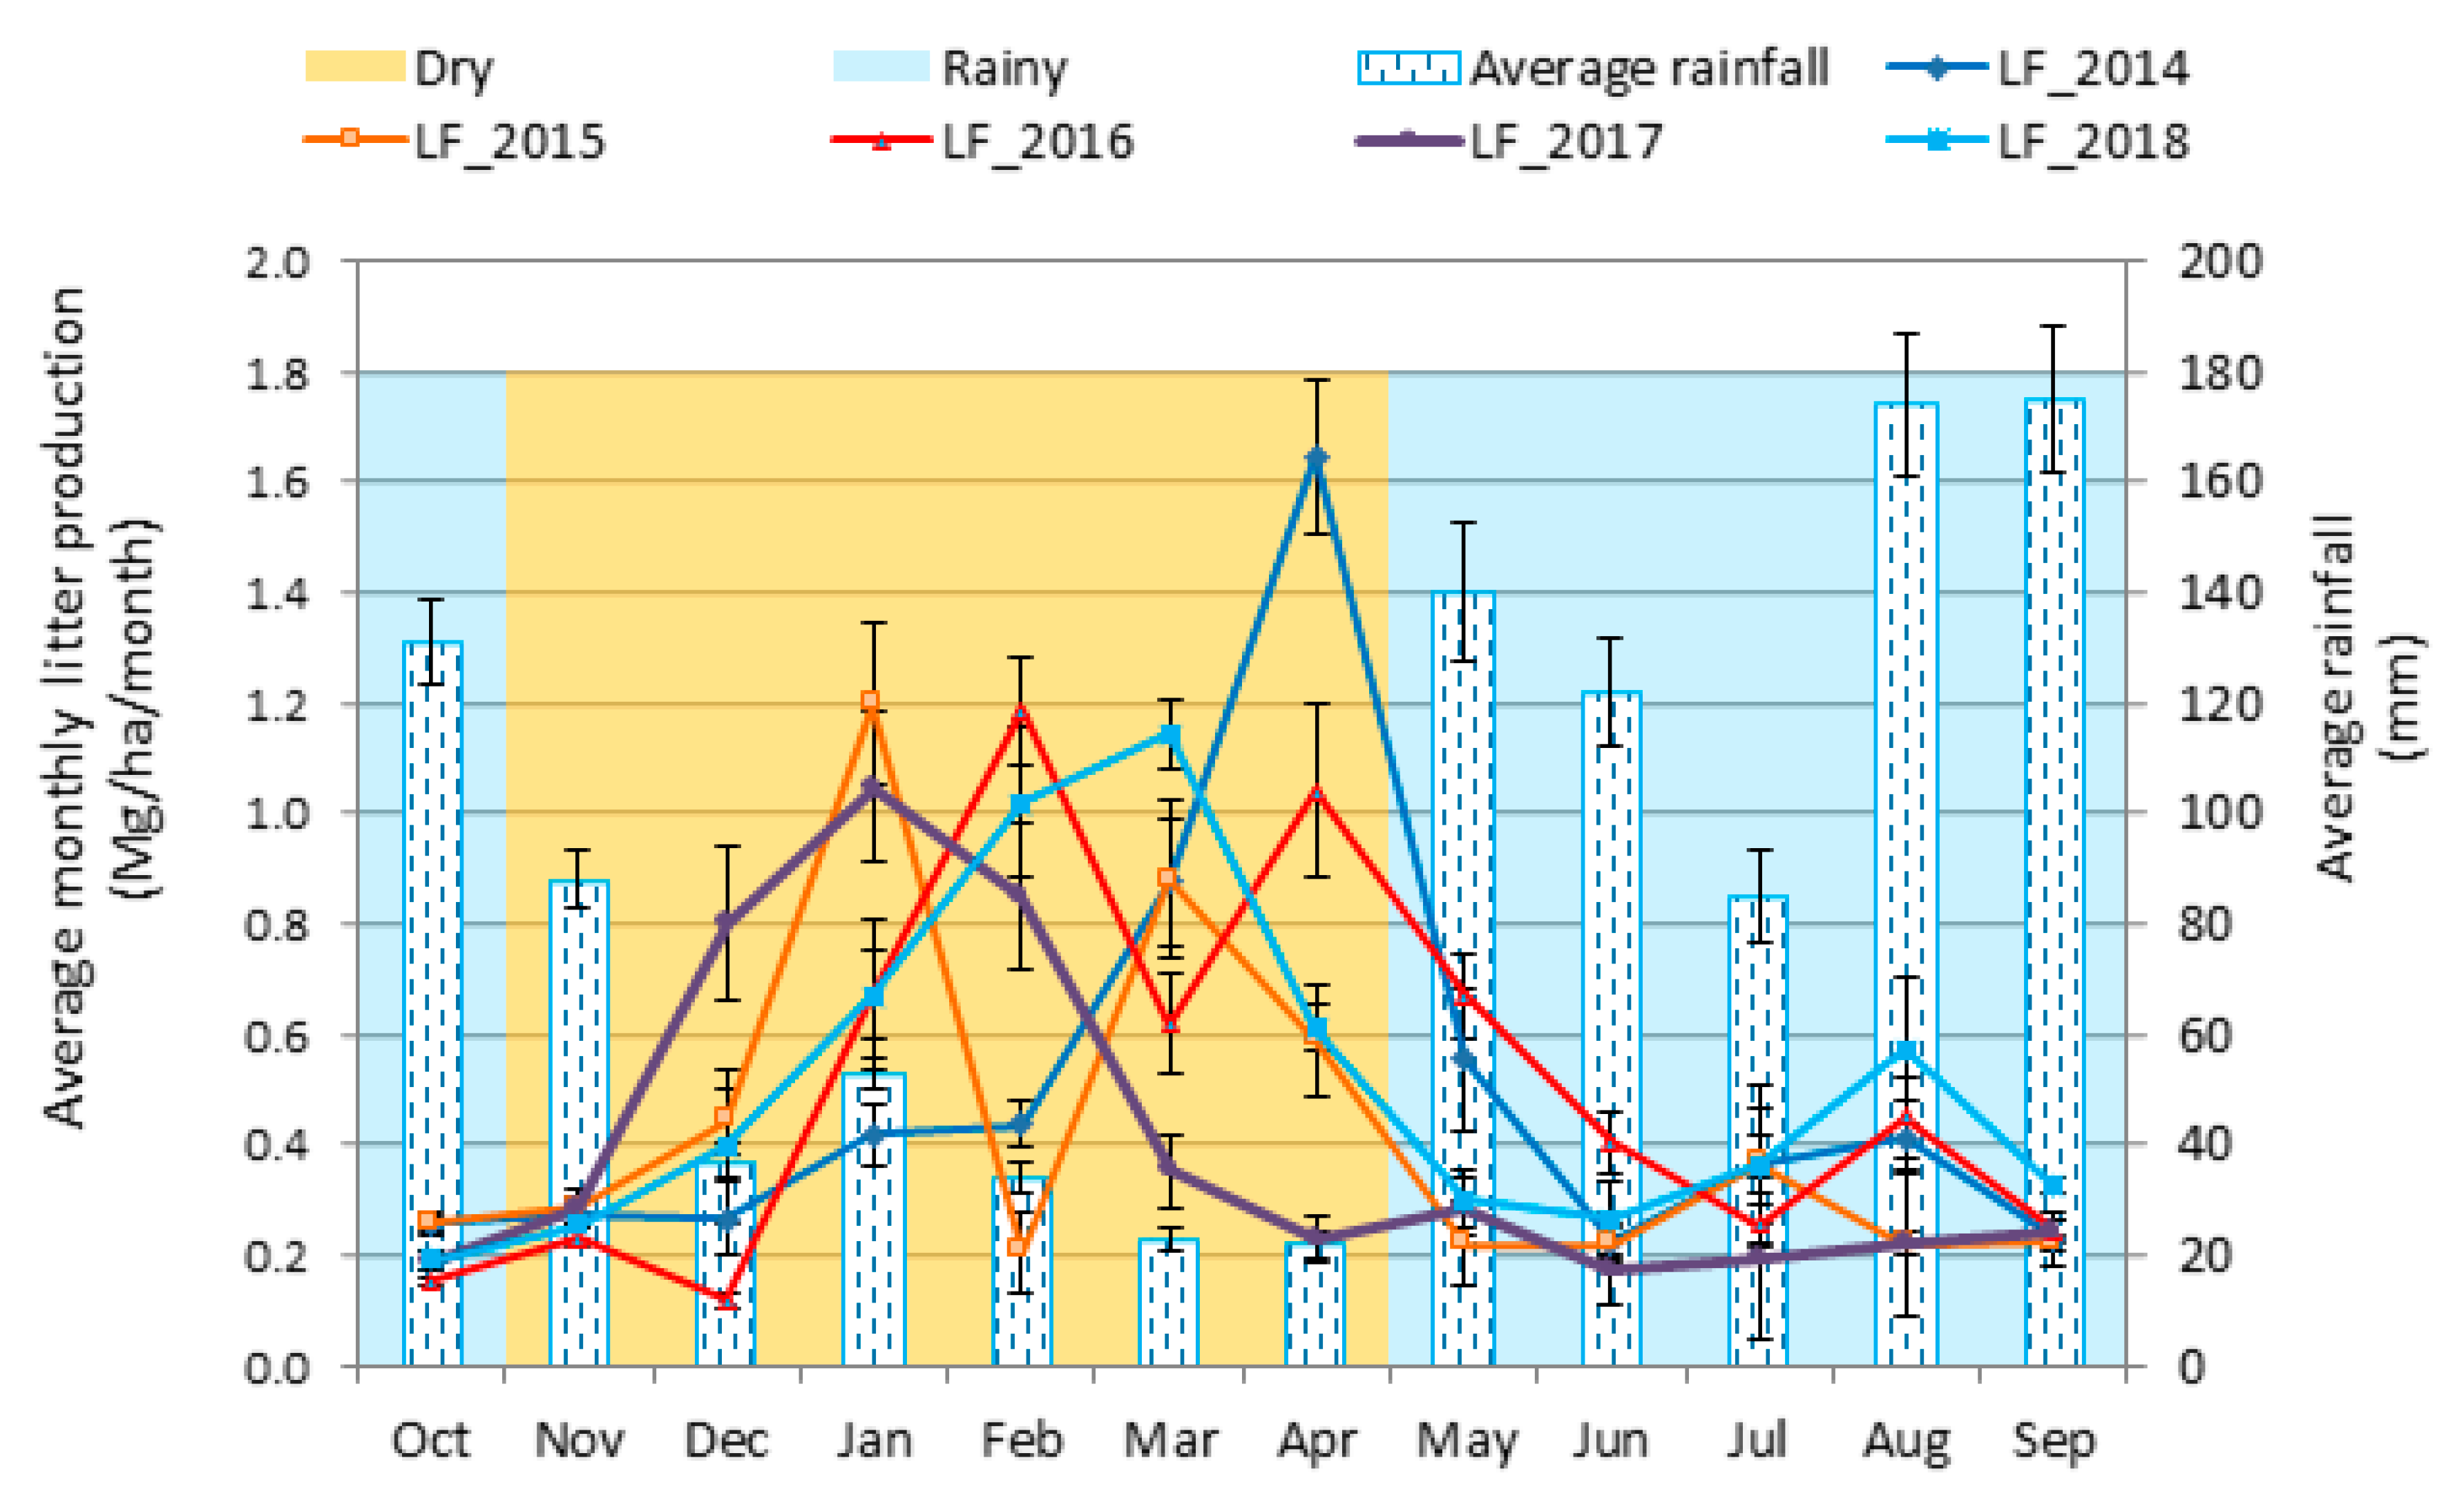
3.4. Seasonal Dynamics of Litterfall Production

Litterfall production was significantly higher (mean ± 95% CI) in the dry (3.036 ± 0.387 Mg/ha/year) than in the rainy season (1.794 ± 0.209 Mg/ha/year) over the entire study period (F = 28.55, p < 0.001), as well as in most years (F ≥ 10.209, p ≤ 0.004), except for 2014 (F = 3.769, p = 0.06). Litterfall production in the dry season accounted for between a low of 57.5% (in 2014) and a high of 77.5% (in 2018) of total annual litterfall production.
Litterfall production was consistently higher in the dry than in the rainy season in the five years across the different successional age classes (Figure 3a) and in the two topographic positions considered, except for sloping sites in 2015 (Figure 3b). There were significant interaction effects between seasons and age classes (F ≥ 5.906; p < 0.001 in all study years) as successional patterns differed between seasons (Figure 3a) but not between seasons and topographic positions (F = 0.336; p ≥ 0.173 in all years), except for 2015 (F = 30.975; p < 0.001) (Figure 3b).

3.5. Temporal Variation in Litterfall Production and Its Relationship with Climatic Variables

Average monthly litterfall production varied significantly among years (F = 13.64; p < 0.001 in all cases) (Figure 4). The highest average monthly production (mean ± 95% CI) was recorded in 2018 (0.509 ± 0.174 Mg/ha/month) and the lowest in 2017 (0.410 ± 0.172 Mg/ha/month). The overall pattern of monthly litterfall production varied among years, being unimodal in 2014 and 2017 and bimodal in 2015, 2016, and 2018. Peak values were recorded in April 2014, January and March 2015, February and April 2016, January 2017, and March 2018 (Figure 4).
Over the whole study period, annual litterfall production was negatively related to annual precipitation (which accounted for 94.4% of the total variation), whereas seasonal litterfall production was positively related to wind speed and the cumulative maximum temperature, which jointly accounted for 87.4% of the total variation (Table 4).
The model that best described monthly litterfall production over the entire study period included relative humidity as the only explanatory variable, which was negatively related to the response variable (Table 5). The climatic variables most closely related to monthly litterfall production varied between years but often included maximum, minimum, or mean temperature. No significant relationships were found between monthly litterfall production in 2015 and any of the climatic variables analyzed.

4. Discussion

The goal of this study was to assess how forest successional age, topography, vegetation structure, and climatic variables influence seasonal and interannual variations in litterfall production over a five-year period in a tropical dry forest (TDF). We expected litterfall production (1) to increase with successional age associated with basal area or aboveground biomass of deciduous species; (2) to be higher on flat than on sloping sites; and (3) to be negatively associated with precipitation and positively with maximum temperature and vapor-pressure deficit across months, seasons, and years. Our results showed large annual, seasonal, and monthly variations in litterfall production, which were related to various environmental factors including precipitation (negative correlation), wind speed (positive correlation), and maximum temperature (mostly positive correlation). As expected, litter production was higher in the dry versus rainy season and on flat versus sloping sites (overall, but not in most years); also, litter production increased with successional age and was positively correlated with aboveground biomass of deciduous species but negatively correlated with basal area of evergreen species. Below, we discuss our results in detail in light of the proposed hypotheses and relate them to previous findings as well as to predicted trends of climate change.

4.1. Annual Litterfall Production

Annual litterfall production ranged between 4.94 and 6.17 Mg/ha/year, with an average value of 5.65 Mg/ha/year. These values are well within the range (3.8–7.70 Mg/ha/year) reported by previous studies in TDF [16,21,25,27,28,81] (Appendix C). Souza et al. [81] studied TDFs of different successional ages in Brazil and reported litterfall production values lower (4.0–4.5 Mg/ha/year) than those found in our study. In contrast, Martínez-Yrízar and Sarukhan [27] reported higher values (6.5 Mg/ha/year) for a mature dry forest in Jalisco, Mexico.

4.2. Influence of Successional Age and Vegetation Structure on Litterfall Production

Our results partially supported hypothesis 1. As expected, litterfall production increased with successional age, being lower in the youngest age class, where vegetation structure is still poorly developed. However, and contrary to our expectations, litterfall production in age class IV (60–79 years) was lower than in age classes III (18–25 years) and V (≥80 years), which generally did not differ from each other. Average values of total aboveground biomass (14.5 Mg/ha), tree height (4.59 m), stem diameter (5.85 cm), and total basal area (6.21 m2/ha) were also lower in age class I (3–5 years) than in the older classes (F ≥ 6.816; p ≤ 0.006 in all cases), and most of these variables did not differ between age classes III to V (≥18 years)—see also [82]. Lawrence [21] found no significant differences in litterfall production between 12 to 25-year-old and mature tropical forests in the Yucatan Peninsula.
These results evidence a rapid increase in structural variables and litterfall production during the first 25 years of succession. This is consistent with findings from previous studies [46,83,84] and suggests that the structure of TDF can recover rapidly, likely due to the low structural complexity of these forests [46]. These results also indicate that successional age has a marked effect on litterfall production, as reported in other studies on tropical forests [16,21,81,85]. Other factors that might also explain the rapid recovery of litterfall production in our study site include its high soil fertility [47,63] and low intensity of land use associated with traditional slash-and-burn agriculture.
Annual litterfall production was positively related to the aboveground biomass of deciduous species (which account for 57.3–83.8% of the total basal area) and negatively related to the basal area of evergreen species. This indicates that the phenological strategy of plants in this seasonally dry tropical forest had a major and differential effect on litterfall production. Deciduous species characteristically exhibit a water-stress avoidance strategy consisting of shedding their leaves during the dry season (and, in some cases, storing water in stems and roots) to reduce water loss by transpiration and to avoid cavitation [86,87,88,89]. The leaves of these species generally show photosynthetic rates and nitrogen contents higher than those of evergreen species [51,87,88,89]. Thus, our results suggest that the rapid recovery of litterfall production during secondary succession in these forests might have a synergistic effect on the recovery of soil fertility through the supply of litter from deciduous species (especially legume species), which have high foliar nitrogen contents and low C/N ratios that favor rapid litter decomposition [26,90,91].
On the other hand, the low litterfall production values recorded in successional age class IV (60–79 years) compared to those in age classes III (18–25 years) and V (≥80 years) were unexpected, especially since vegetation structure did not differ substantially among age classes III–V, as mentioned above. This unexpected result suggests a lower net primary productivity in age class IV compared to that in classes III and V, likely related to a negative net balance in the demographic processes underlying the gain (recruitment and growth) and loss (mortality) of biomass. Estimating demographic rates is beyond the scope of our study; however, we obtained preliminary estimates of the net balance between the number of plants that recruited and those that died over the entire study period in age classes III, IV, and V. Although the net balance was negative (deaths > recruits) in the three age classes, there were significant differences between them (F = 3.572; p = 0.037), being more negative in age class IV (−236 plants) than in age classes III and V (−178 and −112 plants, respectively). Future studies should address the demographic processes as well as the plant life-history strategies and functional traits underpinning these patterns.

4.3. Influence of Topography and Vegetation Structure on Litterfall Production

Our results partially supported hypothesis 2. As expected, litterfall production was significantly higher on flat than on sloping sites over the entire study period. However, significant differences between topographic positions were found only in one of the five years of the study. These results demonstrate the importance of conducting multi-year studies to identify overall patterns beyond the interannual variations that are common in seasonally dry tropical forests. In another multi-year study of a TDF on the Pacific coast of Mexico, Martínez-Yrízar and Sarukhán [27] also found litterfall production to be higher on flat than on sloping sites.
Previous studies on TDFs in the Yucatán Peninsula [63,82,92,93] reported higher tree height, aboveground biomass, and basal area, but lower tree density, on flat versus sloping sites. Exploratory analyses carried out as part of our study showed that biomass, basal area, and stem density of deciduous species were higher on flat than on sloping sites (F ≥ 9.509, p ≤ 0.037). Flat sites provide more favorable conditions for vegetation development since they have deeper soils than sloping sites [62]. Besides the above, runoff and erosion take away water, mineral nutrients, and soil particles from sloping sites and deposit them on flat sites at the bottom. More favorable microenvironmental conditions on flat sites would favor the establishment of deciduous species, which often show acquisitive strategies that require a high availability of soil resources. Sanaphre et al. [50] found a higher proportion of deciduous species on flat areas and of evergreen species on sloping sites, within the same study area. A higher proportion of evergreen species may entail a lower litterfall production on sloping sites. However, Nafarrate-Hecht et al. [94] and Huechacona-Ruíz [15] found no significant effects of topography on leaf area index or litterfall production, respectively, in the same study area. More detailed studies would be necessary to elucidate the causes underlying these contrasting litterfall production patterns in flat vs. sloping sites. Such studies should examine the factors that co-vary with slope, such as water availability and soil properties, as well as other key factors such as slope aspect and the proportion of deciduous/evergreen species.

4.4. Temporal Variation in Litterfall Production and Its Relationship with Climatic Variables

Our results partially supported hypothesis 3, namely that temporal variations in litterfall production would be negatively correlated with precipitation and positively with maximum temperature and vapor-pressure deficit (VPD). Annual litterfall production was indeed negatively correlated with precipitation, while seasonal production was positively related to maximum temperature (Table 4). However, seasonal and monthly litterfall production were also related to other climatic variables. For instance, seasonal litterfall production was positively correlated with wind speed (Table 4), while monthly litterfall production was related overall to relative humidity (negative correlation) and, in some years, to minimum or mean temperature—negative correlations (Table 5).
As expected, litterfall production was higher in the dry season and was related to low values of precipitation and high values of VPD and maximum temperature, i.e., to limiting conditions for photosynthesis and other metabolic processes. Under these circumstances, most plants in this type of forest respond by shedding their leaves to avoid water loss by transpiration and cope with water stress [18,53,95,96]. Moreover, wind causes additional shedding of leaves and branches, reduces relative humidity, and causes the soil to dry out (especially at high temperatures), leading to a high VPD [97,98]. Previous studies have documented that litterfall production during the dry season may account for 25 to 100% of total annual production [20,85,99,100,101]. In our study, litterfall production during the dry season accounted for 67.5% of the total production (over the entire study period), with annual values ranging between 57.5 and 77.5%. These values are similar to those reported by Aryal et al. [16], who documented that dry season production accounted for 70% of the total annual litterfall production in Calakmul, south of the Yucatán Peninsula, Mexico.
Average monthly litterfall production over the study period was 0.460 Mg/ha/month and was negatively related to relative humidity. However, the influence of climatic factors varied among years, with maximum (positive or negative correlation) and minimum temperature (negative correlation) being the variables most closely related to average monthly litterfall production. These results show that monthly litterfall production is influenced by small variations in temperature, precipitation, and other climatic variables including VPD (and possibly solar radiation), as reported in previous studies [16,19,25,27,29,30].
Climate change models for the period 2010 to 2039 project a >2 °C increase in mean annual temperature, more intense and longer droughts, a slight decrease in annual precipitation, and more frequent and intense tropical storms and hurricanes for Mexico under the A2 emissions scenario, which assumes large regional differences in economic and population growth [102]. Based on the relationships between litterfall production and climatic variables considered in our study, under this climate change scenario, an increase in both the proportion of deciduous species and litterfall production would be expected in the TDF that we examined, but not necessarily in the rate of litter decomposition, due to the likely adverse effects of the altered environmental conditions on decomposers.
On the other hand, increased rates of forest disturbance due to logging, land use change, extractive activities, and forest fires are also projected [103,104,105,106]. This would lead to forest cover loss, especially of older successional forests (which are commonly targeted by human activities), and an increase in the proportion of young secondary or disturbed forests, all of which would lead to lower litterfall production and decomposition—likely overriding potential climate-change-driven increases in litterfall production. Given these scenarios, there is an urgent need to document the temporal changes in the various components of primary productivity and in the biogeochemical cycles related to litterfall production and decomposition, as well as their relationships with climatic variables and environmental conditions.

5. Conclusions

As we expected, successional age, seasonality, and topography (slope) are drivers of litterfall production. This production was higher in the dry season, increased with successional age (recovering in just 18–25 years), and was positively correlated with the aboveground biomass of deciduous species and negatively with the basal area of evergreen species. This suggests that the nutrients contained in litter are recycled rapidly in this landscape, which consists of a matrix of TDF interspersed with low-intensity land uses.
Litterfall production over the entire study period was higher on flat versus sloping sites, as environmental conditions in the latter are less favorable for vegetation development. Protecting and conserving forests on sloping areas should be prioritized in order to reduce erosion and soil degradation.
The temporal patterns of litterfall production were related to several climatic variables including precipitation (negative correlation), maximum temperature, wind speed, and VPD (positive correlations). This suggests that litterfall production (but not necessarily its decomposition rate) might increase with climate change. However, land use changes would reduce litterfall production and decomposition, impairing the capability of TDF to sequester and store carbon and compromising the biogeochemical cycles that regulate the long-term sustainability of these ecosystems and the services they provide to human societies. Further multi-year studies such as the one reported here are necessary to broaden our understanding of the dynamics and functioning of tropical dry forests and to inform the design of more effective strategies for their conservation, restoration, and sustainable management.

Author Contributions

Conceptualization, H.M.-M. and J.M.D.; methodology, H.M.-M., J.M.D. and G.Á.-P.; formal analysis, H.M.-M.; investigation, H.M.-M., J.M.D. and A.H.H.R.; resources, H.M.-M. and J.M.D.; data curation, H.M.-M., A.H.H.R. and F.C.-M.; writing—original draft preparation, H.M.-M. and J.M.D.; writing—review and editing, H.M.-M., G.Á.-P., J.S.P., J.L.A., A.H.H.R., F.M.-P., F.C.-M. and J.M.D.; project administration, F.M.-P. and F.C.-M.; funding acquisition, J.L.A., J.S.P. and J.M.D. All authors have read and agreed to the published version of the manuscript.

Funding

This research was funded by Norwegian government, CONAFOR, UNPD, FAO; Project: “Fortalecimiento de la preparación REDD+ en México y fomento de la cooperación Sur-Sur”.

Acknowledgments

The study reported in this paper is part of the Ph. D. dissertation of the first author at the Centro de Investigación Científica de Yucatán, A.C. The first author thanks the Consejo Nacional de Ciencia y Tecnología-Mexico for the scholarship to pursue his doctoral studies. We thank the local community of Xkobenhaltun for kindly granting access to their forested land, Fernando Tun Dzul for his help with Figure 1, and Antonio Pool Chan and Cristina Moreno for their assistance with field work. María Elena Sánchez-Salazar translated a first draft of the manuscript into English.

Conflicts of Interest

The authors declare no conflict of interest. The funders participated in the design of the study; but not in the collection, analysis, or interpretation of data; in the writing of the manuscript, or in the decision to publish the results.

Appendix A

Table A1. Characteristics of the sampling clusters in which litterfall production was monitored. The effect of slope was evaluated only in age classes IV and V, using the average slope of the three plots of each cluster that fell in the predominant topographic position in the cluster (*).
ClusterAge as of 2013
(Years)
Age Class
(Years)
Predominant Topographic PositionAverage Slope
(%)
213I (3–5)Flat2.01
224I (3–5)Flat1.22
233.5I (3–5)Flat1.52
2510II (10–17)Flat0
2617II (10–17)Flat0
2816II (10–17)Flat5.01
2918III (18–25)Flat6.63
3020III (18–25)Flat0
3124III (18–25)Flat5.89
560IV (60–79)Slope *13.41
765IV (60–79)Slope *14.55
1370IV (60–79)Flat *3.42
2100V (≥80)Slope *15.1
880V (≥80)Flat *5.49
20100V (≥80)Flat *3.00

Appendix B

Table A2. List of woody plant species sampled in fifteen 1-ha sampling clusters of four 0.04-ha (400 m2) plots.
No.Species Name and AuthorityFamily
1Acacia dolichostachya S.F. Blake Fabaceae
2Acacia gaumeri S.F. Blake Fabaceae
3Acacia pennatula (Schltdl. & Cham.) Benth. Fabaceae
4Albizia tomentosa (Micheli) Standl. Fabaceae
5Alvaradoa amorphoides Liebm. Picramniaceae
6Amphilophium paniculatum var molle (Schltdl. & Cham.) Standl. Bignoniaceae
7Apoplanesia paniculata C. Presl Fabaceae
8Ardisia escallonioides Schltdl. & Cham. Primulaceae
9Arrabidaea floribunda (Kunth) Loes.Bignoniaceae
10Asemnantha pubescens Hook. f. Rubiaceae
11Attilaea abalak E. Martínez & Ramos Anacardiaceae
12Bauhinia divaricata L.Fabaceae
13Bauhinia ungulata L.Fabaceae
14Bonelia macrocarpa Cav. Primulaceae
15Bourreria pulchra (Millsp.) Millsp. Ehretiaceae
16Bourreria oxyphylla Standl. Ehretiaceae
17Bunchosia glandulosa (Cav.) DC. Malpighiaceae
18Bunchosia swartziana Griseb.Malpighiaceae
19Bursera simaruba (L.) Sarg. Burseraceae
20Caesalpinia gaumeri Greenm.Fabaceae
21Caesalpinia mollis (Kunth) Spreng.Fabaceae
22Caesalpinia yucatanensis Greenm.Fabaceae
23Callicarpa acuminata Kunth.Lamiaceae
24Calyptranthes pallens Griseb.Myrtaceae
25Cardispermum halicacabum L. Sapindaceae
26Casearia emarginata C. Wright ex Griseb.Salicaceae
27Ceiba aesculifolia (Kunth) Britten & Baker f. Malvaceae
28Ceiba pentandra (L.) Gaertn. Malvaceae
29Ceiba schotti Britten & Baker f. Malvaceae
30Celtis iguanaea (Jacq.) Sarg. Cannabaceae
31Ceratophytum tetragonolobum (Jacq.) Sprague & Sandwith Bignoniaceae
32Chiococca alba (L.) Hitchc. Rubiaceae
33Chloroleucon mangense (Jacq.) Britton & RoseFabaceae
34Chlorophora tinctoria (L.) Gaudich. Moraceae
35Cissus gossypifolia Standl. Vitaceae
36Cnidoscolus aconitifolius (Mill.) I.M. Johnst. Euphorbiaceae
37Coccoloba acapulcensis Standl. Polygonaceae
38Coccoloba diversifolia Jacq. Polygonaceae
39Coccoloba spicata LundellPolygonaceae
40Cochlospermum vitifolium (Willd.) Spreng. Bixaceae
41Colubrina elliptica (Sw.) Brizicky & W.L. Stern Rhamnaceae
42Colubrina greggii S. Watson Rhamnaceae
43Cordia alliadora (Ruiz & Pav.) Oken Boraginaceae
44Cordia gerascanthus L. Boraginaceae
45Cosmocalyx spectabilis Standl. Rubiaceae
46Croton glabellus L. Euphorbiaceae
47Croton reflexifolius Kunth Euphorbiaceae
48Cydista diversifolia (Kunth) Miers Bignoniaceae
49Cydista heterophylla Seibert Bignoniaceae
50Cydista potosina (K. Schum. & Loes.) Loes. Bignoniaceae
51Cynanchum schlechtendalii (Decne.) Standl. & Steyerm. Apocynaceae
52Diospyros anisandra S.F. Blake Ebenaceae
53Diospyros cuneata Standl. Ebenaceae
54Diospyros salicifolia Humb. & Bonpl. ex Willd. Ebenaceae
55Diospyros verae-crucis (Standl.) Standl. Ebenaceae
56Diospyros yatesiana Standl. ex Lundell Ebenaceae
57Diphysa carthagenensis Jacq.Fabaceae
58Ehretia tinifolia L.Ehretiaceae
59Enterolobium cyclocarpum (Jacq.) Griseb. Fabaceae
60Erythrina standleyana Krukoff Fabaceae
61Erythroxylum rotundifolium Lunan Erythroxylaceae
62Eugenia axillaris (Sw.) Willd. Myrtaceae
63Eugenia buxifolia (Sw.) Willd. Myrtaceae
64Exostema caribaeum (Jacq.) Roem. & Schult. Rubiaceae
65Exostema mexicanum A. Gray Rubiaceae
66Forchhammeria trifoliata Radlk. Resedaceae
67Gliricidia sepium Kunth ex Steud. Fabaceae
68Guettarda combsii Urb. Rubiaceae
69Guettarda elliptica Sw. Rubiaceae
70Guettarda gaumeri Standl. Rubiaceae
71Gymnopodium floribundum Rolfe Polygonaceae
72Hampea trilobata Standl. Malvaceae
73Helicteres baruensis Jacq. Malvaceae
74Heliocarpus donnellsmithii Rose Malvaceae
75Heteropterys brachiata (L.) DC. Malpighiaceae
76Heteropterys laurifolia (L.) A. Juss. Malpighiaceae
77Hippocratea celastroides Kunth Celastraceae
78Hippocratea excelsa Kunth Celastraceae
79Hiraea reclinata Jacq. Malpighiaceae
80Jacquinia macrocarpa Cav.Primulaceae
81Karwinskia humboldtiana (Schult.) Zucc. Rhamnaceae
82Krugiodendron ferreum (Vahl) Urb. Rhamnaceae
83Laetia thamnia L.Salicaceae
84Leucaena leucocephala (Lam.) de Wit Fabaceae
85Lonchocarpus sp Kunth Fabaceae
86Lonchocarpus hondurensis Benth. Fabaceae
87Lonchocarpus longistylus Pittier Fabaceae
88Lonchocarpus rugosus Benth. Fabaceae
89Lonchocarpus xuul Lundell Fabaceae
90Lonchocarpus yucatanensis Pittier Fabaceae
91Luehea candida (DC.) Mart. Malvaceae
92Luehea speciosa Willd. Malvaceae
93Lysiloma latisiliquum (L.) Benth. Fabaceae
94Macfadyena unguis-cati (L.) A.H. Gentry Bignoniaceae
95Machaonia lindeniana Baill.Rubiaceae
96Malpighia glabra L. Malpighiaceae
97Manihot aesculifolia (Kunth) Pohl Euphorbiaceae
98Mansoa verrucifera (Schltdl.) A.H. Gentry Bignoniaceae
99Melicoccus oliviformis Kunth Sapindaceae
100Mimosa bahamensis Benth. Fabaceae
101Montanoa atriplicifolia (Pers.) Sch. Bip. Asteraceae
102Neea psychotrioides Donn. Sm. Nyctaginaceae
103Neea sp. Ruiz & Pav. Nyctaginaceae
104Neomillspaughia emarginata (H. Gross) S.F. Blake Polygonaceae
105Parathesis cubana (A. DC.) Molinet & M. Gómez Primulaceae
106Parmentiera millspaughiana L.O. Williams Bignoniaceae
107Phyllanthus acuminatus Vahl Phyllanthaceae
108Piscidia piscipula (L.) Sarg. Fabaceae
109Pisonia aculeata L. Nyctaginaceae
110Pithecoctenium crucigerum (L.) A.H. Gentry Bignoniaceae
111Platymiscium yucatanum Standl. Fabaceae
112Plumeria obtusa L. Apocynaceae
113Psidium sartorianum (O. Berg) Nied. Myrtaceae
114Psychotria microdon (DC.) Urb. Rubiaceae
115Randia longiloba Hemsl. Rubiaceae
116Randia obcordata S. Watson Rubiaceae
117Randia truncata Greenm. & C.H. Thomps. Rubiaceae
118Sabal japa C. Wright ex Becc. Arecaceae
119Sabal yapa C. Wright ex Becc. Arecaceae
120Samyda yucatanensis Standl. Salicaceae
121Schoepfia schreberi J.F. Gmel. Schoepfiaceae
122Senna atomaria (L.) H.S. Irwin & Barneby Fabaceae
123Senna racemosa (Mill.) H.S. Irwin & Barneby Fabaceae
124Senna villosa (Mill.) H.S. Irwin & Barneby Fabaceae
125Sideroxylon obtusifolium (Humb. ex Roem. & Schult.) T.D. Penn. Sapotaceae
126Solanum erianthum D. Don Solanaceae
127Spondias mombin L. Anacardiaceae
128Tabebuia chrysantha (Jacq.) G. Nicholson Bignoniaceae
129Talisia olivaeformis (Kunth) Radlk. Sapindaceae
130Thevetia gaumeri Hemsl. Apocynaceae
131Thouinia paucidentata Radlk. Sapindaceae
132Trichilia glabra L. Meliaceae
133Vitex gaumeri Greenm. Lamiaceae
134Ximenia americana L. Ximeniaceae
135Zanthoxylum caribaeum Lam. Rutaceae
136Zapoteca Formosa (Kunth) H.M. Hern. Fabaceae

Appendix C

Table A3. Litterfall production values reported in the literature for different tropical dry forests.
LocationForest TypeProduction (Mg/ha/yr)Source
MexicoSubdeciduous4.94–6.17This study
MexicoSemi-evergreen5.20–7.10Aryal et al. [16]
MexicoSemi-evergreen and subdeciduous3.80–6.80Lawrence [21]
IndiaEvergreen and deciduous5.76–8.65Sundarapandian and Swamy [25]
MexicoDeciduous3.98–6.58Martínez-Yrízar and Sarukhán [27]
MexicoSemi-evergreen5.00–7.70Whigham et al. [28]
BrazilDeciduous4.00–4.50Souza et al. [81]

References

  1. Negash, M.; Starr, M. Litterfall production and associated carbon and nitrogen fluxes of seven woody species grown in indigenous agroforestry systems in the south-eastern Rift Valley escarpment of Ethiopia. Nutr. Cycl. Agroecosyst. 2013, 97, 29–41. [Google Scholar] [CrossRef]
  2. Facelli, J.M.; Pickett, S.T. Plant litter: Its dynamics and effects on plant community. Bot. Rev. 2008, 57, 1–32. [Google Scholar] [CrossRef]
  3. Dent, D.H.; Bagchi, R.; Robinson, D.; Majalap-Lee, N.; Burslem, D.F.R. Nutrient fluxes via litterfall and leaf litter decomposition vary across a gradient of soil nutrient supply in a lowland tropical rain forest. Plant Soil 2006, 288, 197–215. [Google Scholar] [CrossRef]
  4. Takyu, M.; Aiba, S.I.; Kitayama, K. Changes in biomass, productivity and decomposition along topographical gradients under different geological conditions in tropical lower montane forests on Mount Kinabalu, Borneo. Oecologia 2003, 134, 397–404. [Google Scholar] [CrossRef] [PubMed]
  5. Martínez-Yrízar, A.; Maass, M.; Pérez-Jiménez, L.A.; Sarukhán, J. Net primary productivity of a tropical deciduous forest ecosystem in western Mexico. J. Trop. Ecol. 1996, 12, 169–175. [Google Scholar] [CrossRef]
  6. González, R.H.; Cantú, I.; Ramírez, G.R.; Gómez, M.V.; Domínguez, T.G.; Bravo, J.; Maiti, R.K. Spatial and seasonal litterfall deposition pattern in the Tamaulipan thorscrub, Northeastern Mexico. J. Environ. 2008, 1, 177–181. [Google Scholar]
  7. Bosco, J.I.; Blanco, J.A.; Castillo, F.J. Gestión forestal y ciclos de nutrientes en el marco del cambio global. In Ecología de Bosque Mediterráneo en un Mundo Cambiante; Valladares, F., Ed.; Ministerio del Medio Ambiente: Madrid, Spain, 2004; pp. 479–506. [Google Scholar] [CrossRef] [Green Version]
  8. Prause, J.; De Caram, A.G.; Angeloni, P.N. Variación mensual en el aporte de cuatro especies forestales nativas del Parque Chaqueño Humado (Argentina). Quebracho 2003, 10, 39–45. [Google Scholar]
  9. Melillo, J.M.; McGuire, A.D.; Kicklighter, D.W.; Moore, B.; Vorosmarty, C.J.; Schloss, A.L. Global climate change and terrestrial net primary production. Nature 1993, 363, 234–240. [Google Scholar] [CrossRef]
  10. De Jong, B.H.J. Spatial distribution of biomass and links to reported disturbances in tropical lowland forests of southern Mexico. Carbon Manag. 2013, 4, 601–615. [Google Scholar] [CrossRef]
  11. Scheer, M.B.; Gatti, G.; Wisniewski, C. Nutrient fluxes in litterfall of a secondary successional alluvial rain forest in Southern Brazil. Rev. Biol. Trop. 2011, 59, 1869–1882. [Google Scholar]
  12. Thuille, A.; Schulze, E.D. Carbon dynamics in successional and afforested spruce stands in Thuringia and the Alps. Glob. Chang. Biol. 2006, 12, 325–342. [Google Scholar] [CrossRef]
  13. Sánchez-Azofeifa, A.; Powers, J.; Fernandes, G.; Quesada, M. Tropical dry forest in the Americas: The Tropi-Dry Endeavor. In Tropical Dry Forests in the Americas: Ecology, Conservation and Management; Sánchez-Azofeifa, A., Power, J., Fernandes, G., Quesada, M., Eds.; Routledge: New York, NY, USA, 2013; pp. 20–34. [Google Scholar]
  14. Banda-R, K.; Delgado, S.A.; Dexter, K.G.; Linares, P.R.; Oliveira, F.A.; Prado, D.; Pullan, M.; Quintana, C.; Riina, R.; Rodríguez, G.M.; et al. Plant diversity patterns in neotropical dry forests and their conservation implications. Science 2016, 353, 1383–1387. [Google Scholar] [CrossRef] [PubMed] [Green Version]
  15. Huechacona-Ruíz, A.H. Dinámica de la Producción de Hojarasca y el Índice de Área Foliar en un Bosque Tropical Seco en Yucatán. Master’s Thesis, Centro de Investigación Científica de Yucatán, Mérida, Mexico, 2016. [Google Scholar] [CrossRef]
  16. Aryal, D.B.; de Jong, B.H.J.; Ochoa-Gaona, S.; Mendoza-Vega, J.; Esparza-Olguin, L. Successional and seasonal variation in litterfall and associated nutrient transfer in semi-evergreen tropical forests of SE Mexico. Nutr. Cycl. Agroecosyst. 2015, 103, 45–60. [Google Scholar] [CrossRef]
  17. Valentini, C.M.A.; Sanches, L.; de Paula, S.R.; Vourlitis, G.L.; Nogueira, J.D.; Pinto, O.B.P.; Lobo, F.D. Soil respiration and aboveground litter dynamics of a tropical transitional forest in northwest Mato Grosso, Brazil. J. Geophys. Biogeosci. Res. 2008, 113, 11. [Google Scholar] [CrossRef]
  18. Martins, S.V.; Rodrigues, R.R. Produção de serapilheira em clareiras de uma floresta estacional semidecidual no municipio de Campinas, SP. Rev. Bras. Bot. 1999, 22, 405–412. [Google Scholar] [CrossRef] [Green Version]
  19. Zhang, H.; Yuan, W.; Dong, W.; Liu, S. Seasonal patterns of litterfall in forest ecosystem worldwide. Ecol. Complex 2014, 20, 240–247. [Google Scholar] [CrossRef]
  20. Cuba, N.; Rogan, J.; Christman, Z.; Williams, C.; Schneider, L.; Lawrence, D.; Millones, M. Modelling dry season deciduousness in Mexican Yucatán forest using MODIS EVI data (2000–2011). GISci. Remote Sens. 2013, 50, 26–49. [Google Scholar] [CrossRef]
  21. Lawrence, D. Regional-scale variation in litter production and seasonality in tropical dry forests of Southern Mexico. Biotropica 2005, 37, 561–570. [Google Scholar] [CrossRef]
  22. Kelly, D.L.; Tanner, E.V.; Kapos, V.; Dickinson, T.A.; Goodreiend, G.A.; Fiiarbairn, P.I. Jamaican limestone forests: Floristries, structure and environment of three examples along a rainfall gradient. J. Trop. Ecol. 1988, 24, 121–156. [Google Scholar] [CrossRef]
  23. Murphy, P.G.; Lugo, A. Ecology of tropical dry Forest. Annu. Rev. Ecol. Syst. 1986, 17, 67–88. [Google Scholar] [CrossRef]
  24. Parsons, S.A.; Congdon, R.A.; Shoo, L.P.; Valdez, V.; Williams, S.E. Spatial variability in litterfall, litter standing crop and litter quality in a tropical rain forest region. Biotropica 2014, 46, 378–386. [Google Scholar] [CrossRef]
  25. Sundarapandian, S.M.; Swamy, P.S. Litter production and leaf litter decomposition of selected tree species in tropical forests at Kodayar in the Western Ghats, India. For. Ecol. Manag. 1999, 123, 231–244. [Google Scholar] [CrossRef]
  26. Sánchez-Silva, S.; De Jong, B.H.J.; Aryal, D.R.; Huerta-Lwanga, E.; Mendoza-Vega, J. Trends in leaf traits, litter dynamics and associated nutrient cycling along a secondary successional chronosequence of semi-evergreen tropical forest in South-Eastern Mexico. J. Trop. Ecol. 2018, 34, 364–377. [Google Scholar] [CrossRef]
  27. Martínez-Yrízar, A.; Sarukhán, J. Litterfall patterns in a tropical deciduous forest in Mexico over a five-year period. J. Trop. Ecol. 1990, 6, 137–154. [Google Scholar] [CrossRef]
  28. Whigham, D.F.; Zugasty, P.; Cabrera, E.; O’neill, J.; Ley, E. The effecto of annual variation in precipitation on growth and litter production in a tropical dry forest in the Yucatan of Mexico. J. Trop. Ecol. 1990, 32, 23–34. [Google Scholar]
  29. Tang, J.; Cao, M.; Zhang, J.; Li, M. Litterfall production, decomposition and nutrient use efficiency varies with tropical forest types in Xishuangbanna, SW China: A 10-year study. Plant Soil 2010, 335, 271–288. [Google Scholar] [CrossRef]
  30. Wagner, F.H.; Hérault, B.; Bonal, D.; Stahl, C.; Anderson, L.O.; Baker, T.R.; Becker, G.S.; Beeckman, H.; Souza, D.B.; Botosso, P.C.; et al. Climate seasonality limits leaf carbon assimilation and wood productivity in tropical forests. Biogeosciences 2016, 13, 2537–2562. [Google Scholar] [CrossRef] [Green Version]
  31. Barlow, J.; Gardner, T.A.; Ferreira, L.V.; Pérez, C.A. Litter fall and decomposition in primary, secondary and plantation forest in the Brazilian Amazon. For. Ecol. Manag. 2007, 247, 91–97. [Google Scholar] [CrossRef]
  32. Huang, Y.; Ma, Y.; Zhao, K.; Niklaus, P.A.; Schmid, B.; He, J. Positive effects of tree species diversity on litterfall quantity and quality along a secondary successional chronosequence in a subtropical forest. Plant Ecol. 2017, 10, 28–35. [Google Scholar] [CrossRef] [Green Version]
  33. Zalamea, M.; González, G. Leaf fall phenology in a subtropical we forest in Puerto Rico: From species to community patterns. Biotropica 2008, 40, 295–304. [Google Scholar] [CrossRef]
  34. Holbrook, N.M.; Whitbeck, J.L.; Mooney, H.A. Drought responses of Neotropical dry forest trees. In Seasonally Dry Tropical Forests; Bullock, S.H., Mooney, H.A., Medina, E., Eds.; Cambridge University Press: Cambridge, UK, 1995; pp. 243–276. [Google Scholar] [CrossRef]
  35. Gaspar-Santos, E.; Espinoza, M.G.; Marcial, N.R.; Álvarez, S.J.D. Acumulación y descomposición de hojarasca en bosques secundarios del sur de la Sierra Madre de Chiapas, México. Bosque 2015, 36, 467–480. [Google Scholar] [CrossRef] [Green Version]
  36. Celentano, D.; Zahawi, R.A.; Finegan, B.; Ostertag, R.; Cole, R.J.; Holl, K.D. Litterfall dynamics under different tropical forest restoration strategies in Costa Rica. Biotropica 2011, 43, 279–287. [Google Scholar] [CrossRef]
  37. Chave, J.; Navarrete, D.; Almeida, S.; Álvarez, E.; Aragão, L.E.; Bonal, D.; Châtelet, P.; Silva-Espejo, J.; Goret, J.Y.; von Hildebrand, P.; et al. Regional and temporal patterns of litterfall in tropical South America. Biogeosci. Discuss 2009, 6, 7565–7597. [Google Scholar] [CrossRef]
  38. Norden, N.; Angarita, H.A.; Bongers, F.; Martínez, M.; La Cerda, I.G.; Van Breugel, M.; Lebrija-Trejos, E.; Meave, J.A.; Vandermeer, J.; Williamson, G.B.; et al. Successional dynamics in Neotropical forests are as uncertain as they are predictable. Proc. Natl. Acad. Sci. USA 2015, 112, 803–818. [Google Scholar] [CrossRef] [PubMed] [Green Version]
  39. Nunes, Y.R.F.; Luz, G.R.; Souza, S.R.; Silva, D.; Veloso, M.D.M.; Espírito-Santo, M.M.; Santos, R.M. Floristic, structural, and functional group variations in tree assemblages in a Brazilian tropical dry Forest: Effects of successional stage and soil properties. In Tropical Dry Forests in the Americas: Ecology, Conservation, and Management; Sánchez-Azofeifa, A., Powers, J.S., Fernandes, G.W., Quesada, M., Eds.; CRC Press: Boca Raton, FL, USA, 2014; pp. 329–353. [Google Scholar] [CrossRef]
  40. Lebrija-Trejos, E.; Pérez, E.A.; Meave, J.A.; Poorter, L.; Bongers, F. Environmental changes during secondary succession in a tropical dry forest in Mexico. J. Trop. Ecol. 2011, 27, 477–489. [Google Scholar] [CrossRef] [Green Version]
  41. Chazdon, R.L.; Letcher, S.G.; Van Breugek, M.; Martínez-Ramos, M. Rates of change in tree communities of secondary neotropical forests following major disturbances. Philos. Trans. R. Soc. Lond. Ser. B 2007, 362, 273–289. [Google Scholar] [CrossRef]
  42. Lohbeck, M.; Lebrija-Trejos, E.; Martinez-Ramos, M.; Meave, J.A.; Poorter, L.; Bongers, F. Functional trait strategies of trees in dry and wet tropical forests are similar but differ in their consequences for succession. PLoS ONE 2015, 10, e0123741. [Google Scholar] [CrossRef] [Green Version]
  43. Schilling, J.S.; Ayres, A.; Kaffenberger, J.T.; Powers, J.S. Initial white rot type dominance of wood decomposition and its functional consequences in a regenerating tropical dry forest. Soil Biol. Biochem. 2016, 88, 58–68. [Google Scholar] [CrossRef]
  44. Lasky, J.R.; Uriarte, M.; Boukili, V.K.; Chazdon, R.L. Trait-mediated assembly processes predict successional changes in community diversity of tropical forests. Proc. Natl. Acad. Sci. USA 2014, 111, 5616–5621. [Google Scholar] [CrossRef] [Green Version]
  45. Becknell, J.M.; Powers, J.S. Stand age and soils as drivers of plant functional traits and aboveground biomass in secondary tropical dry forest. Can. J. For. Res. 2014, 44, 604–613. [Google Scholar] [CrossRef]
  46. Quesada, M.; Álvarez, M.; Avila, L.; Castillo, A.; Lopezaraiza, M.; Martén, V.; Guerrero, V.R.; Sáyago, R.G.; Sánchez, G.; Contreras, J.M.; et al. Tropical Dry Forest Ecological Succession in México: Synthesis of a Long-Term Study. In Tropical Dry Forest in the Americas; Sánchez-Azofeifa, A., Powers, J., Fernandes, G., Quesada, M., Eds.; Island Press: Washington, DC, USA, 2009; pp. 17–53. [Google Scholar]
  47. Guariguata, M.R.; Osterbag, R. Neotropical secondary forest succession: Changes in structural and functional characteristics. For. Ecol. Manag. 2001, 148, 185–206. [Google Scholar] [CrossRef]
  48. Buzzard, V.; Hulshof, C.M.; Birt, T.; Violle, C.; Enquist, B.J. Data from: Re-growing a tropical dry forest: Functional plant trait composition and community assembly during succession provisional. Dryad Digit. Repos. 2016. [Google Scholar] [CrossRef]
  49. Lohbeck, M.; Poorter, L.; Lebrija-Trejos, E.; Martínez-Ramos, M.; Meave, J.A.; Paz, H.; Pérez-García, E.A.; Romero, I.E.; Tauro, A.; Bongers, F. Successional changes in functional composition contrast for dry and wet tropical forest. Ecology 2013, 94, 1211–1216. [Google Scholar] [CrossRef] [PubMed]
  50. Sanaphre-Villanueva, L.; Dupuy, J.M.; Andrade, J.L.; Reyes, C.; Jackson, P.C.; Paz, H. Patterns of plant functional variation and specialization along secondary succession and topography in a tropical dry forest. Environ. Res. Lett. 2017, 12, 1–10. [Google Scholar] [CrossRef]
  51. Pineda-García, F.; Paz, H.; Meinzer, F.C. Drought resistance in early and late secondary successional species from a tropical dry forest: The interplay between xylem resistance to embolism, sapwood water storage and leaf shedding. Plant Cell. Environ. 2013, 36, 405–418. [Google Scholar] [CrossRef] [PubMed]
  52. Lebrija-Trejos, E.; Meave, J.A.; Poorter, L.; Pérez, E.A.; Bongers, F. Pathways, mechanisms and predictability of vegetation change during tropical dry forest succession. Annu. Rev. Ecol. Syst. 2010, 12, 267–275. [Google Scholar] [CrossRef]
  53. Méndez-Alonzo, R.; Pineda, F.; Paz, H.; Rosell, J.A.; Olson, M.E. Leaf phenology is associated with soil water availability and xylem traits in a tropical dry forest. Trees 2013, 27, 745–754. [Google Scholar] [CrossRef]
  54. Gallardo-Cruz, J.A.; Pérez-García, E.A.; Meave, J.A. Diversity and vegetation structure as influenced by slope aspect and altitude in a seasonally dry tropical landscape. Landsc. Ecol. 2009, 24, 473–482. [Google Scholar] [CrossRef]
  55. Pierce, K., Jr.; Lookingbill, T.; Urban, D. A simple method for estimating potential relative radiation (PRR) forlandscape-scale vegetation analysis. Landsc. Ecol. 2005, 20, 137–147. [Google Scholar] [CrossRef]
  56. Suzaki, T.; Kume, A.; Ino, Y. Effects of slope and canopy trees on light conditions and biomass of dwarf bamboo under acoppice canopy. J. For. Res. 2005, 10, 151–156. [Google Scholar] [CrossRef]
  57. Becker, P.; Rabenold, P.E.; Idol, J.R.; Smith, A.P. Water potential gradients for gaps and slopes in a Panamanian tropical moist forest’s dry season. J. Trop. Ecol. 1988, 4, 173–184. [Google Scholar] [CrossRef]
  58. Markesteijn, L.; Poorter, L.; Paz, H.; Sack, L.; Bongers, F. Ecological differentiation in xylem cavitation resistance is associated with stem and leaf structural traits. Plant Cell. Environ. 2010, 34, 137–148. [Google Scholar] [CrossRef] [PubMed]
  59. Daws, M.I.; Mullins, C.E.; Burslem, D.F.; Paton, S.R.; Dalling, J.W. Topographic position affects the water regime in a semideciduous tropical forest in Panama. Plant Soil 2002, 238, 79–89. [Google Scholar] [CrossRef]
  60. Borchert, R. Soil and Stem Water Storage Determine Phenology and Distribution of Tropical Dry Forest Trees. Ecology 1994, 75, 1437. [Google Scholar] [CrossRef]
  61. Orellana, R.; Islebe, G.; Espadas, C. Presente, pasado y futuro de los climas de la Península de Yucatán. In Naturaleza y Sociedad en el Área Maya: Pasado, Presente y Futuro; Colunga, M.P., Larqué, A., Eds.; Centro de Investigación Científica de Yucatán: Mérida, Mexico, 2003; pp. 37–52. [Google Scholar] [CrossRef] [Green Version]
  62. Bautista-Zuñiga, F.; Batllori-Sampedro, E.; Ortiz-Pérez, M.A.; Palacio-Aponte, G.; Castillo-González, M. Geoformas, agua y suelo en la Península de Yucatán. In Naturaleza y Sociedad en el Área Maya: Pasado, Presente y Futuro; Colunga, M.G., Patricia, S., Larqué, A.S., Eds.; Academia Mexicana de Ciencias, Centro de Investigación Científica de Yucatán: Mérida, Mexico, 2003; pp. 21–36. [Google Scholar] [CrossRef]
  63. Dupuy, J.M.; Hernández-Stefanoni, J.L.; Hernández, R.A.; Tetetla-Rangel, E.; López, J.O.; Martínez, E.; Leyequién-Abarca, E.; Tun-Dzul, F.; May Pat, F. Patterns and correlates of tropical dry forest structure and composition in a highly replicated chronosequence in Yucatan, Mexico. Biotropica 2012, 44, 151–162. [Google Scholar] [CrossRef]
  64. Hernández-Stefanoni, J.L.S.; Dupuy, J.M.; Tun-Dzul, F.; May-Pat, F. Influence of landscape structure and stand age on species density and biomass of a tropical dry forest across spatial scales. Landsc. Ecol. 2011, 26, 355–370. [Google Scholar] [CrossRef]
  65. Comisión Nacional Forestal (CONAFOR). Manual y Procedimiento Para el Muestreo de Campo; Comisión Nacional Forestal: Jalisco, Mexico, 2013. [Google Scholar]
  66. Aceñolaza, P.G.; Zamboni, L.P.; Gallardo, J.F. Aporte de hojarasca en bosques del predelta del río Paraná (Argentina). Bosque 2009, 30, 135–145. [Google Scholar] [CrossRef] [Green Version]
  67. Honorio, E.N.; Baker, T.R. Manual Para el Monitoreo del Ciclo del Carbono en Bosques Amazónicos; Instituto de Investigaciones de la Amazonia Peruana, Universidad de Leeds: Lima, Peru, 2010. [Google Scholar] [CrossRef]
  68. Jones, H.G. Plants and Microclimate: A Quantitative Approach to Environmental Plant Physiology, 2nd ed.; Cambridge University Press: Cambridge, UK, 1992. [Google Scholar]
  69. Ramírez, G.; Dupuy, J.M.; Solorio, F.J.; Ramírez, L. Ecuaciones Alométricas de Biomasa Epigea en Una Selva Mediana Subcaducifolia de la Península de Yucatán. Ph.D. Thesis, Centro de Investigación Científica de Yucatán, Mérida, Mexico, 2019. [Google Scholar]
  70. Chave, J.; Andalo, S.; Brown, M.A.; Cairns, J.Q.; Chambers, D.; Eamus, H.; Fölster, H.; Fromard, F.; Higuchi, N.; Kira, T.; et al. Tree allometry and improved estimation of carbon stock and balance in tropical forests. Oecología 2005, 145, 87–99. [Google Scholar] [CrossRef]
  71. Duno, R.; Carnevali, G.; Ramírez, I.M.; Tapia, J.L.M.; Lorena, L.C.; Hernández, S.A.; Embray, T. Flora Ilustrada de la Península de Yucatán: Listado Florístico; Centro de Investigación Científica de Yucatán: Mérida, Mexico, 2010. [Google Scholar] [CrossRef]
  72. Pennington, T.D.; Sarukhán, J. Árboles Tropicales de México. Manual Para la Identificación de las Principales Especies, 3rd ed.; Ediciones Científicas Universitarias, UNAM: Mexico City, Mexico, 2005. [Google Scholar] [CrossRef]
  73. Anselin, L. Local Indicators of Spatial Association-ISA. Geogr. Anal. 2010, 27, 93–115. [Google Scholar] [CrossRef]
  74. Environmental Systems Research Institute. ArcGIS Desktop: Release 10; Environmental Systems Research Institute: Redlands, CA, USA, 2020. [Google Scholar]
  75. QGIS Development Team. QGIS Geographic Information System. Open Source Geospatial Foundation Project. 2020. Available online: https://www.qgis.org/en/site/ (accessed on 24 January 2020).
  76. SPSS Inc. SPSS Statistics Para Windows, versión 17.0; SPSS Inc.: Chicago, IL, USA, 2008.
  77. R Development Core Team. A Language and Environment for Statistical Computing; R Foundation for Statistical Computing: Vienna, Austria, 2012; Available online: https://www.R-project.org/ (accessed on 22 June 2018).
  78. Burnham, K.P.; Anderson, D.R. Model Selection and Multimodel Inference: A Practical Information-Theoretic Approach, 2nd ed.; Springer: New York, NY, USA, 2002. [Google Scholar]
  79. Caballero, D.F.F. Selección de Modelos Mediante Criterios de Información en Análisis Factorial. Aspectos Teóricos y Computacionales. Ph.D. Thesis, Universidad de Granada, Granada, Spain, 2011. [Google Scholar]
  80. Ichikawa, M. Empirical assessments of AIC procedure for model selection in factor analysis. Behaviormetrika 1988, 24, 499–509. [Google Scholar] [CrossRef]
  81. Souza, S.R.; Veloso, M.D.M.; Espírito-Santo, M.M.; Silva, J.O.; Sánchez-Azofeifa, A.; Souza e Brito, B.G.; Fernandez, G.W. Litterfall dynamics along a successional gradient in a Brazilian tropical dry forest. For. Ecosyst. 2019, 6, 35. [Google Scholar] [CrossRef] [Green Version]
  82. Ramírez-Guardado, M.A. Estimación del Carbono Retenido en la Biomasa Aérea en Una Selva Tropical de Yucatán, México. Master’s Thesis, Centro de Investigación Científica de Yucatán, Mérida, Mexico, 2015. [Google Scholar]
  83. Ruiz, J.; Fandino, M.C.; Chazdon, R.L. Vegetation structure, composition, and species richness across a 56-year chronosequence of dry tropical forest on Providencia Island, Colombia. Biotropica 2005, 37, 520–530. [Google Scholar] [CrossRef]
  84. Ceccon, E.; Sánchez, S.; Campo, J. Tree seedling dynamics in two abandoned tropical dry forest of differing successional status in Yucatan, México: Field experiment whit N and P fertilization. Plant Ecol. 2004, 170, 277–285. [Google Scholar] [CrossRef]
  85. Feng, C.; Wang, Z.; Ma, Y.; Fu, S.; Chen, H.Y. Increased litterfall contributes to carbon and nitrogen accumulation following cessation of anthropogenic disturbances in degraded forests. For. Ecol. Manag. 2019, 432, 832–839. [Google Scholar] [CrossRef]
  86. Pineda, F.; Paz, H.; Tinoco, C. Morphological and physiological differentiation of seedlings between dry and wet habitats in a tropical dry forest: Water-use strategies of TDF tree seedlings. Plant Cell. Environ. 2011, 34, 1536–1547. [Google Scholar] [CrossRef] [PubMed]
  87. Pineda-García, F.; Paz, H.; Meinzer, F.C.; Angeles, G. Exploiting water versus tolerating drought: Water-use strategies of trees in a secondary successional tropical dry forest. Tree Physiol. 2015, 36, 208–217. [Google Scholar] [CrossRef] [Green Version]
  88. Markesteijn, L.; Poorter, L. Seedling root morphology and biomass allocation of 62 tropical tree species in relation to drought-and shade-tolerance. Open J. Ecol. 2009, 97, 311–325. [Google Scholar] [CrossRef]
  89. Méndez, R.; Paz, H.; Zuluaga, R.C.; Rosell, J.A.; Olson, M.E. Coordinated evolution of leaf and stem economics in tropical dry forest trees. Ecology 2012, 93, 2397–2406. [Google Scholar] [CrossRef]
  90. Gei, M.G.; Rozendaal, D.M.A.; Poorter, L.; Bongers, F.; Sprent, J.; Mira, G.D.; Aide, T.M.; Andrade, J.L.; Balvanera, P.; Becknell, J.M.; et al. Legume Abundance Along Successional And Rainfall Gradients In Neotropical Forests. Nat. Ecol. Evol. 2018, 2, 1104–1111. [Google Scholar] [CrossRef]
  91. Erickson, H.E.; Helmer, E.H.; Bandeis, T.J.; Lugo, A.E. Control on fallen leaf chemistry and forest floor element masses in native and forest across a tropical island. Ecosphere 2014, 5, 1–28. [Google Scholar] [CrossRef] [Green Version]
  92. López-Martínez, J.O.; Sanaphre, L.; Dupuy, J.M.; Hernández-Stefanoni, J.L.; Meave, J.A.; Gallardo, J.A. β-Diversity of Functional Groups of Woody Plants in a Tropical Dry Forest in Yucatan. PLoS ONE 2013, 8, e73660. [Google Scholar] [CrossRef] [PubMed]
  93. Hernández-Stefanoni, J.L.; Dupuy, J.M.; Tun-Dzul, F.; May Pat, F. Influencia de la estructura del paisaje y la edad de sucesión sobre la diversidad de especies y la biomasa aérea a diferentes escalas. In Planeación de Uso del Suelo a Nivel de Paisaje en el Sur de Yucatán; Centro de Investigación Científica de Yucatán: Mérida, Mexico, 2012; pp. 51–64. [Google Scholar] [CrossRef]
  94. Nafarrate-Hecht, A.C. Estimación Directa e Indirecta del Índice de Área Foliar y su Modelación con Lidar en un Bosque Tropical Seco de Yucatán. Master’s Thesis, Centro de Investigación Científica de Yucatán, Mérida, Mexico, 2017. [Google Scholar] [CrossRef]
  95. Valdez, M.; Andrade, J.L.; Jackson, P.C.; Rebolledo, M. Phenology of five tree species of a tropical dry forest in Yucatan, México: Effects of environmental and physiological factors. Plant Soil 2010, 329, 155–171. [Google Scholar] [CrossRef]
  96. Portillo, C.A.; Sánchez-Azofeifa, A. Extent and conservation of tropical dry forests in the Americas. Biol. Conserv. 2009, 143, 144–155. [Google Scholar] [CrossRef]
  97. Smith, V.C.; Ennos, R. The effects of air flow and stem flexure on the mechanical and hydraulic properties of the stems of sunflowers Helianthus annuus L. J. Exp. Bot. 2003, 845–849. [Google Scholar] [CrossRef] [PubMed]
  98. Van Gardingen, P.R.; Grace, J. Plants and wind. Bot. Res. 1991, 18, 192–253. [Google Scholar]
  99. Yazaki, T.; Hirano, T.; Sano, T. Biomass accumulation and net primary production during the early stage of secondary succession after a severe forest disturbance in northern Japan. Forests 2016, 7, 287. [Google Scholar] [CrossRef] [Green Version]
  100. Lopes, M.C.A.; Araújo, V.F.P.; Vasconcellos, A. The effects of rainfall and vegetation on litterfall production in the semiarid region of northeastern Brazil. Braz. J. Biol. 2015, 75, 703–708. [Google Scholar] [CrossRef] [PubMed] [Green Version]
  101. Pezzini, F.F.; Ranieri, B.D.; Brandão, D.; Fernandes, G.W.; Quesada, M.; Espírito-Santo, M.M.; Jacobi, C.M. Changes in tree phenology along natural regeneration in a seasonally dry tropical forest. Plant Biosyst. 2014, 148, 965–974. [Google Scholar] [CrossRef]
  102. Fernández, E.; Vázquez, T.; Hidalgo, J.Z.; Centeno, R.R. Actualización de los Escenarios de Cambio Climático para Estudios de Impactos, Vulnerabilidad y Adaptación; Unidad Informática para las Ciencias Atmosféricas y Ambientales, Centro de Ciencias de la Atmósfera, Universidad Nacional Autónoma de México, Instituto Nacional de Ecología y Cambio Climático. 2015. Available online: http://atlasclimático.unam.mx/ACM/ (accessed on 10 September 2020).
  103. Ellis, E.A.; Romero Montero, A.; Hernández Gómez, I.U. Evaluación y Mapeo de los Determinantes de Deforestación en la Península Yucatán; USAID-TNC-MREDD+; Mexico, 2015. Available online: https://www.researchgate.net/profile/Edward_Ellis/publication/283090392_Evaluacion_y_mapeo_de_los_determinantes_de_la_deforestacion_en_la_Peninsula_Yucatan-USAIDTNCMREDD/links/562a7d7808ae518e347f54dc.pdf (accessed on 15 September 2020). [CrossRef]
  104. Esparza, O.L.G.; Martínez, E.R. Deforestación en Campeche: Causas y Efectos. Rev. Fomix Campeche 2011, 3, 6–11. [Google Scholar]
  105. Ramírez, L.C.; Rivera, L.J.A. La ganadería en el contexto de la biodiversidad. In Biodiversidad y Desarrollo Humano en Yucatán; Durán, R., Méndez, M., Eds.; PPF-FMAM; Conabio, Seduma: Mérida, Mexico, 2010. [Google Scholar]
  106. Sohn, Y.; Moran, E.; Gurri, F. Deforestation in north-central Yucatán (1985–1995): Mapping secundary succession of forest and agricultural land use in Sotuta using the cosine of the angle concept. In Environmental Sciencie and Engineer for 21st Century; National Science Foundation: Alexandria, VA, USA, 1999; Volume 65, pp. 947–958. [Google Scholar]
Figure 1. (a) Map showing the location of the study area, (b) distribution of the sampling clusters following the design of the National Forest and Soil Inventory of Mexico, (c) arrangement of the four 400 m2 plots (green circles) within each sampling cluster and of the three litterfall traps (black dots) within each plot. Red dots denote the sampling clusters that were used in this study. The inset square is a 3 × 3 km area where the late successional sampling clusters were established following a stratified systematic design; early successional sampling clusters were established outside the reserve following a chronosequence design (see Appendix A).
Forests 11 01241 g001
Figure 2. Annual litterfall production in forests of different successional age classes over the study period. The X-axis numbers indicate the successional age classes (see Table 2); vertical lines are ± 95% confidence intervals. Different letters denote significant differences among successional age classes in each year.
Forests 11 01241 g002
Figure 3. Seasonal (dry vs. rainy season) dynamics of litterfall production in forests of different successional age classes (a), and in contrasting topographic positions (b), over the study period. Numbers along the X-axis in (a) indicate successional age classes; vertical lines are ± 95% confidence intervals. F: flat sites, S: sloping sites. Different letters denote significant differences between seasons and age classes or between seasons and topographic positions in each year.
Forests 11 01241 g003
Figure 4. Average monthly litterfall production in each study year and average monthly precipitation over the study period. The blue shading corresponds to the rainy season and the peach shading to the dry season. Vertical bars lines denote ± 95% confidence intervals.
Forests 11 01241 g004
Table 1. Annual litterfall production (±95% confidence interval) and annual precipitation during the 5-yr study period. Different superscript letters denote significant differences among study years.
YearAnnual Litterfall Production (Mg/ha/yr)Annual Precipitation (mm)
20145.963 ± 0.955 “ab”1148.0
20155.071 ± 0.603 “ab”1098.8
20166.173 ± 0.654 “a”885.2
20174.941 ± 0.502 “b”906.5
20186.109 ± 0.508 “a”945.2
Table 2. Total litterfall production (±95% confidence interval) over the entire study period in forests of different successional age classes. Different superscript letters denote significant differences among successional age classes.
Successional Age ClassTotal Litterfall Production (Mg/ha/yr)
I (3–5 years)4.070 ± 0.502 “a”
II (10–17 years)5.674 ± 0.274 “b”
III (18–25 years)6.460 ± 0.173 “c”
IV (60–79 years)5.604 ± 0.502 “b”
V (≥80 years)6.440 ± 0.281 “c”
Table 3. Multiple linear regression models relating litterfall production to vegetation variables, either for each year or over the entire study period.
YearModelsR2ajAIC∆ AICωi
2014(1) Y = 0.885 × Ht0.37913.772.690.004
(2) Y = 1.371 × Ht − 0.044 × Be0.49111.540.460.666
(3) Y = 0.02 × E − 0.054 × Be + 1.16Ht0.52911.080.000.003
2015(1) Y = 1.604 + 0.532 × Ht0.424−1.1560.6420.079
(2) Y = 0.141 × BAd0.464−1.4240.3740.255
(3) Y* = −0.037 + 0.966 × Ht + 0.019 × Bd 0.500−1.7980.0000.666
2016(1) Y = 1.812 + 0.684 × Ht0.624−5.1790.0000.079
(2) Y* = 1.437 − 0.04 × BAe + 0.793 × Ht0.608−3.7341.4450.255
(3) Y = 1.74 + 0.009 × Age0.607−3.0072.1720.666
2018(1) Y = 3.819 + 0.718 × Ht0.243−2.2604.2700.079
(2) Y = 2.09 + 0.224 × DBH0.320−3.0541.9130.255
(3) Y” =1.053 + 0.292 × DBH + 0.01 × BAd0.322−2.4080.0000.000
Total(1) Y = 3.772 + 0.115 × BAd0.516−2.6704.2700.124
(2) Y = 4.204 + 0.034 × Bd − 0.158 × BAe0.608−5.0271.9200.452
(3) Y* = 3.761 + 0.061 × Abd + 0.024 × Bd − 0.141 × BAe0.607−6.9400.0000.424
Y: litterfall production; Y* indicates multicollinearity between explanatory variables (VIF ≥ 2); Y”: model including non-significant parameters. The best model for each case is shown in boldface. BAd: basal area of deciduous species; Bd: aboveground biomass of deciduous species; BAe: basal area of evergreen species; Be: aboveground biomass of evergreen species; Ht: average tree height; DBH: average stem diameter; Age: successional age; R2aj: adjusted coefficient of determination; AIC: Akaike’s information criterion, ∆ AIC: Akaike delta score, ωi: Akaike weight. Vegetation was not censused in 2017.
Table 4. Models relating annual or seasonal litterfall production to climatic variables over the entire study period.
ModelR2ajAIC∆ AICѠi
annual
(1) Y = 9.328 − 0.003 × P0.944−18.1733.410.124
(2) Y* = 5.18 + 0.067 × RH − 0.04 × P0.981−24.8126.770.452
(3) Y* = −0.0015 × P + 0.001 × W + 0.00009 × ACTmin0.990−51.580.0000.424
seasonal
(1) Y = −7.345 + 2.071 × W0.6295.7589.7440.009
(2) Y” = 1.88 + 1.87 × V − 0.32 × Tmean0.6924.5498.5350.452
(3) Y = 2.16 × W + 0.0019 × ACTmax0.874−3.9860.0000.105
Y: litterfall production; Y* indicates multicollinearity between explanatory variables (VIF ≥ 2); Y”: model including non-significant parameters. The best model for each case is shown in boldface. P: precipitation, RH: relative humidity, W: wind speed, Tmean: mean temperature, ACTmax: cumulative maximum temperature, ACTmin: cumulative minimum temperature, R2aj: adjusted coefficient of determination; AIC: Akaike information criterion, ∆ AIC: Akaike delta score, ωi: Akaike weight.
Table 5. Multiple linear regression models relating average monthly litterfall production to climatic variables either for each year or over the entire study period.
YearModelR2ajAIC∆ AICωi
2014(1) Y = 4.215 − 0.045 × RH0.77−37.960.370.332
(2) Y = 1.625 − 0.06 × Tmax + 1.63 × DPV0.79−38.330.000.399
(3) Y*= 0.17 × RH − 0.21 × T + 6.81 × DPV0.79−37.540.790.269
2015(1) Y”= 0.81 − 0.032 × WG0.11−30.540.340.303
(2) Y”= 0.24 − 0.054 × Tmin + 0.0009 × ACTmax0.18−30.750.130.337
(3) Y”= −0.02 × WG − 0.05 × Tmin + 0.001 × ACTmax0.23−30.880.000.360
2016(1) Y= 1.31 − 0.059 × Tmin0.45−30.8310.830.003
(2) Y= -0.023 × RH − 0.003 × ACTmin0.75−39.871.790.289
(3) Y= 0.076 × Tmax − 0.003 × ACTmin0.80−41.660.000.720
2017(1) Y = 3.95 − 0.131 × Tmean0.43−38.564.630.133
(2) Y = 3.391 − 0.094 × Tmean − 0.035 ×Tmin0.76−43.050.140.433
(3) Y*= −0.37 + 0.13 × RH − 0.37 × Tmean + 4.08 × DPV0.77−43.190.000.433
2018(1) Y = 1.606 − 0.014 × RH0.45−33.603.120.049
(2) Y = 1.533 − 0.011 × RH − 0.001 × P0.55−35.361.360.459
(3) Y*= 0.07 × RH + 0.05 × Tmin − 1.79 × DPV0.61−36.720.000.492
Total(1) Y = 4.087 − 0.037 × RH0.24−150.008.130.079
(2) Y* = 5.195 − 0.051 × RH − 0.995 × DPV0.34−158.130.000.256
(3) Y*= 4.087 − 0.037 × RH − 0.01 × Tmin − 0.67 × DPV0.35−158.090.040.666
Y: litterfall production; Y* indicates multicollinearity between explanatory variables (VIF ≥ 2); Y”: model including non-significant parameters. The best model for each case is shown in boldface. P: precipitation, RH: relative humidity, Tmean: mean temperature, Tmin: minimum temperature, ACTmax: cumulative maximum temperature, ACTmin: cumulative minimum temperature, WG: wind gusts, DPV: vapor-pressure deficit, R2aj: adjusted coefficient of determination; AIC: Akaike’s information criterion, ∆ AIC: Akaike delta score, ωi: Akaike weight.
Publisher’s Note: MDPI stays neutral with regard to jurisdictional claims in published maps and institutional affiliations.

