Article

Complete Chloroplast Genome Sequences of Two Ehretia Trees (Ehretia cymosa and Ehretia obtusifolia): Genome Structures and Phylogenetic Analysis

by
Mohammad S. Alawfi
1,*,
Dhafer A. Alzahrani
1 and
Enas J. Albokhari
2
1
Department of Biological Sciences, Faculty of Sciences, King Abdulaziz University, Jeddah 21589, Saudi Arabia
2
Department of Biological Sciences, Faculty of Applied Sciences, Umm Al-Qura University, Makkah 24382, Saudi Arabia
*
Author to whom correspondence should be addressed.
Forests 2023, 14(7), 1486; https://doi.org/10.3390/f14071486
Submission received: 14 June 2023 / Revised: 29 June 2023 / Accepted: 18 July 2023 / Published: 20 July 2023
(This article belongs to the Special Issue Biodiversity, Conservation and Phylogeny of Trees)

Abstract

:
Ehretiaceae is a family in the order Boraginales. It contains more than 150 species. The Ehretiaceae classification has remained elusive and changed over time from subfamily to family, or vice versa. In this paper, we sequenced, characterized, and analyzed the complete chloroplast (cp) genomes of Ehretia cymosa and Ehretia obtusifolia, and their cp genomes were compared to those of related species. The length of the chloroplast genomes of E. cymosa was 156,328 bp, whereas that of E. obtusifolia was 155,961 bp. Each genome contained 114 genes, including 80 protein-coding genes, 4 rRNA genes, and 30 tRNA genes. Repeat analysis revealed that complement, forward, palindromic, and reverse repeats were present in the chloroplast genomes of both species. Simple sequence repeat analysis showed that the chloroplast genomes of E. cymosa and E. obtusifolia comprise 141 and 139 microsatellites, respectively. Phylogenetic analysis based on Bayesian and maximum likelihood analyses divided the order Boraginales into two well-supported clades. The first clade includes a single family (Boraginaceae), and the second clade includes three families (Ehretiaceae, Cordiaceae, and Heliotropiaceae). This study provides valuable genomic resources and insights into the evolutionary relationships within Boraginales.

1. Introduction

The Ehretiaceae (Ehretioideae) is a family of the flowering plant order Boraginales. The family, as most recently circumscribed, contains seven genera (Bourreria, Cortesia, Ehretia, Halgania, Lepidocordia, Rochefortia, and Tiquilia) and comprises more than 150 species widely spread in tropical and subtropical regions [1]. The Ehretiaceae members are mostly trees with the following characteristics: leaves are entire and alternate in arrangement; inflorescence is terminal or axillary; flowers are 5-merous; bisexual or unisexual; corolla is white, blue, or red; shape is tubular, campanulate, or rotate; five stamens, ovary in a slender terminal style, and two stigmas divided slightly or deeply; four ovules in two or four locules; fruit drupaceous, dry or fleshy [1,2,3].
Traditionally, members of Ehretiaceae have been classified as the subfamily Ehretioideae within the Boraginaceae family [4,5,6,7,8,9]. This classification is also supported by the Angiosperm Phylogeny Group (APG) and several systematic plant studies [10,11,12,13,14,15]. However, different phylogenetic studies in recent decades have recognized Ehretiaceae as a separate family within the order Boraginales [1,16,17,18,19,20,21]. Most research that has covered the evolutionary relationships of the family Ehretiaceae has used a few genes originating from mitochondrial, chloroplast, and nucleus DNA [22].
Genetic information allows researchers to determine the evolutionary relationships among organisms. The chloroplast (cp) genome contains functional genes that are essential to plant cells, and these genes offer valuable genetic data for comparative studies of the evolutionary relationships between plants [23]. A chloroplast is an organelle inside a plant cell that uses the photosynthetic process to transform light energy into chemical energy [24]. The structure, arrangement, and content of genes in the chloroplast genomes of angiosperm species are remarkably conserved [25]. The cp genome of flowering plant species has a circular quadripartite structure, rarely with multibranched linear structures [26]. The cp genome comprises two inverted repeat regions (IRs): a large single-copy region (LSC) and a small single-copy region (SSC) [27]. More than 5998 cp genome sequences have been reported in the National Center for Biotechnology Information (NCBI) database, demonstrating the widespread use of cp genome sequencing in plant phylogenetic research [28]. In comparison to using a few genes, the complete chloroplast genome can provide more accurate answers regarding evolutionary relationships [29].
To date, only four chloroplast genome sequences of the Ehretiaceae family (Ehretia acuminata, Ehretia. dicksonii, Ehretia. longiflora, and Tiquilia plicata) have been reported in the GenBank database. In this study, we sequenced the cp genomes of two species, namely Ehretia cymosa and Ehretia obtusifolia (Figure 1). The cp genome sequences of five Ehretia species, eight species from different Boraginales families, and two outgroup species from Gentianales and Lamiales were compared to observe the sequence variation and to understand the evolutionary relationships between the Ehretiaceae family and other families in the order. The analyses also provided valuable details about the features of the genomes, including their GC content, long and simple sequence repeats, RNA editing sites, utilization of codons, and IR junctions. The main goals of this study were to characterize and analyze the complete chloroplast genomes of E. cymosa and E. obtusifolia and provide insight into the phylogenetic relationships of Ehretiaceae at the family level.

2. Materials and Methods

2.1. Plant Samples and DNA Extraction

The following leaf samples were collected in Al-Baha Province, Saudi Arabia, on 19 March 2021: E. cymosa (19°44′36.1″ N 41°27′33.6″ E) and E. obtusifolia (19°44′33.6″ N 41°27′33.4″ E). Specimens were identified using morphological approaches. Total genomic DNA was extracted from leaves using the DNeasy Plant Mini Kit, and the genomic DNA’s quality and concentration were assessed using a Qubit fluorometer and agarose gel electrophoresis.

2.2. Sequencing and Assembly

Library construction and sequencing were carried out at BGI Genomics Company in Hong Kong using the DNBseq platform; the raw data were filtered by removing contamination, low-quality reads, and adaptor sequences using SOAPnuke v.2.1.7 software [30] to obtain clean data (10 GB) with 150 bp pair-end reads. Genome assembly was performed using NOVOPlasty v.4.3.1 [31]; the complete chloroplast genome sequence of E. dicksonii (MZ555766) was used as the reference genome to assemble the E. cymosa and E. obtusifolia chloroplast genomes. Finally, a circular contig comprising the complete cp genome sequence was generated for each species.

2.3. Gene Annotation

Annotation and gene prediction of complete chloroplast genomes were performed using GeSeq [32] and corrected manually using Sequin 15.5 “http://www.ncbi.nlm.nih.gov/Sequin/ (accessed on 12 February 2023)”. The circular map of the cp genome was drawn using OGDRAW 1.3.1 [33]. Finally, the results of the cp genome sequences were submitted to GenBank with the following accession numbers: E. cymosa (OP679792) and E. obtusifolia (OQ730227).

2.4. Codon Usage and RNA Editing Sites

MEGA 6.0 [34] was used to analyze the sequences and determine the base composition, relative synonymous codon, and codon usage. The RNA editing sites in the protein-coding genes of E. cymosa and E. obtusifolia were predicted using the PREPACT 3.0 tool [35]. The prediction was performed on the BLASTX analysis mode using Arabidopsis thaliana (NC_000932.1) and Pisum sativum (NC_014057.1) as reference sequences, with the cutoff E-value set to 0.8.

2.5. Repeat Analysis of Chloroplast Genomes

The long repeats (complement, forward, palindromic, and reverse) were detected using REPuter v.2 software [36]. The minimal repeat size was set at 15 bp and the identified similarity between the repeat sequences was more than 90%. Using MISA v.2.1 software [37], simple sequence repeats (SSRs) were detected. The parameters used were 8, 5, 4, 3, 3, and 3, to identify mon, di, tri, tetra, penta, and hexa microsatellite repeats, respectively.

2.6. Characterization of Substitution Rate

The protein-coding sequences were separately aligned from the complete chloroplast sequences of E. cymosa and E. obtusifolia using Geneious software 2023.0.4 [38]. DNAsp v5 software [39] was used to determine the nonsynonymous (dN) and synonymous (dS) substitution rates and to reveal the genes that were under selective pressure.

2.7. Genome Comparison

The chloroplast genomes of E. cymosa and E. obtusifolia were analyzed and compared with those of the other Ehretia species available in the GenBank database: E. acuminata (MW801108.1), E. dicksonii (MZ555766.1), and E. longiflora (MW801239.1), using the mVISTA alignment program [40] in Shuffle-LAGAN mode. The cp genome of E. cymosa was set as the reference. Comparing and visualizing the boundaries of the LSC, SSC, and IR junction sites among the five Ehretia species was performed using the IRscope tool [41]. Although the chloroplast genomes of E. acuminata and E. longiflora were available in the GenBank, both genomes were in unverified status (lack annotation). Therefore, we performed the annotation and gene prediction of both genomes to use in our analyses.

2.8. Phylogenetic Analysis

A comparative analysis was performed using the complete chloroplast genome sequences of five Ehretia species (E. acuminata, E. cymosa, E. dicksonii, E. longiflora, and E. obtusifolia), eight taxa representing three families belonging to the Boragianles order (Boraginaceae, Cordiaceae, and Heliotropiaceae), and two species from the Gentianaceae and Lamiaceae families, which were used as outgroups. The MAFFT v.7.520 software [42] was used (default settings) to align all the sequences. The phylogenetic trees were constructed based on two analyses: Bayesian inference (BI) using MrBayes v.3.2.7 [43] and maximum likelihood (ML) using IQ-TREE version v.2.2.2.6 [44]. First, BI analysis was carried out using the following settings: run for 1,000,000 generations, printing and sampling every 500 generations, and the best substitution model (GTR + G), which was selected using jModelTest version 3.7 [45]. Second, ML analysis was carried out using the following settings: 10,000 ultra-fast bootstrap (UFBOOT) replicates and the best substitution model (TVM + F + I + G4), which was selected using ModelFinder [46].

3. Results

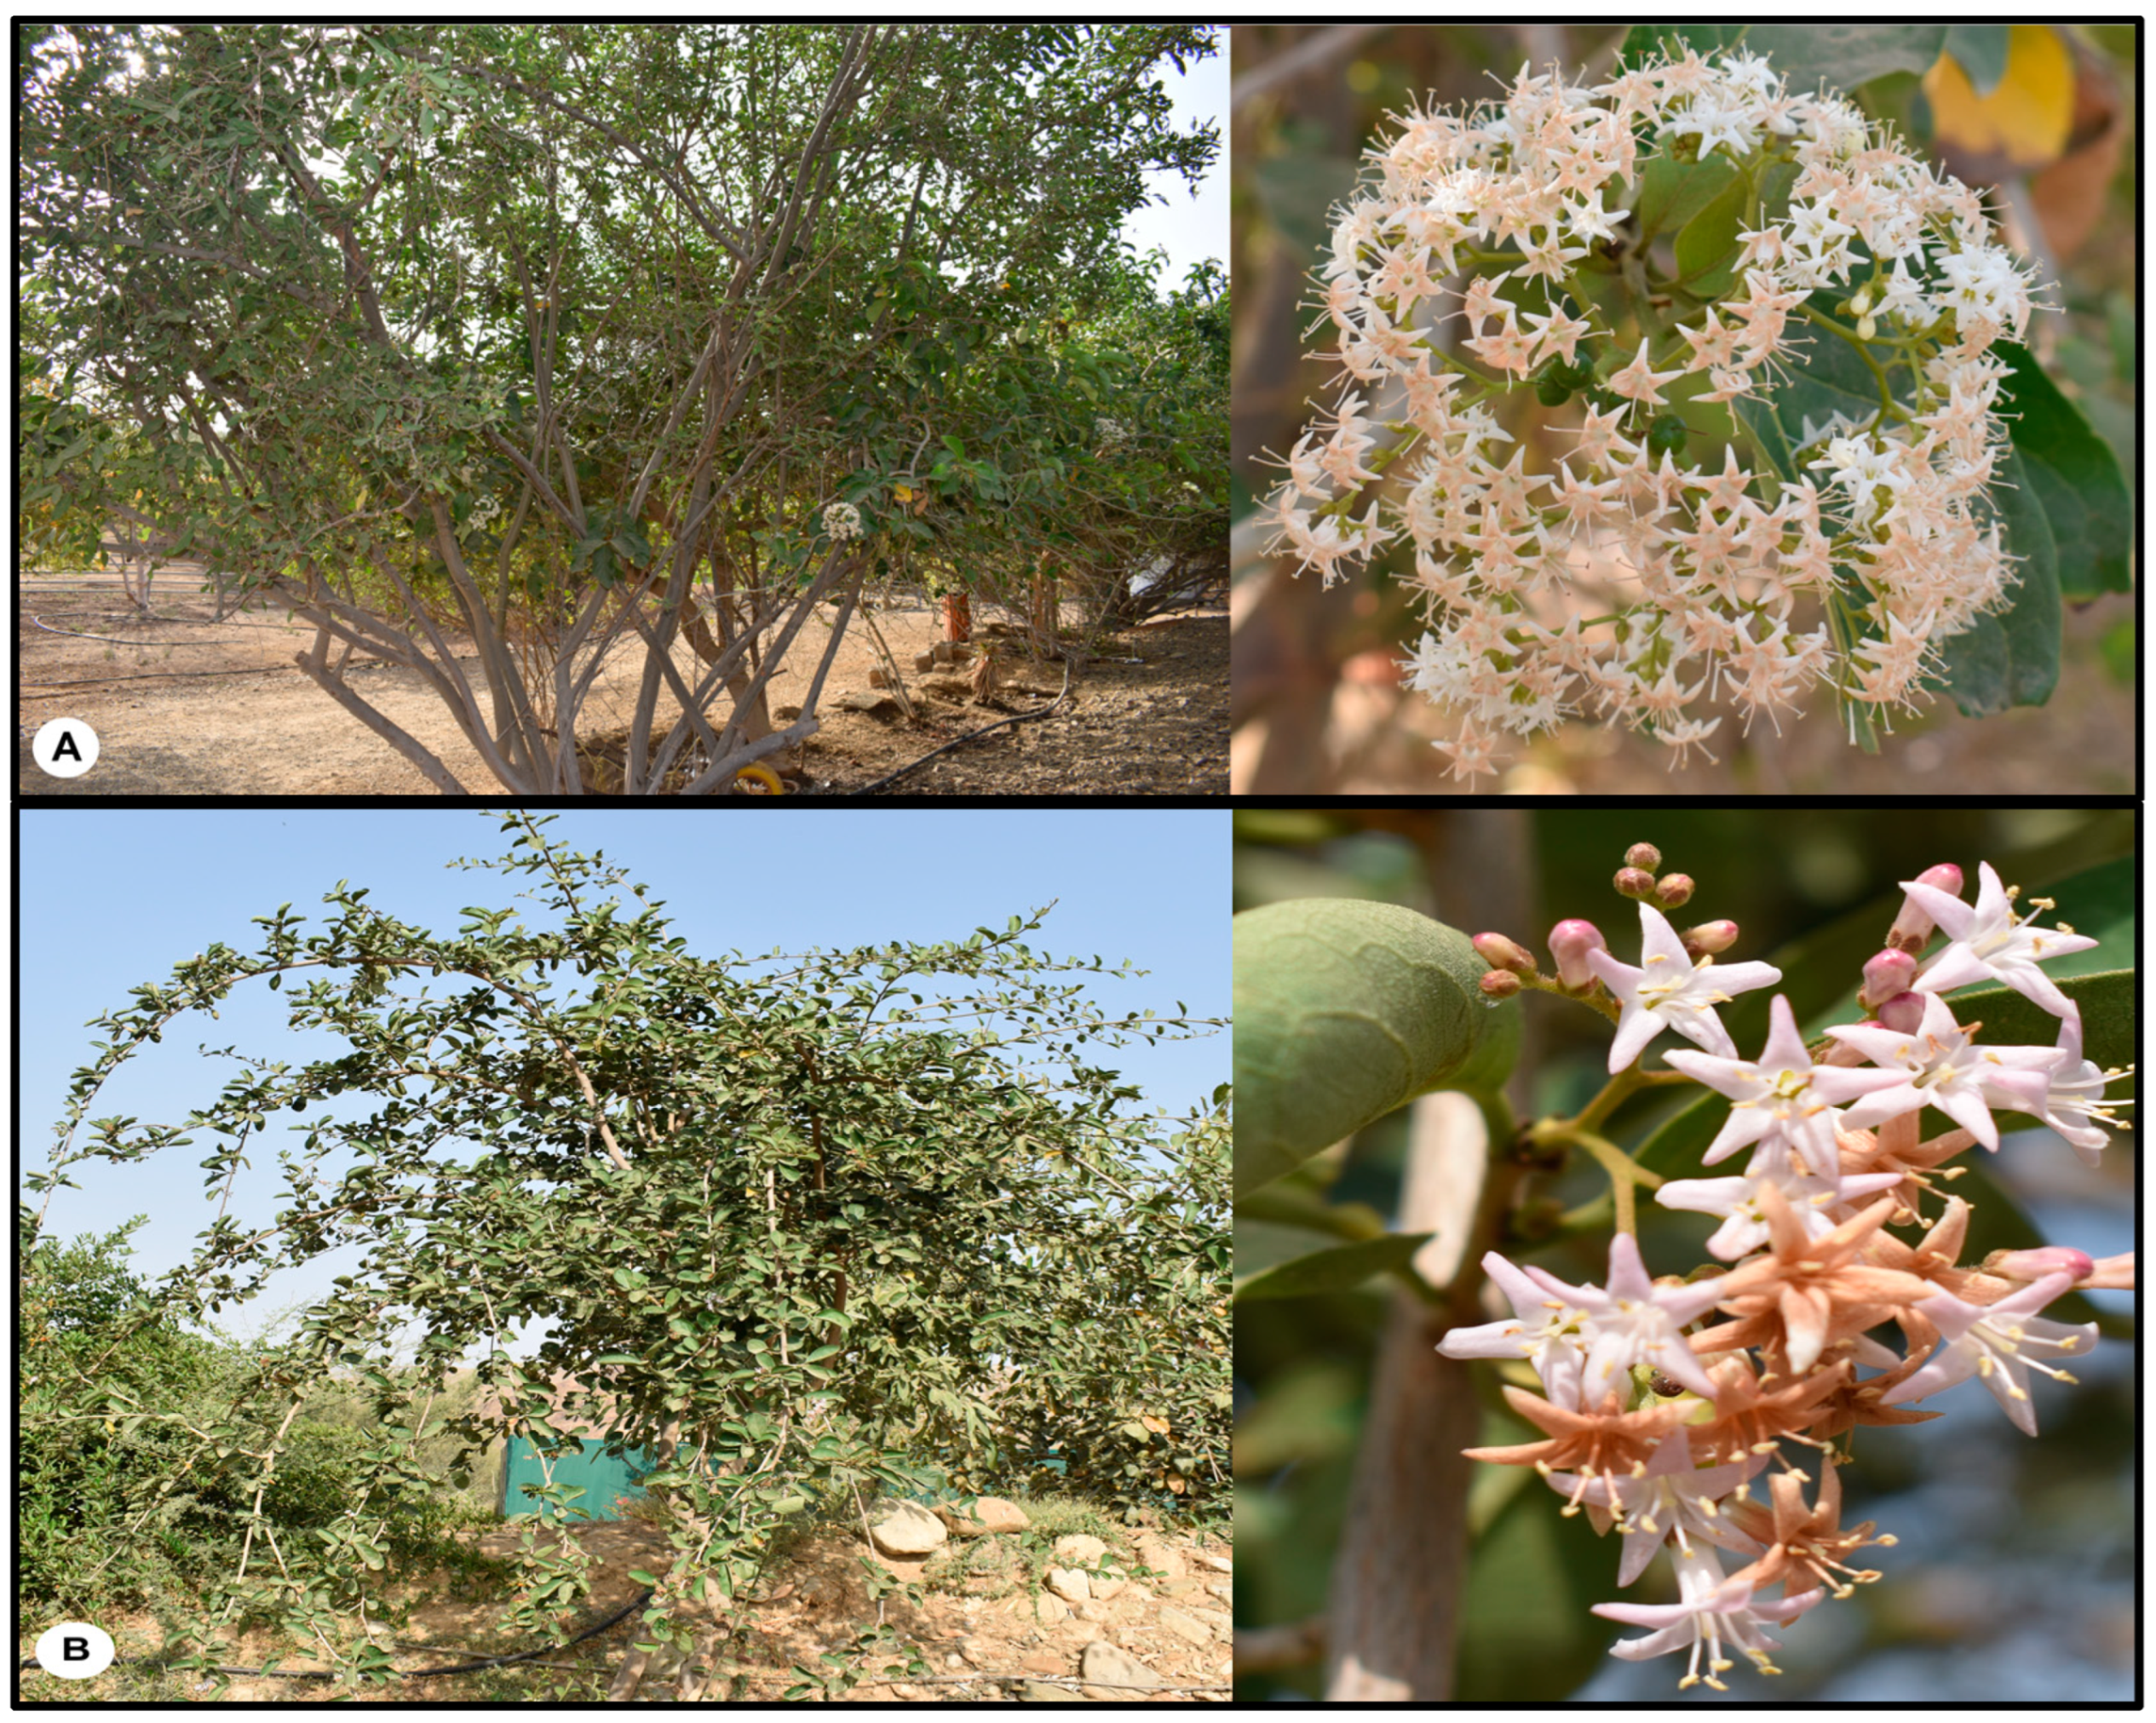
3.1. Characteristics of E. cymosa and E. obtusifolia
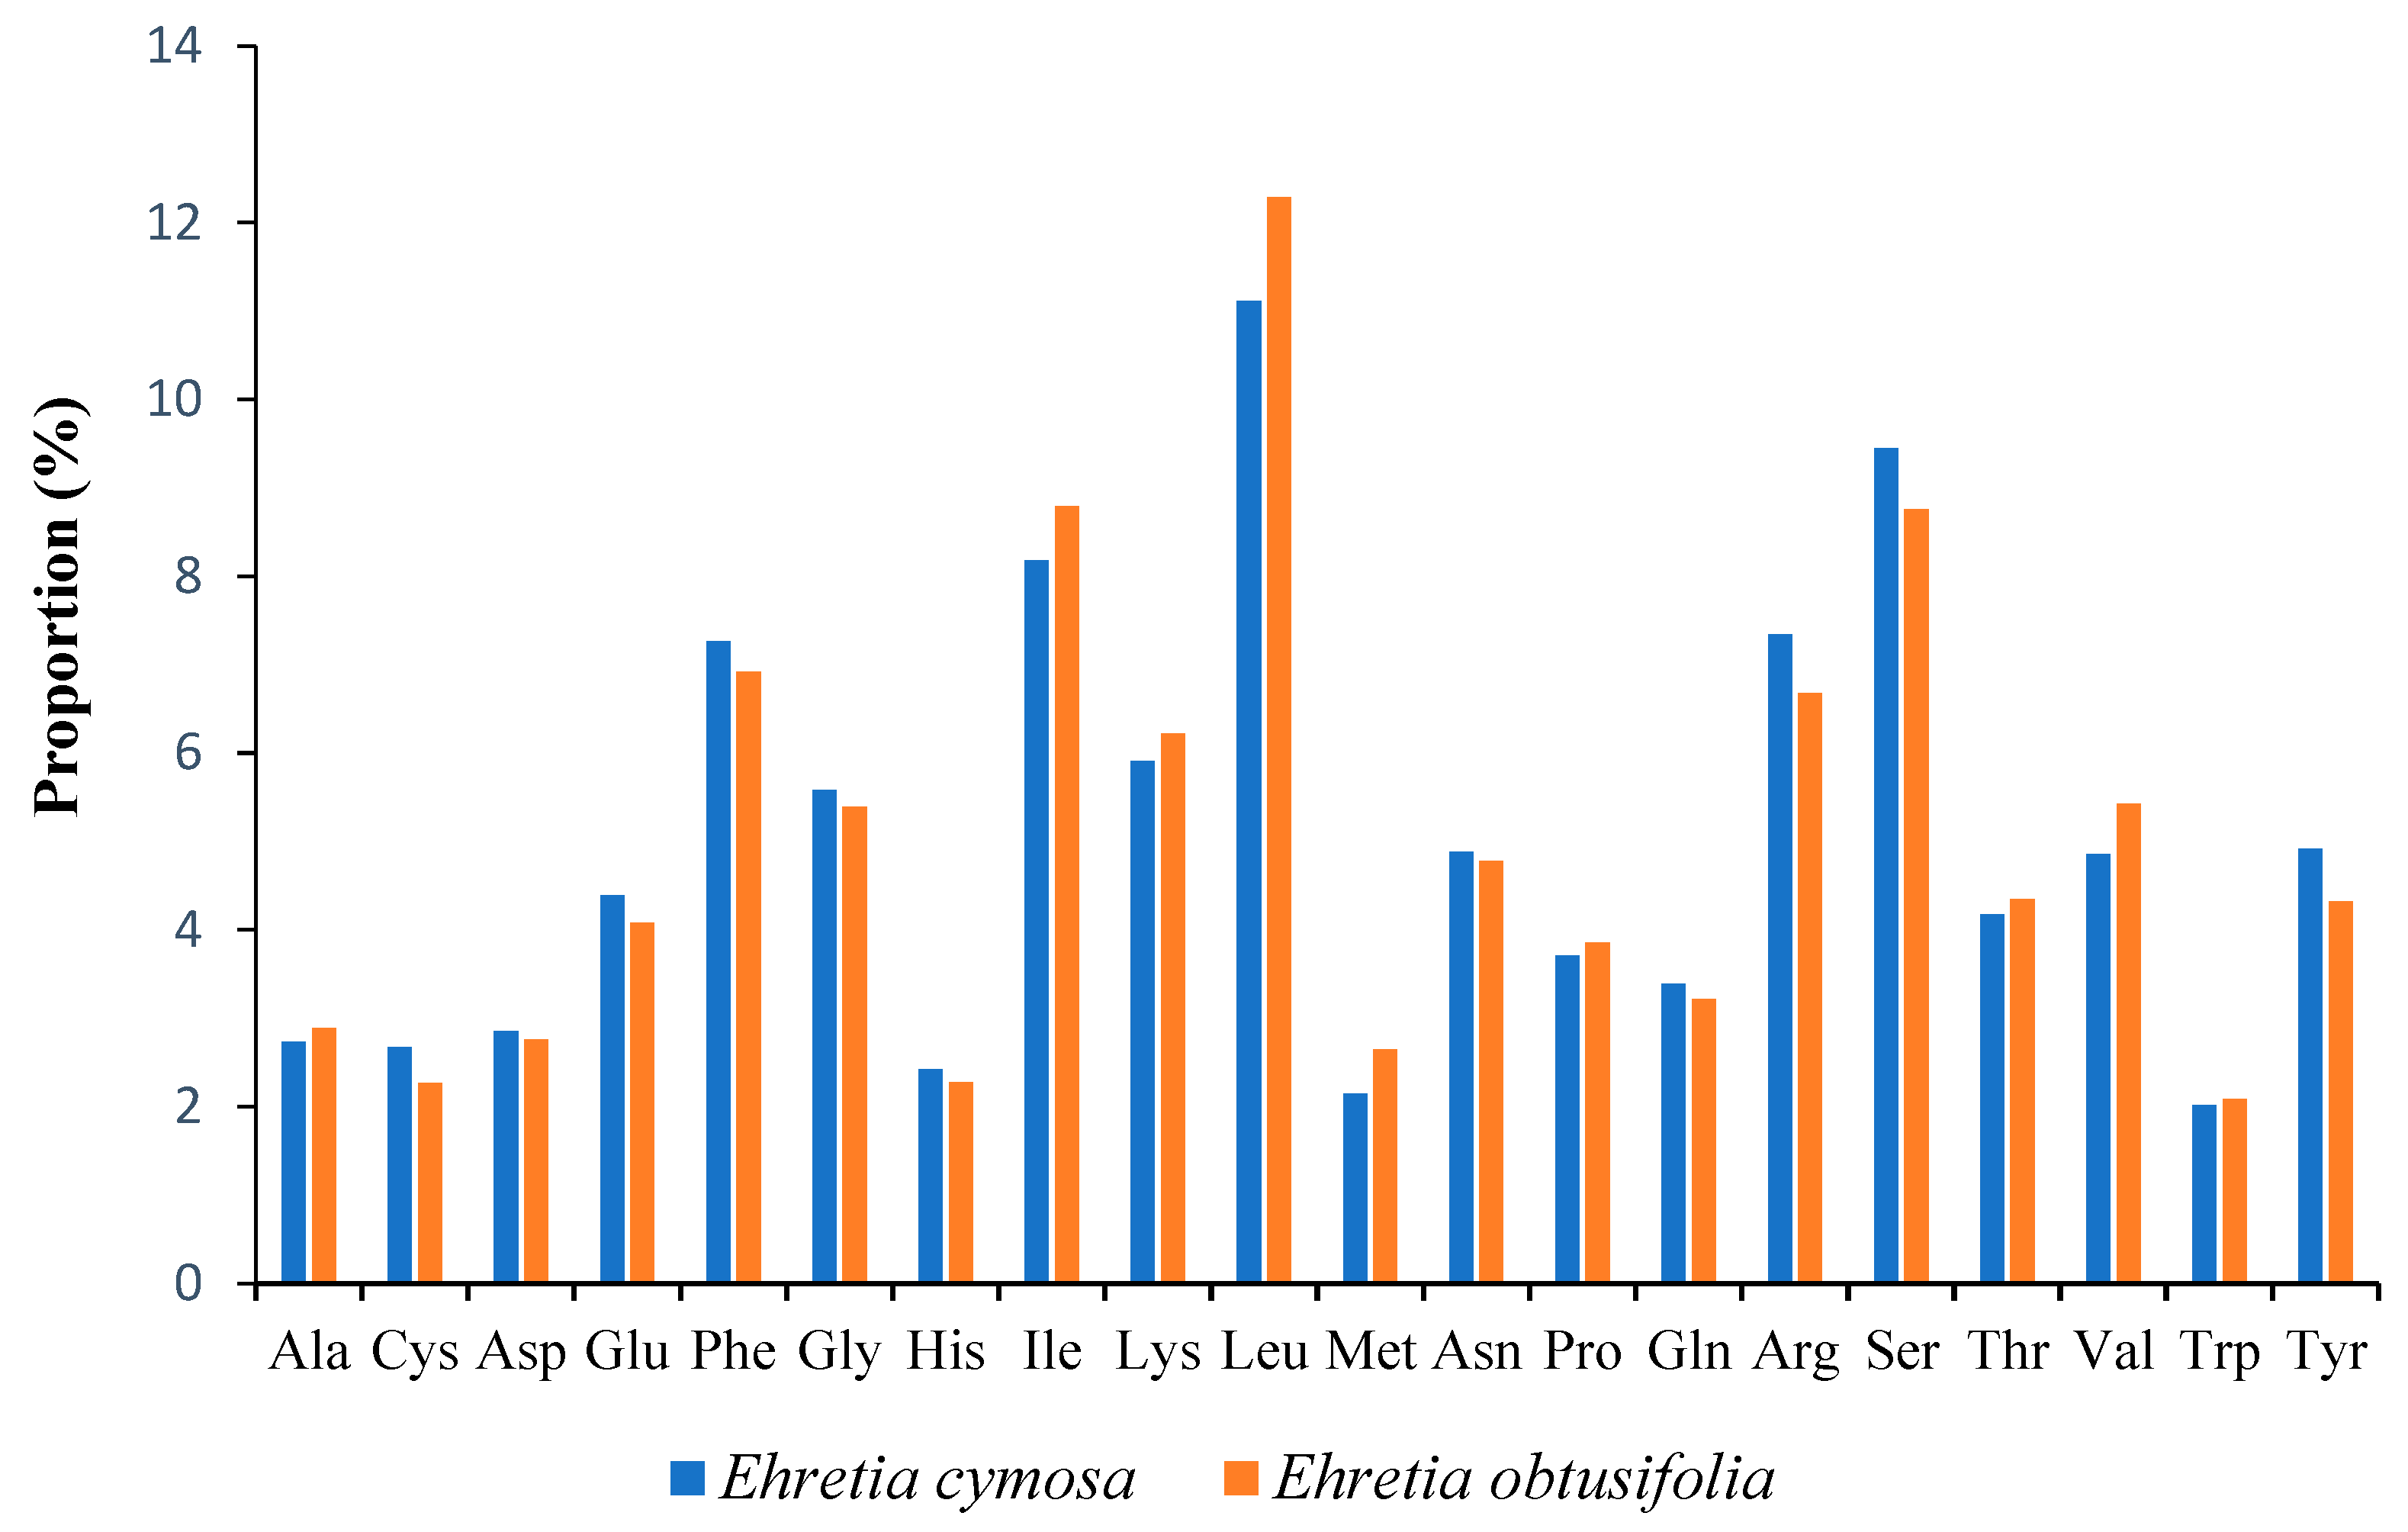
The complete chloroplast genomes of E. cymosa and E. obtusifolia were found to be 156,328 bp and 155,961 bp in size, respectively, and they had a circular and quadripartite structure (Table 1 and Figure 2). The cp genomes of E. cymosa and E. obtusifolia consisted of the LSC region with a length of 86,624 bp and 86,211 bp, respectively; the SSC region with a length of 18,142 bp and 18,154 bp, respectively; and a pair of the IR regions with a length of 25,781 bp and 25,798 bp, respectively (Table 1). Overall, the GC content of E. cymosa was determined to be 37.86%, whereas the GC content of E. obtusifolia was 37.87%. Moreover, the IR regions had a higher GC content, ranging from 43.17% in E. cymosa to 43.18% in E. obtusifolia. The LSC regions had GC contents of 35.91% in both genomes. The SSC regions had the lowest GC content, ranging from 32.15% in E. cymosa to 32.01% in E. obtusifolia (Table 1).
In addition, the cp genomes of E. cymosa and E. obtusifolia comprised a total of 134 genes. The number of unique genes was 114, 19 of which were duplicated in the IR regions; the rps12 gene was present in the LSC region as well as duplicated in the IR regions (Table S1). In both genomes, there were 80 protein-coding genes, 4 rRNA genes, and 30 tRNA genes. More specifically, the LSC region comprised 60 protein-coding genes and 22 tRNA genes; the SSC region comprised 12 protein-coding genes and 1 tRNA gene; and the IR regions comprised 8 protein-coding genes, 4 rRNA genes, and 7 tRNA genes. Introns were found in some of the tRNA and protein-coding genes of both genomes. A total of 18 of the 114 unique genes comprised introns. In this regard, 6 were tRNA genes and 12 were protein-coding genes, while 16 genes had 1 intron and 2 genes (clpP1 and ycf3) had 2 introns (Table S2). The longest intron was present in the trnK-UUU gene, where it was 2469 bp in length in E. cymosa and 2475 bp in length in E. obtusifolia (Table S2).

3.2. Codon Usage

The protein-coding and tRNA sequences of E. cymosa and E. obtusifolia were used to determine the frequency of codon usage in both species. The relevant sequence lengths were 82,542 bp in E. cymosa and 82,181 bp in E. obtusifolia. The cp genome of E. cymosa included 27,513 codons, with leucine (11.11%) being the most common and tryptophan (2.02%) the least common (Figure 3). Similarly, the cp genome of E. obtusifolia featured 27,393 codons, with leucine (12.29%) again being the most common and tryptophan (2.09%) the least common (Figure 3). The results of the analysis (Tables S3 and S4) revealed that 33 of the 64 codons in both genomes had an RSCU value of <1 (most of them had a C/G ending), whereas 31 of the 64 codons had an RSCU value of >1 (most of them had an A/U ending). Moreover, all the amino acids exhibited codon usage bias except for methionine and tryptophan, both of which had RSCU values of 1.

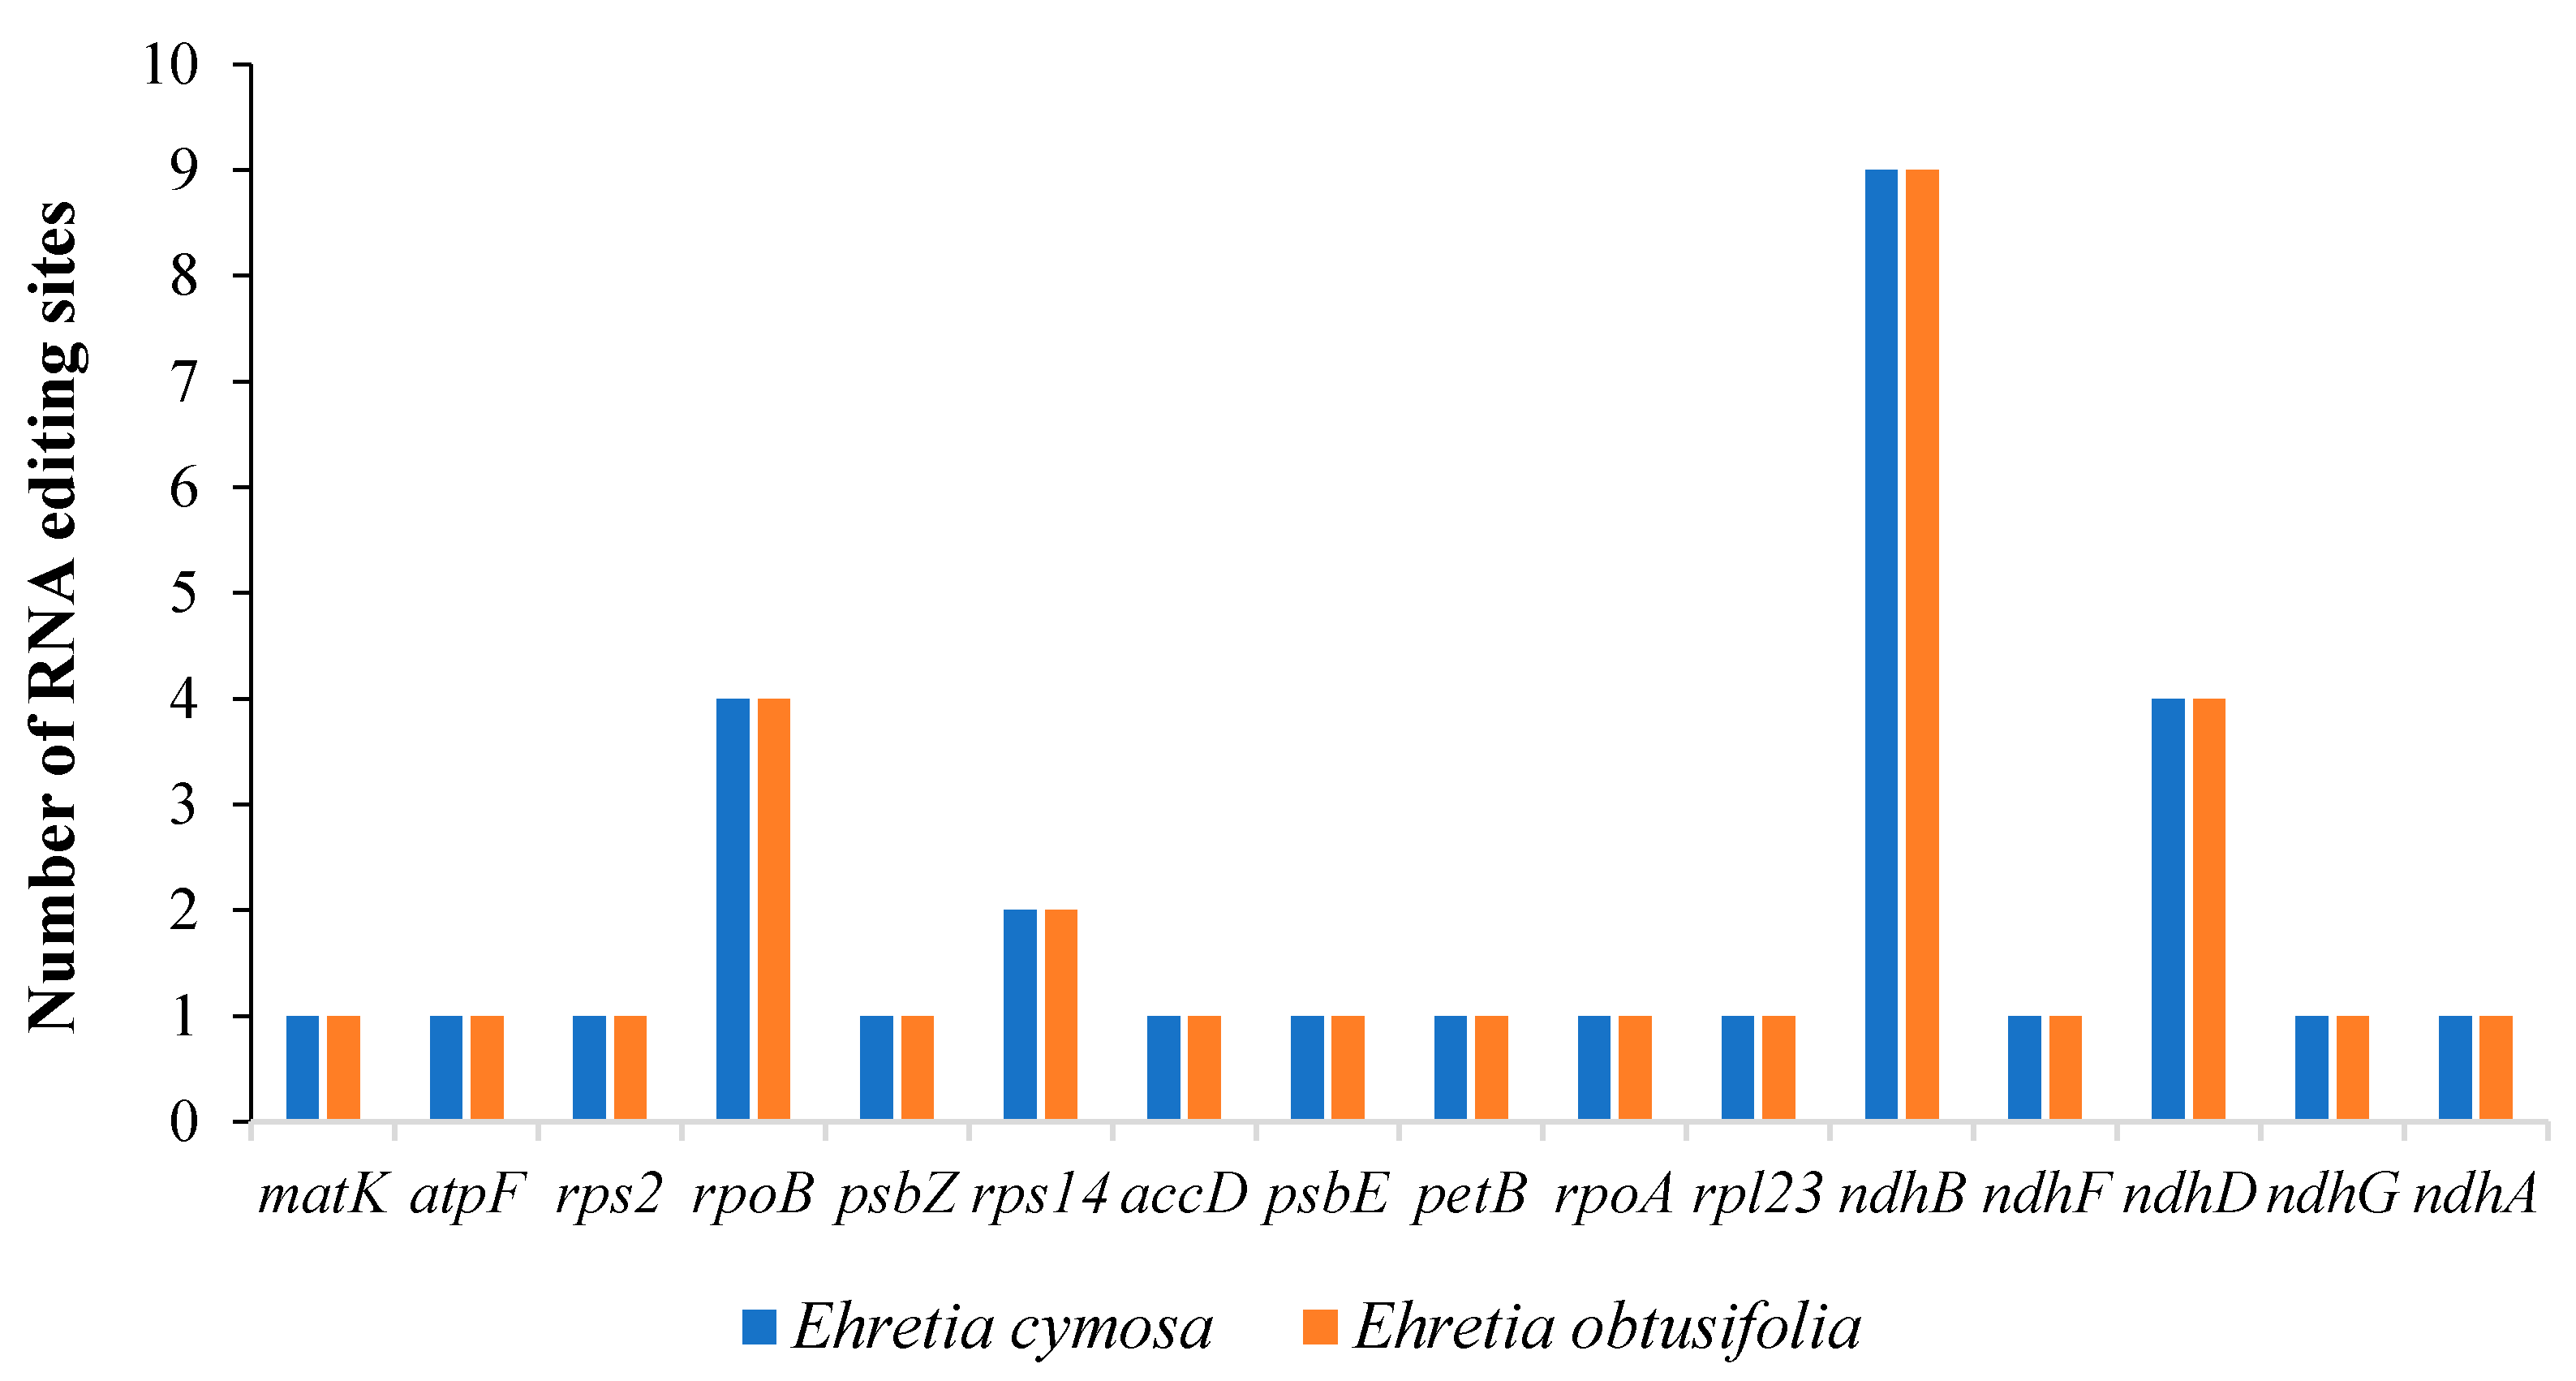
3.3. RNA Editing Sites
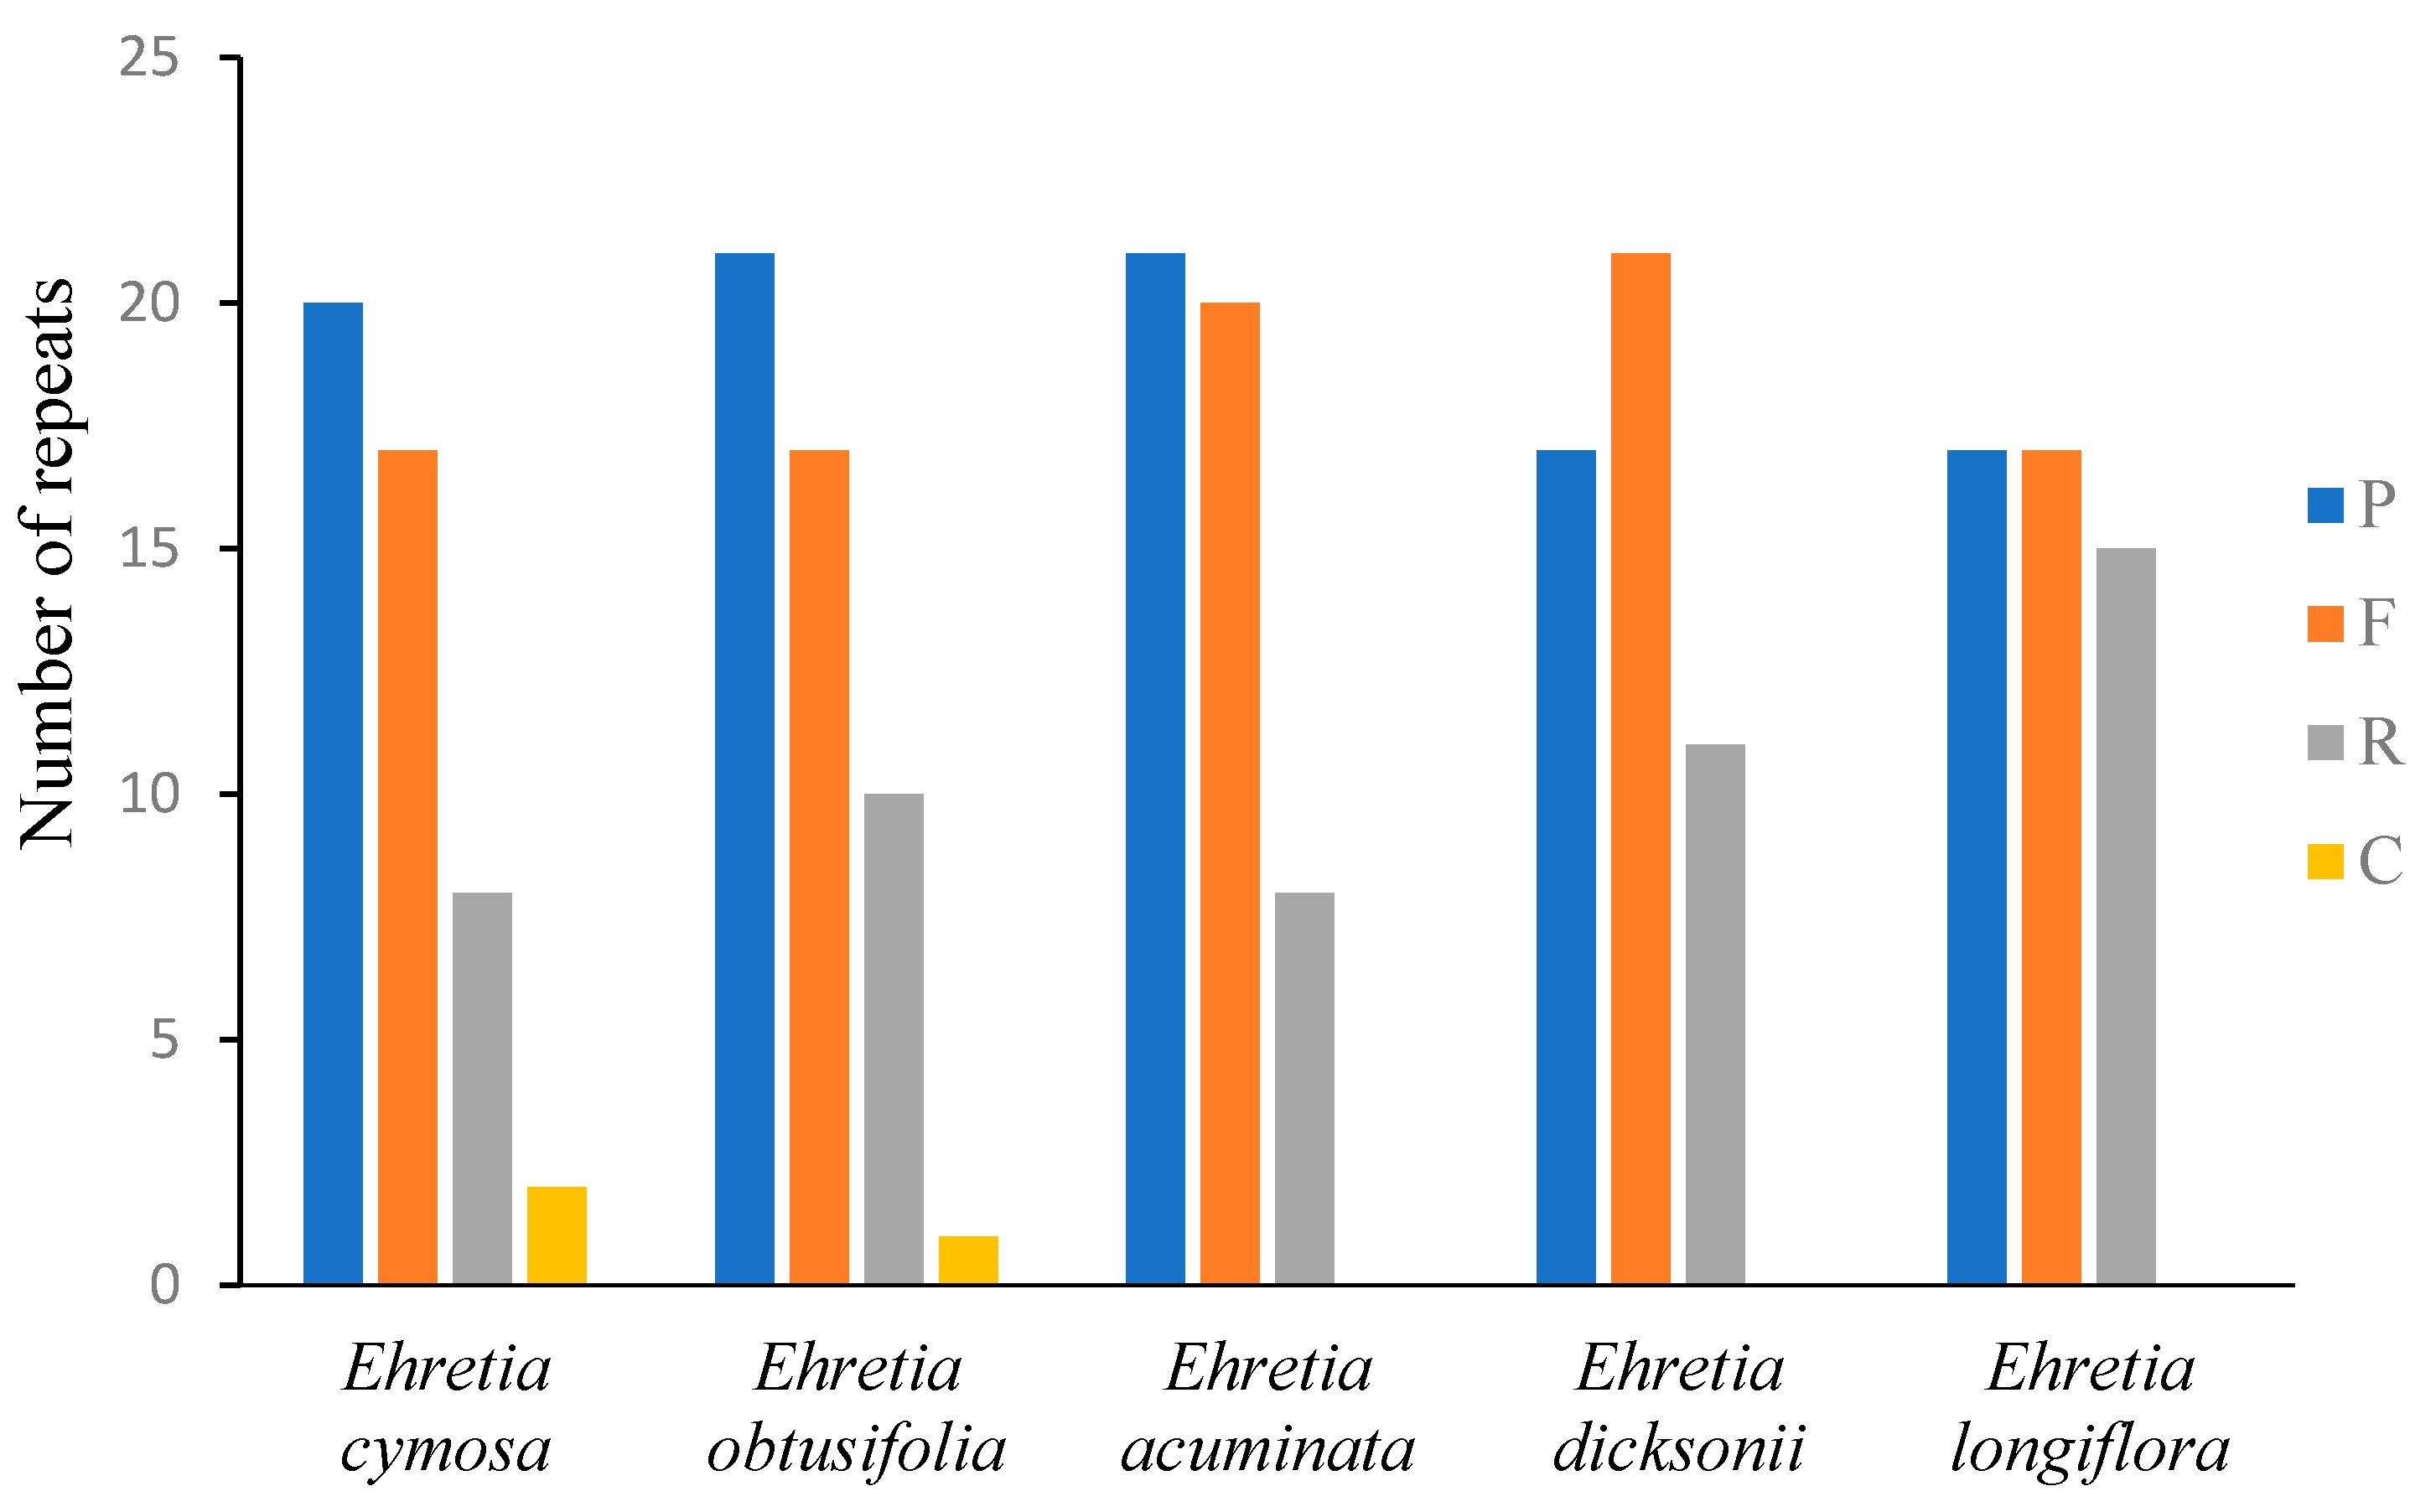
The RNA editing sites (C-U editing) in E. cymosa and E. obtusifolia chloroplast genomes were predicted using the PREPACT tool. A total of 31 RNA editing sites were predicted in each genome, distributed across 16 protein-coding genes. The ndhB gene had the most RNA editing sites (nine), followed by the ndhD and rpoB genes (four each), while the remaining genes had one or two editing sites (matK, atpF, rps2, psbZ, rps14, accD, psbE, petB, rpoA, rpl23, ndhF, ndhG, and ndhA) (Figure 4 and Table S5). In both species, 90.32% of the editing sites were found in the second position of the triplet codon, while 9.68% appeared in the first position of the triplet codon. The analysis also revealed that serine to leucine and proline to leucine were the most common amino acid conversions.

3.4. Long Repeats

The long repeat sequences in the E. cymosa and E. obtusifolia chloroplast genomes were identified using the REPuter program. The results revealed that both genomes contained all four types of long repeats (complement, forward, palindromic, and reverse), with 47 repeats found in E. cymosa and 49 repeats in E. obtusifolia. More specifically, the analysis of the E. cymosa and E. obtusifolia cp genomes identified 2 and 1 complementary repeats, respectively; 20 and 21 palindromic repeats, respectively; 8 and 10 reverse repeats, respectively; and 17 forward repeats in each genome (Figure 5 and Tables S6 and S7). The majority of the repeats in E. cymosa were between 18 bp and 24 bp in size (82.97%), followed by those between 26 bp and 29 bp (12.76%), and between 41 bp and 44 bp (4.25%). In E. obtusifolia, the majority of the repeats were between 18 bp and 24 bp in size (85.10%), followed by those between 26 bp and 32 bp (14.28%), and between 41 bp and 44 bp (4.08%).
The intergenic spacer regions in E. cymosa and E. obtusifolia harbored 48.93% and 52.04% of the repeats, respectively. The protein-coding genes contained 34.04% of the repeats in E. cymosa and 30.61% of the repeats in E. obtusifolia, whereas the tRNA genes contained 17.03% of the repeats in E. cymosa and 17.35% of the repeats in E. obtusifolia (Tables S6 and S7). In addition, we compared the results concerning the long repeat types between E. cymosa and E. obtusifolia, and the other Ehretia species available in the GenBank database (E. acuminata, E. dicksonii, and E. longiflora). The analysis revealed the absence of the complementary repeat type in all the species, except for E. cymosa and E. obtusifolia (Figure 5). Moreover, the palindromic repeat was found to be the most common repeat type in all the taxa except for E. dicksonii, in which the forward repeat was the most common type (Figure 5).

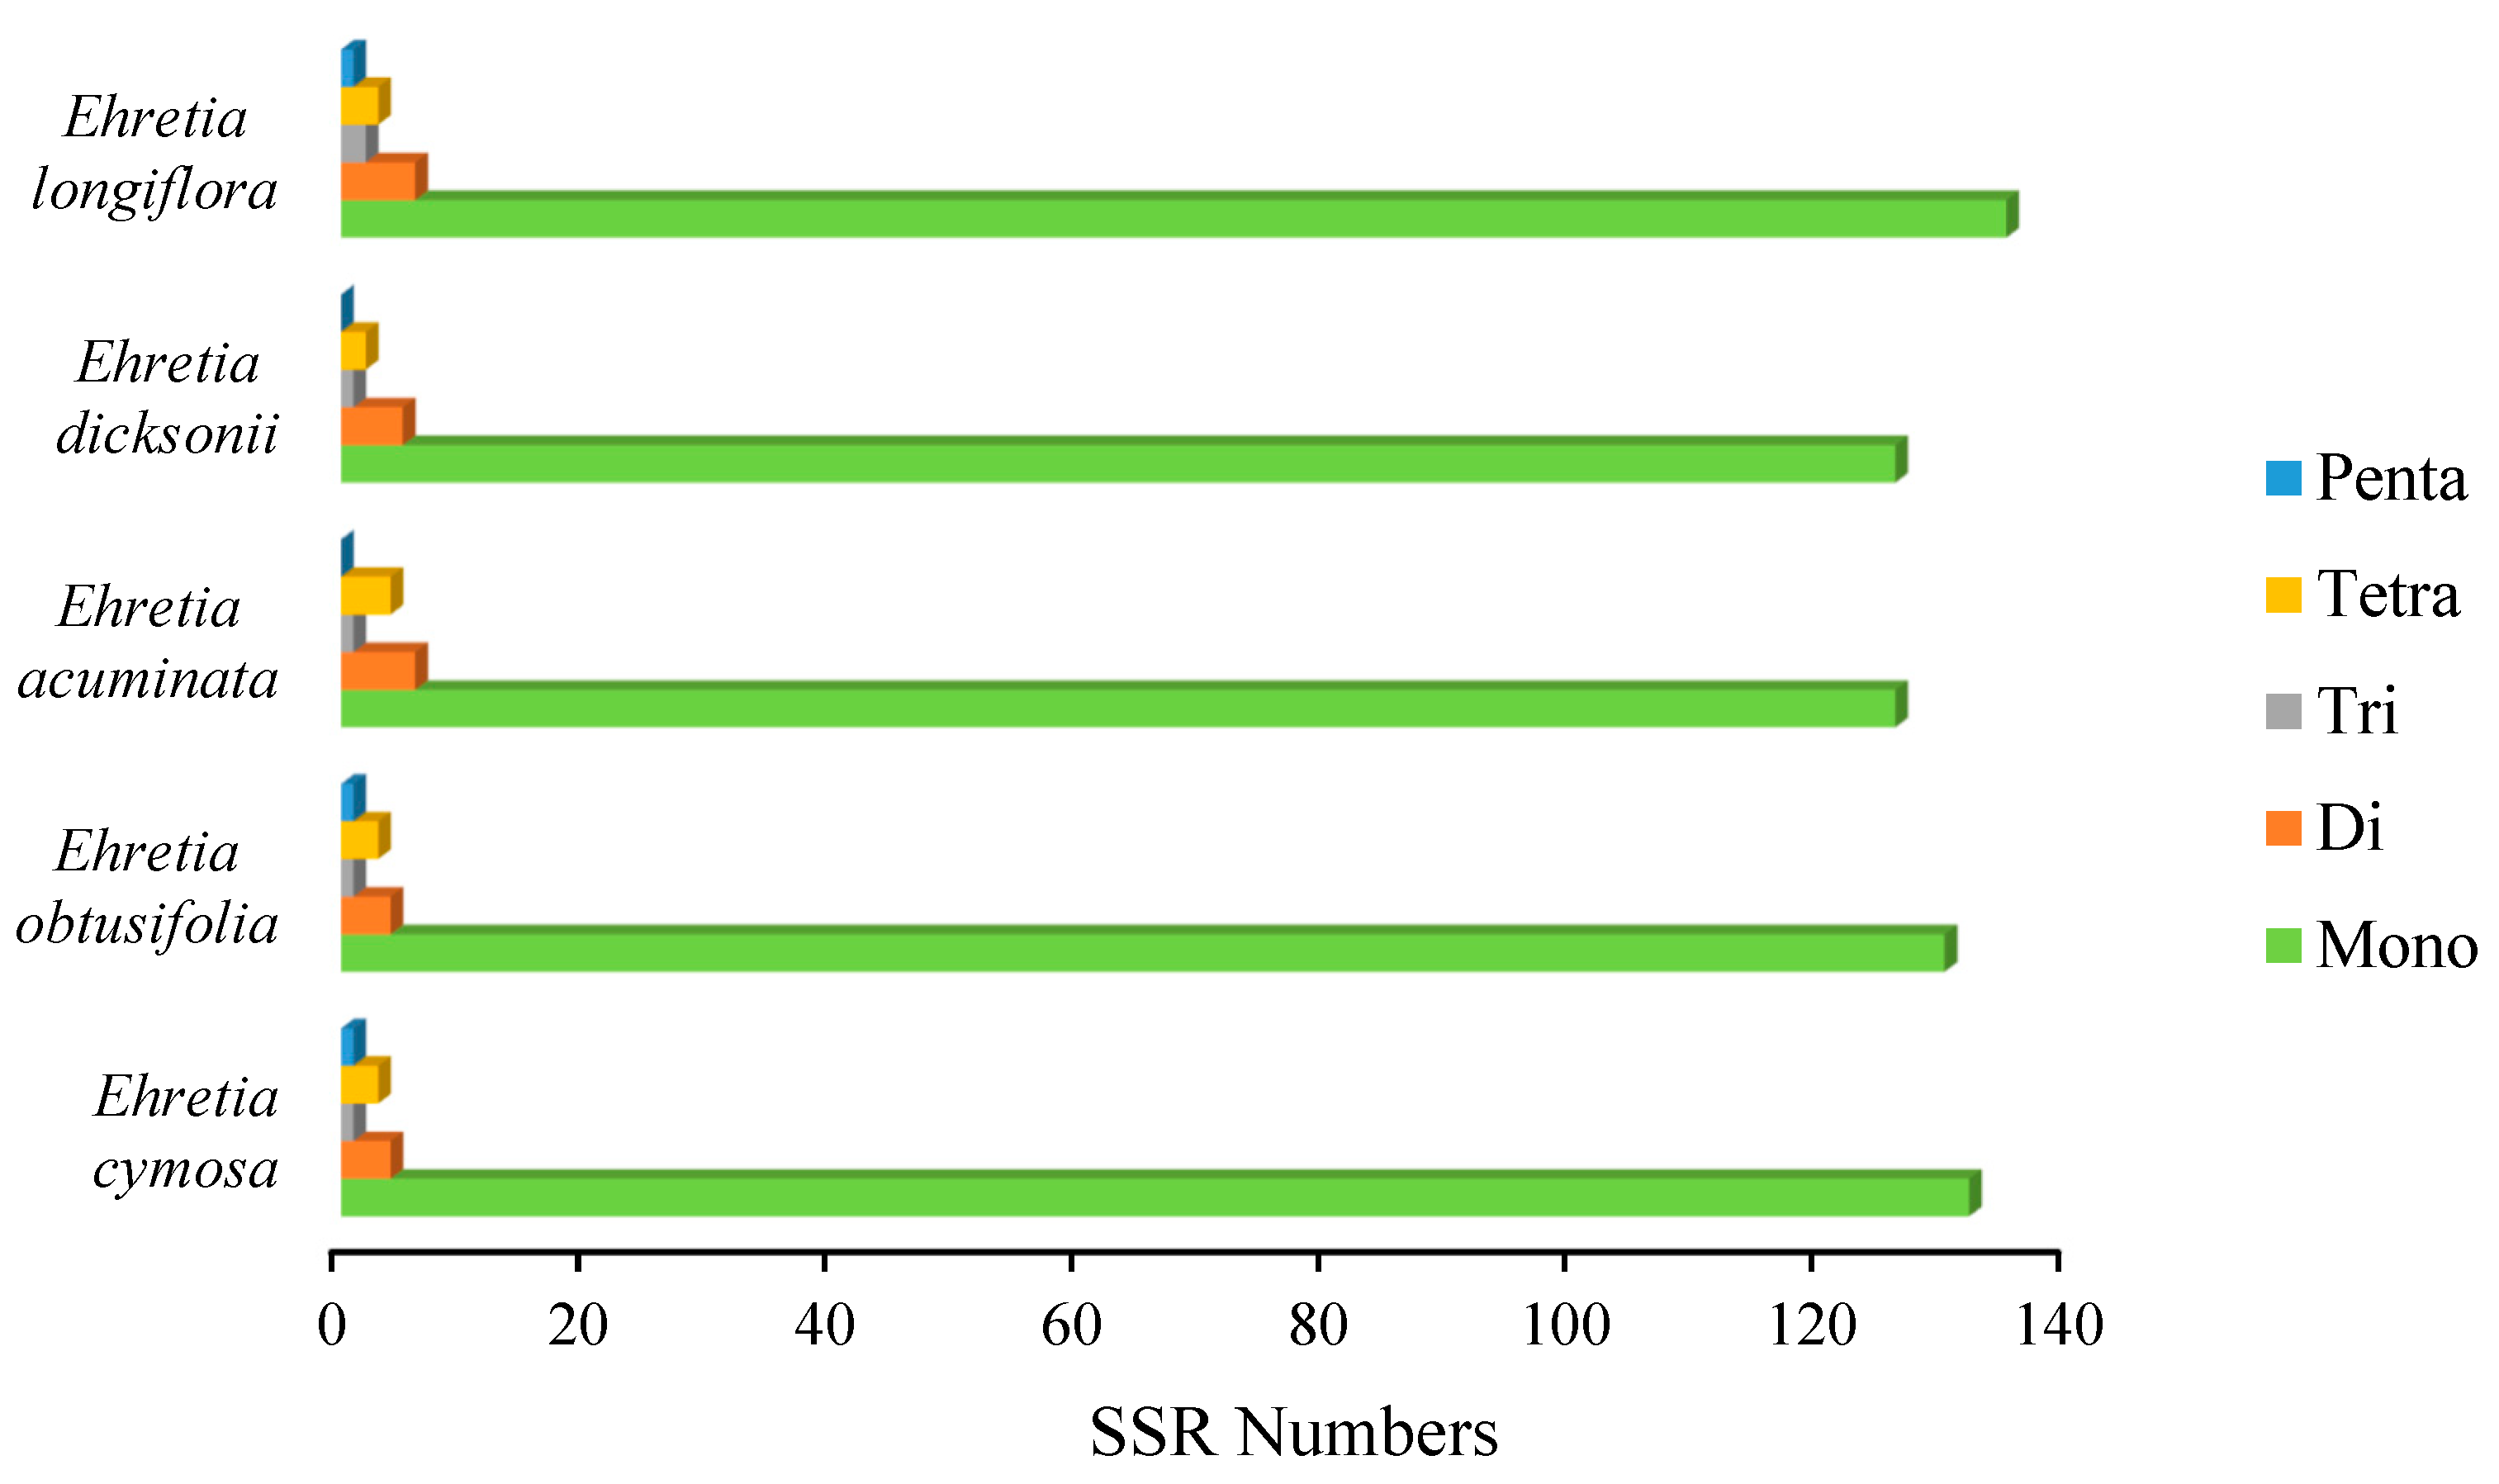
3.5. Simple Sequence Repeats

Simple sequence repeats (SSRs), which are also referred to as microsatellites, were found to be spread throughout both genomes. Indeed, the cp genomes of E. cymosa and E. obtusifolia comprised 141 SSRs and 139 SSRs, respectively (Tables S8 and S9). In the cp genome of E. cymosa, most of the SSRs were mononucleotides (93.61%), with the highest frequency (98.48%) of A/T motif, followed by C/G (1.52%) (Table 2). In addition, the cp genome of E. cymosa contained one dinucleotide (AT/AT), one trinucleotide (AAG/CTT), two tetranucleotides (AAAC/GTTT and AAAT/ATTT), and one pentanucleotide (AATCC/ATTGG). Similarly, in the cp genome of E. obtusifolia, most of the SSRs were mononucleotides (93.52%), with the highest frequency (98.45%) of A/T motif, followed by C/G (1.55%) (Table 2). The cp genome of E. obtusifolia also contained one dinucleotide (AT/AT), one trinucleotide (AAG/CTT), two tetranucleotides (AAAC/GTTT and AAAT/ATTT), and one pentanucleotide (AATCC/ATTGG).
A comparative analysis of the SSR types was performed using the other Ehretia species available in the GenBank database (E. acuminata, E. dicksonii, and E. longiflora). The results showed that the SSR types ranged from mononucleotide to pentanucleotide repeats (Figure 6). In this regard, mononucleotide, dinucleotide, trinucleotide, and tetranucleotide repeats were detected in all the genomes, whereas pentanucleotide repeats were absent from E. acuminata and E. dicksonii (Figure 6).

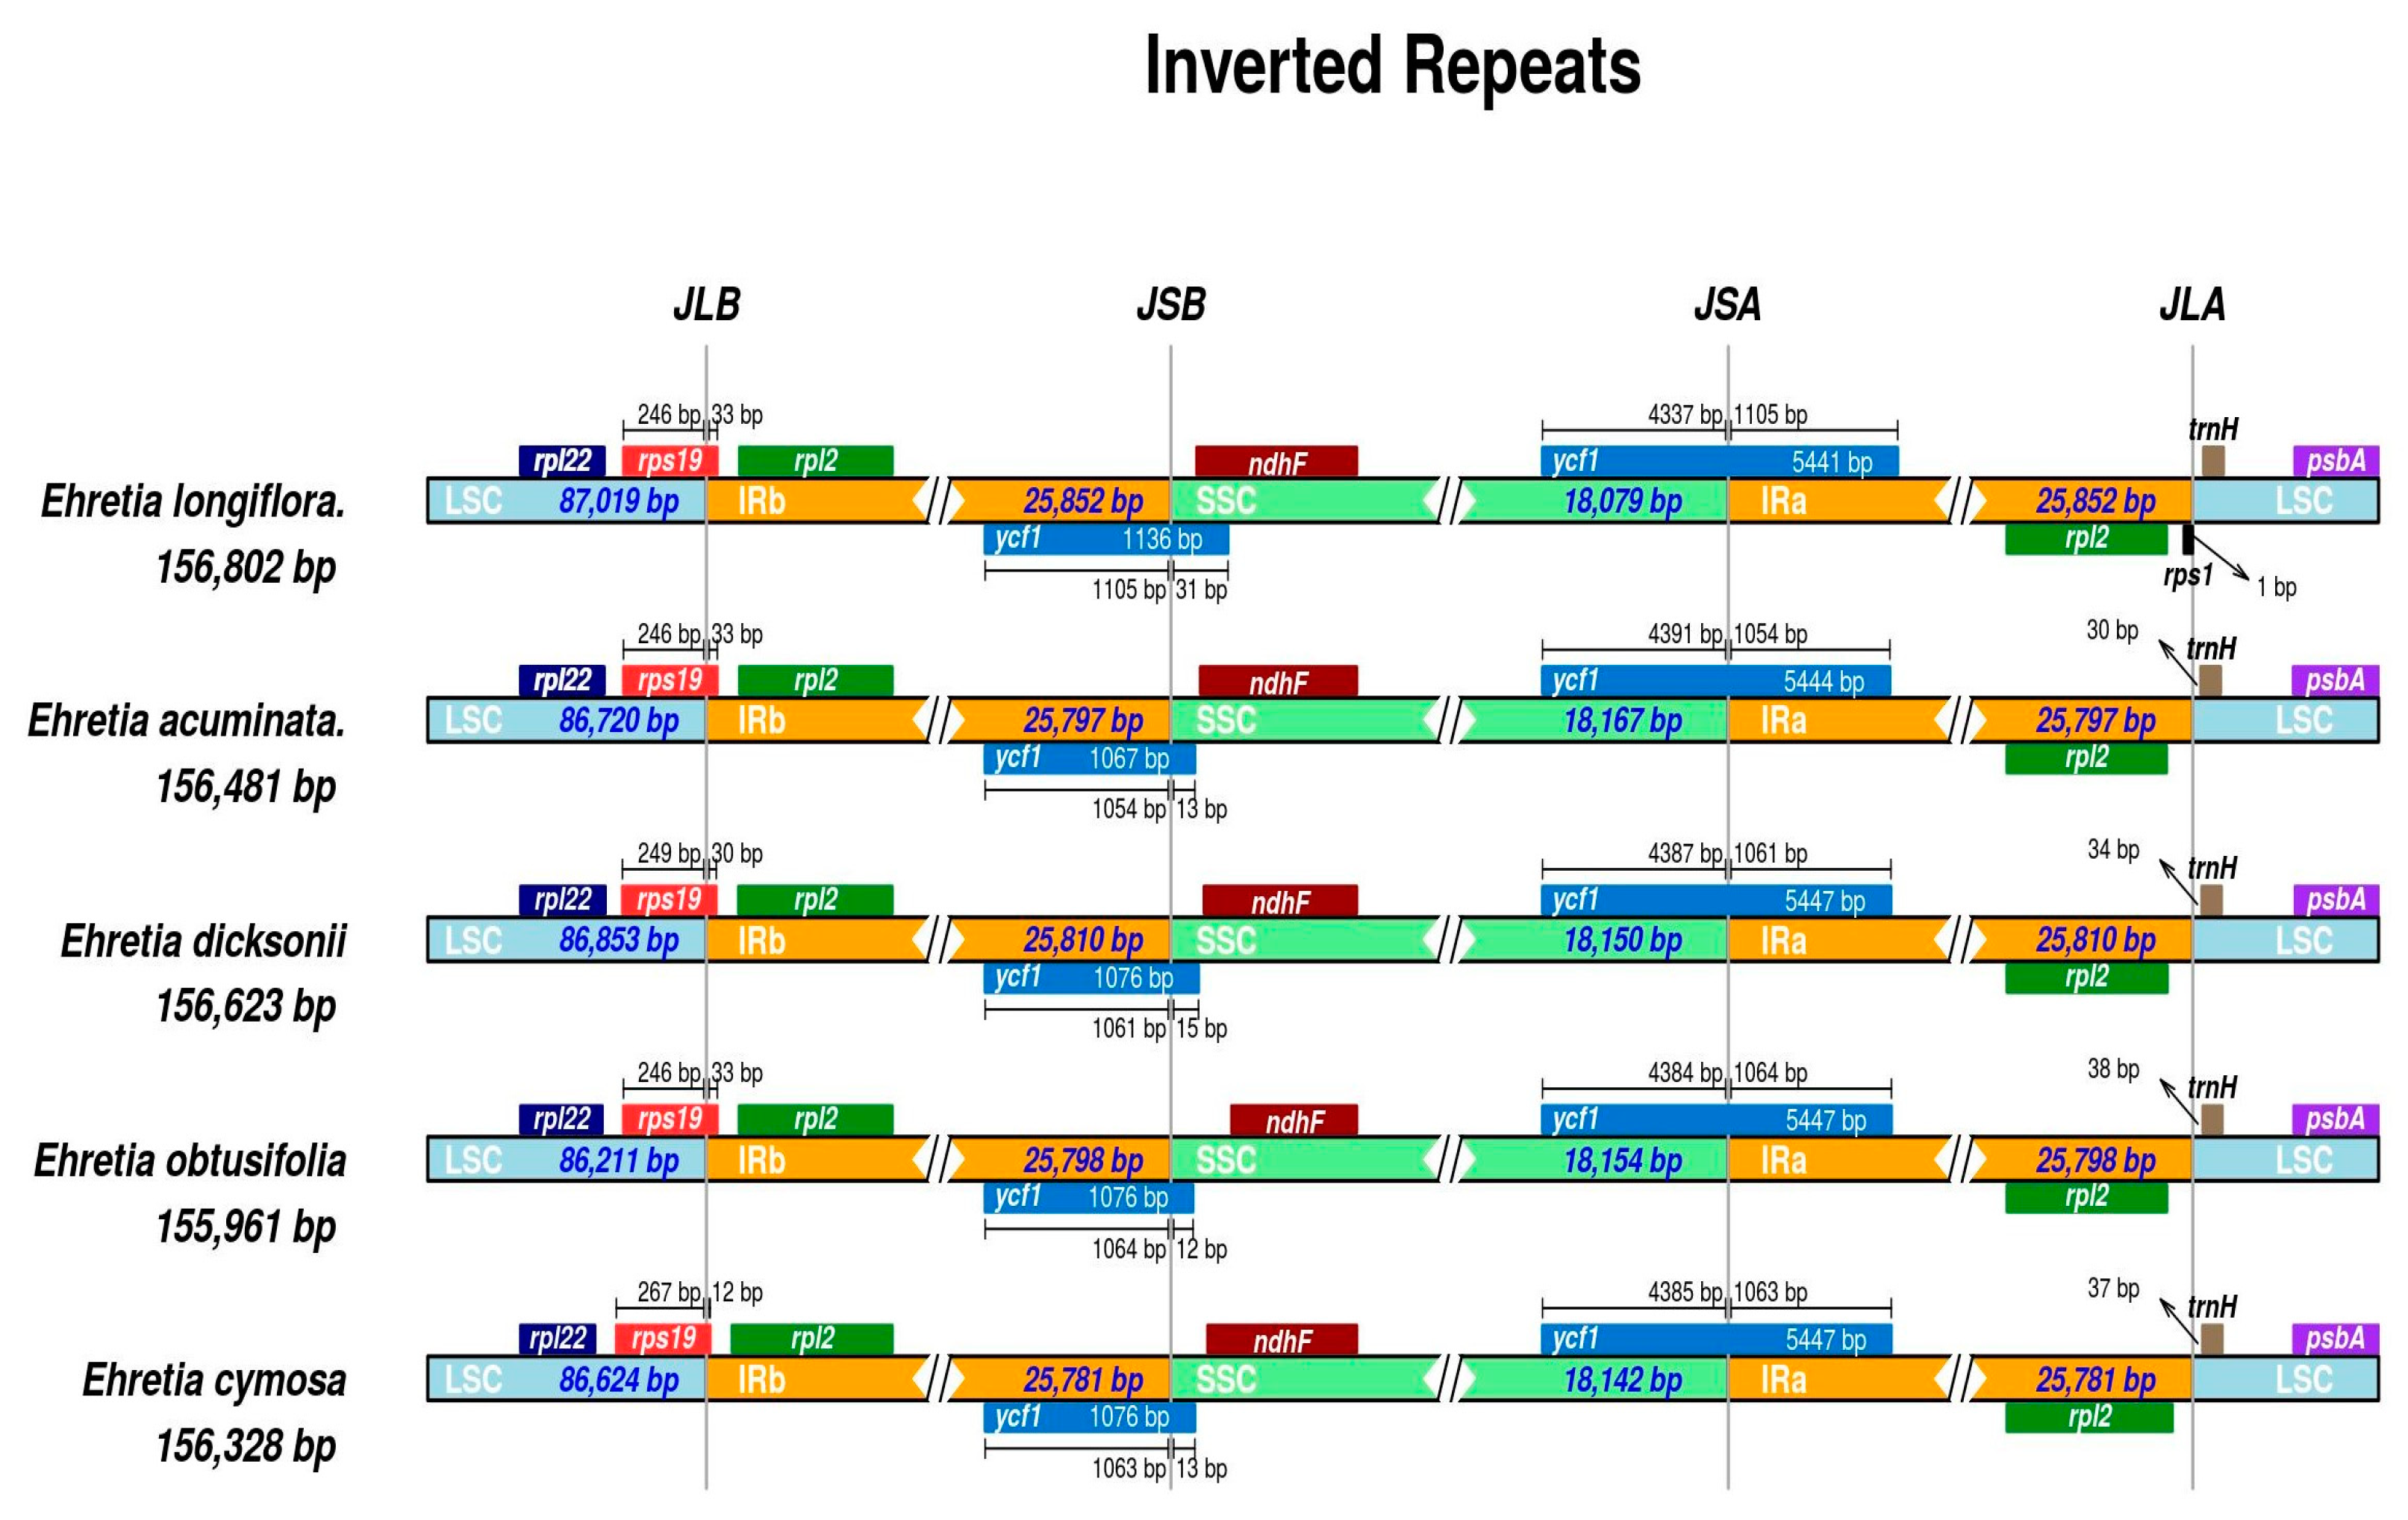
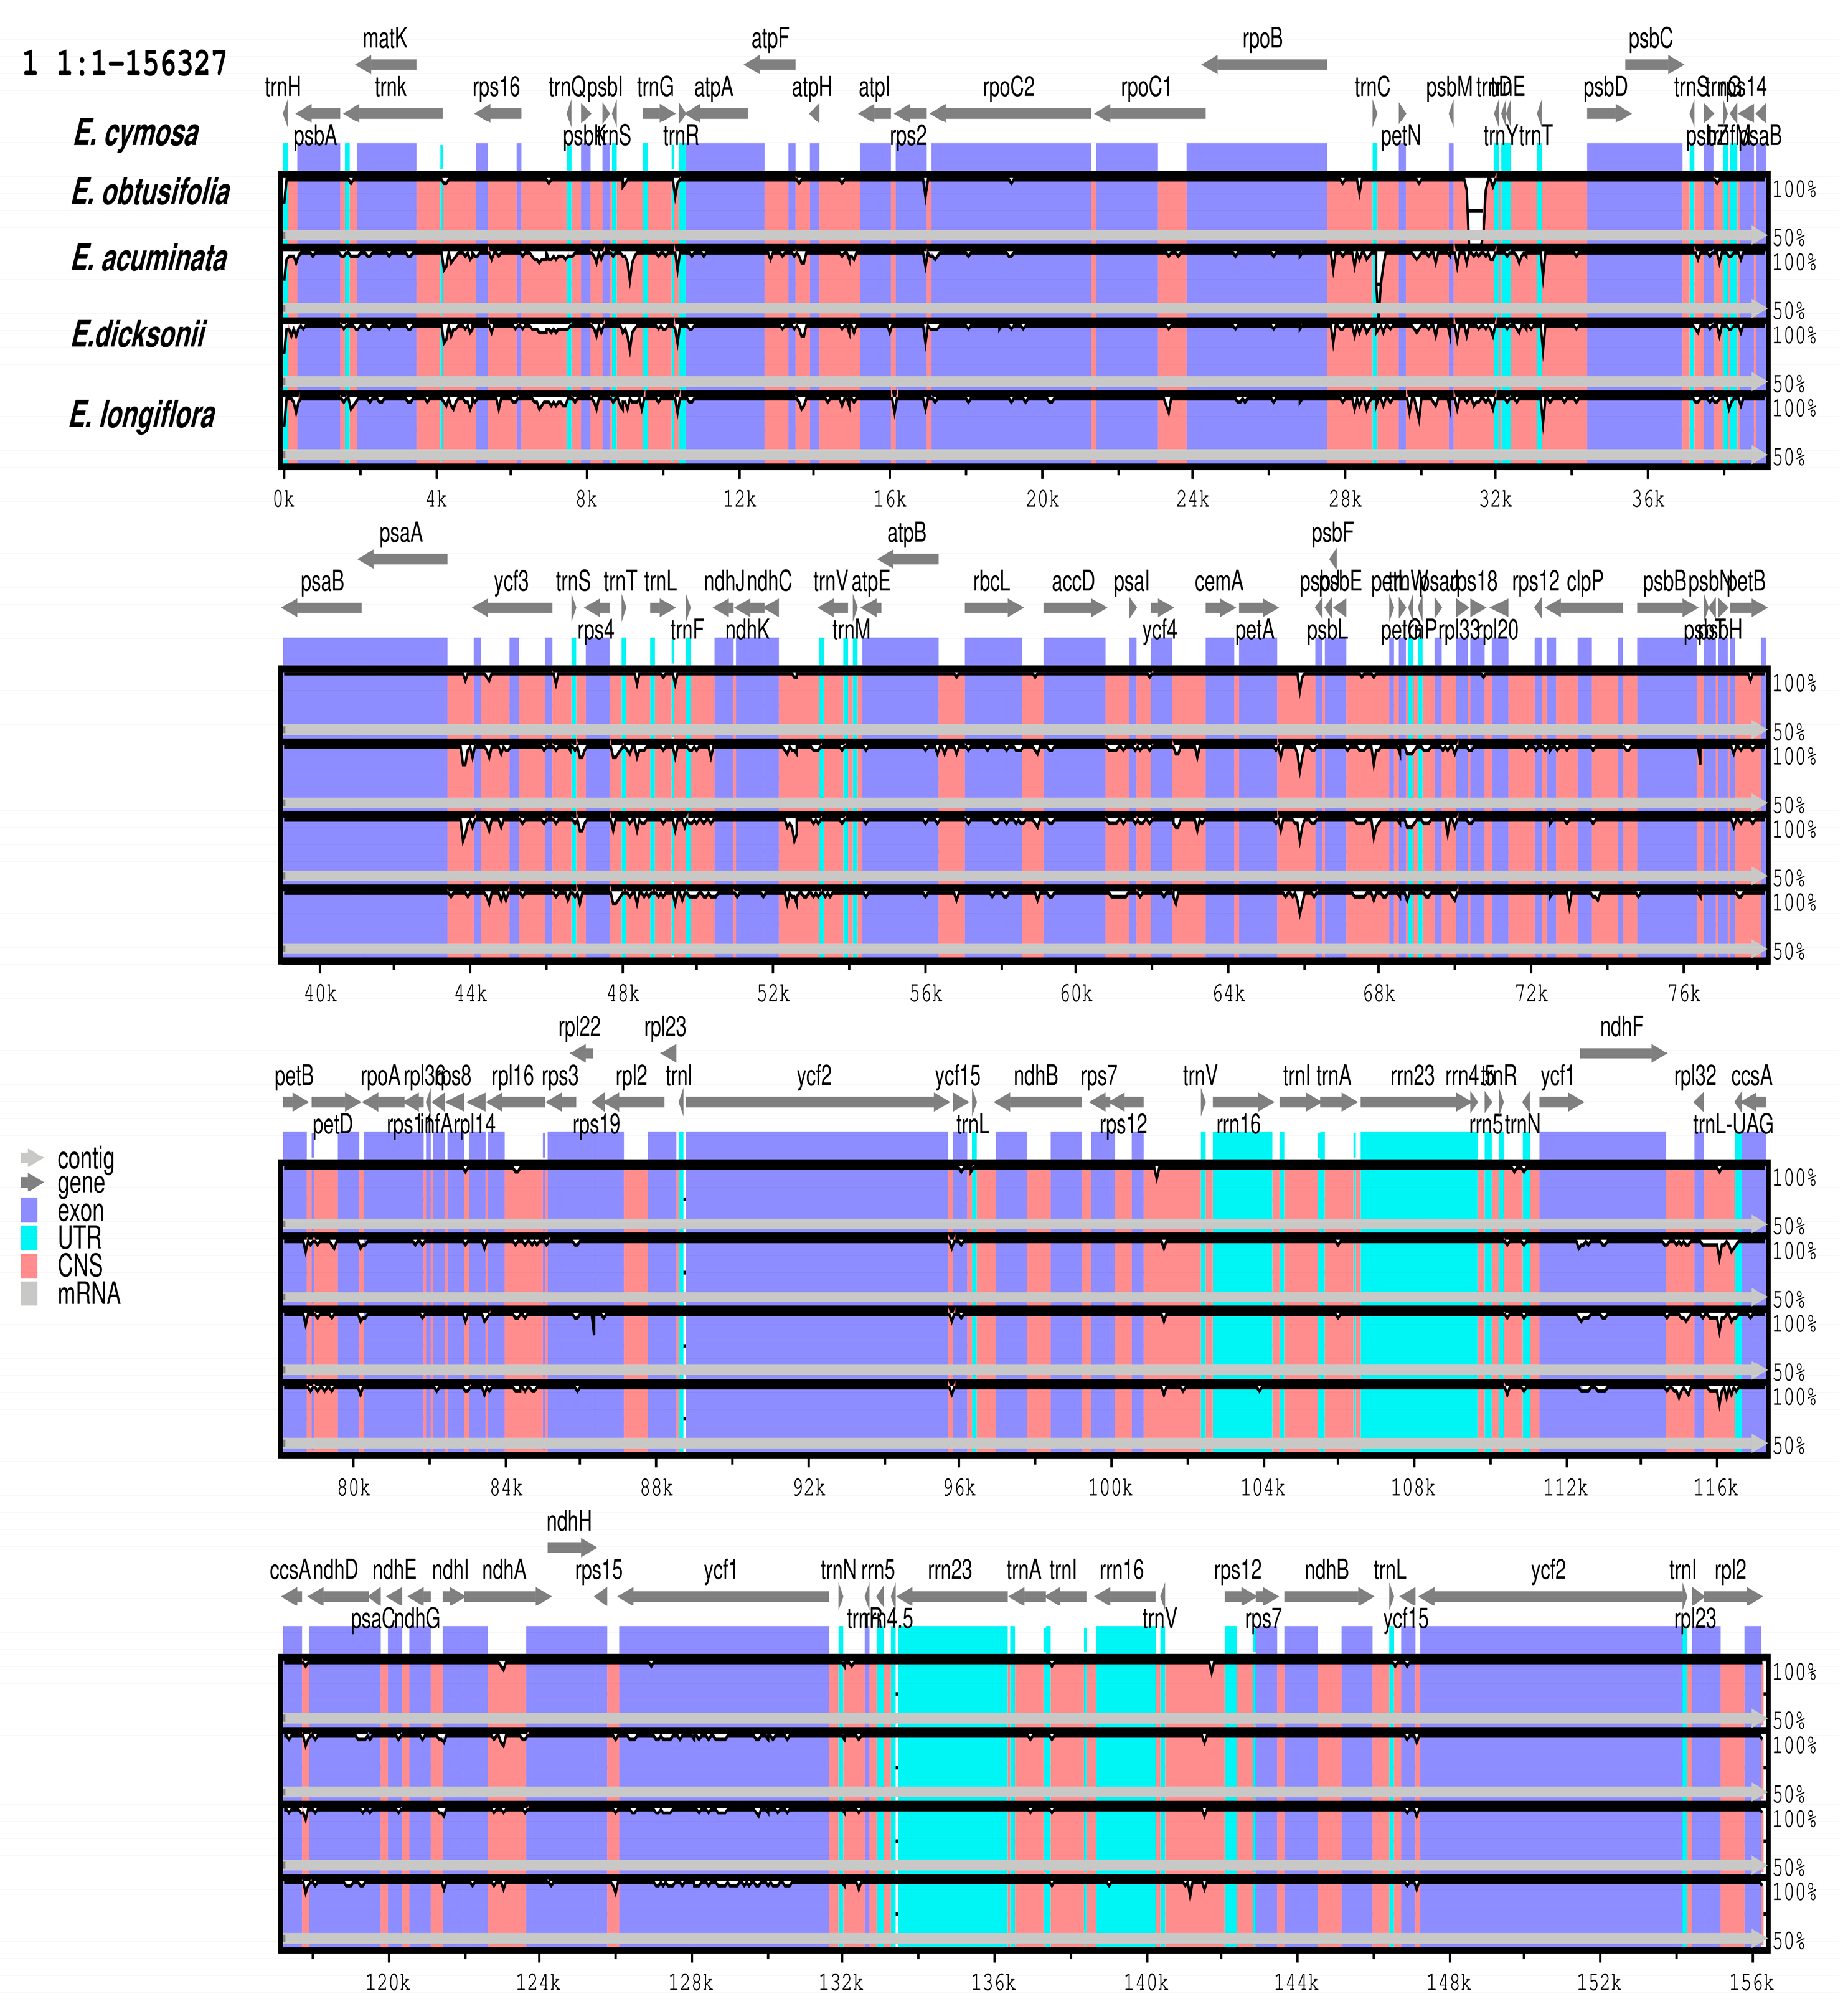
3.6. Comparative Analysis

The IR/LSC and IR/SSC borders in the chloroplast genomes of E. cymosa and E. obtusifolia were compared with those of the other Ehretia species available in the GenBank database (E. acuminata, E. dicksonii, and E. longiflora). The results revealed similarities between the cp genomes of the five species (Figure 7). E. longiflora had the largest cp genome (156,802 bp), followed by E. dicksonii (156,623 bp), E. acuminata (156,481 bp), E. cymosa (156,328 bp), and E. obtusifolia (155,961 bp). The IR regions were 25,781 bp in size in E. cymosa, 25,798 bp in E. obtusifolia, 25,797 bp in E. acuminata, 25,810 bp in E. dicksonii, and 25,852 bp in E. longiflora. Moreover, the lengths of the LSC and SSC regions were 86,624 bp and 18,142 bp, respectively, in E. cymosa; 86.211 bp and 18,154 bp, respectively, in E. obtusifolia; 86,720 bp and 18,167 bp, respectively, in E. acuminata; 86,853 bp and 18,150 bp, respectively, in E. dicksonii; and 87,019 bp and 18,079 bp, respectively, in E. longiflora (Figure 7).
Furthermore, the rps19 gene was found between the IRb/LSC regions of all five Ehretia species (Figure 7). The ycf1 gene was found at the boundary of the IRb/SSC regions in all the species: 1063 bp/13 bp in E. cymosa, 1064 bp/12 bp in E. obtusifolia, 1054 bp/13 bp in E. acuminata, 1061 bp/15 bp in E. dicksonii, and 1105 bp/31 bp in E. longiflora. Additionally, the ycf1 gene was also found at the boundary of the IRa/SSC regions in all the species: 4385 bp/1063 bp in E. cymosa, 4384 bp/1064 bp in E. obtusifolia, 4391 bp/1054 bp in E. acuminata, 4387 bp/1061 bp in E. dicksonii, and 4337 bp/1105 bp in E. longiflora. The ndhF gene was only found in the SSC regions of all the taxa (Figure 7). No genes were located at the boundary of IRa/LSC. trnH and psbA genes were found entirely within the LSC region in both species.

3.7. Divergence of Protein-Coding Gene Sequence

To identify the sequence divergence regions, the five Ehretia chloroplast genomes were compared using the E. cymosa genome as a reference (Figure 8). The results showed that all genomes were highly conserved, although a number of variable regions were also identified. More variations were observed in the non-coding regions than in the coding regions, while the majority of the divergences were found in the LSC regions (Figure 8). The psbA, matK, atpA, rpoC2, rpoB, rbcL, ndhD, and ycf1 genes showed the most divergence within the coding regions (Figure 8). These divergence markers can be used to clarify the evolutionary relationships within Ehretiaceae.

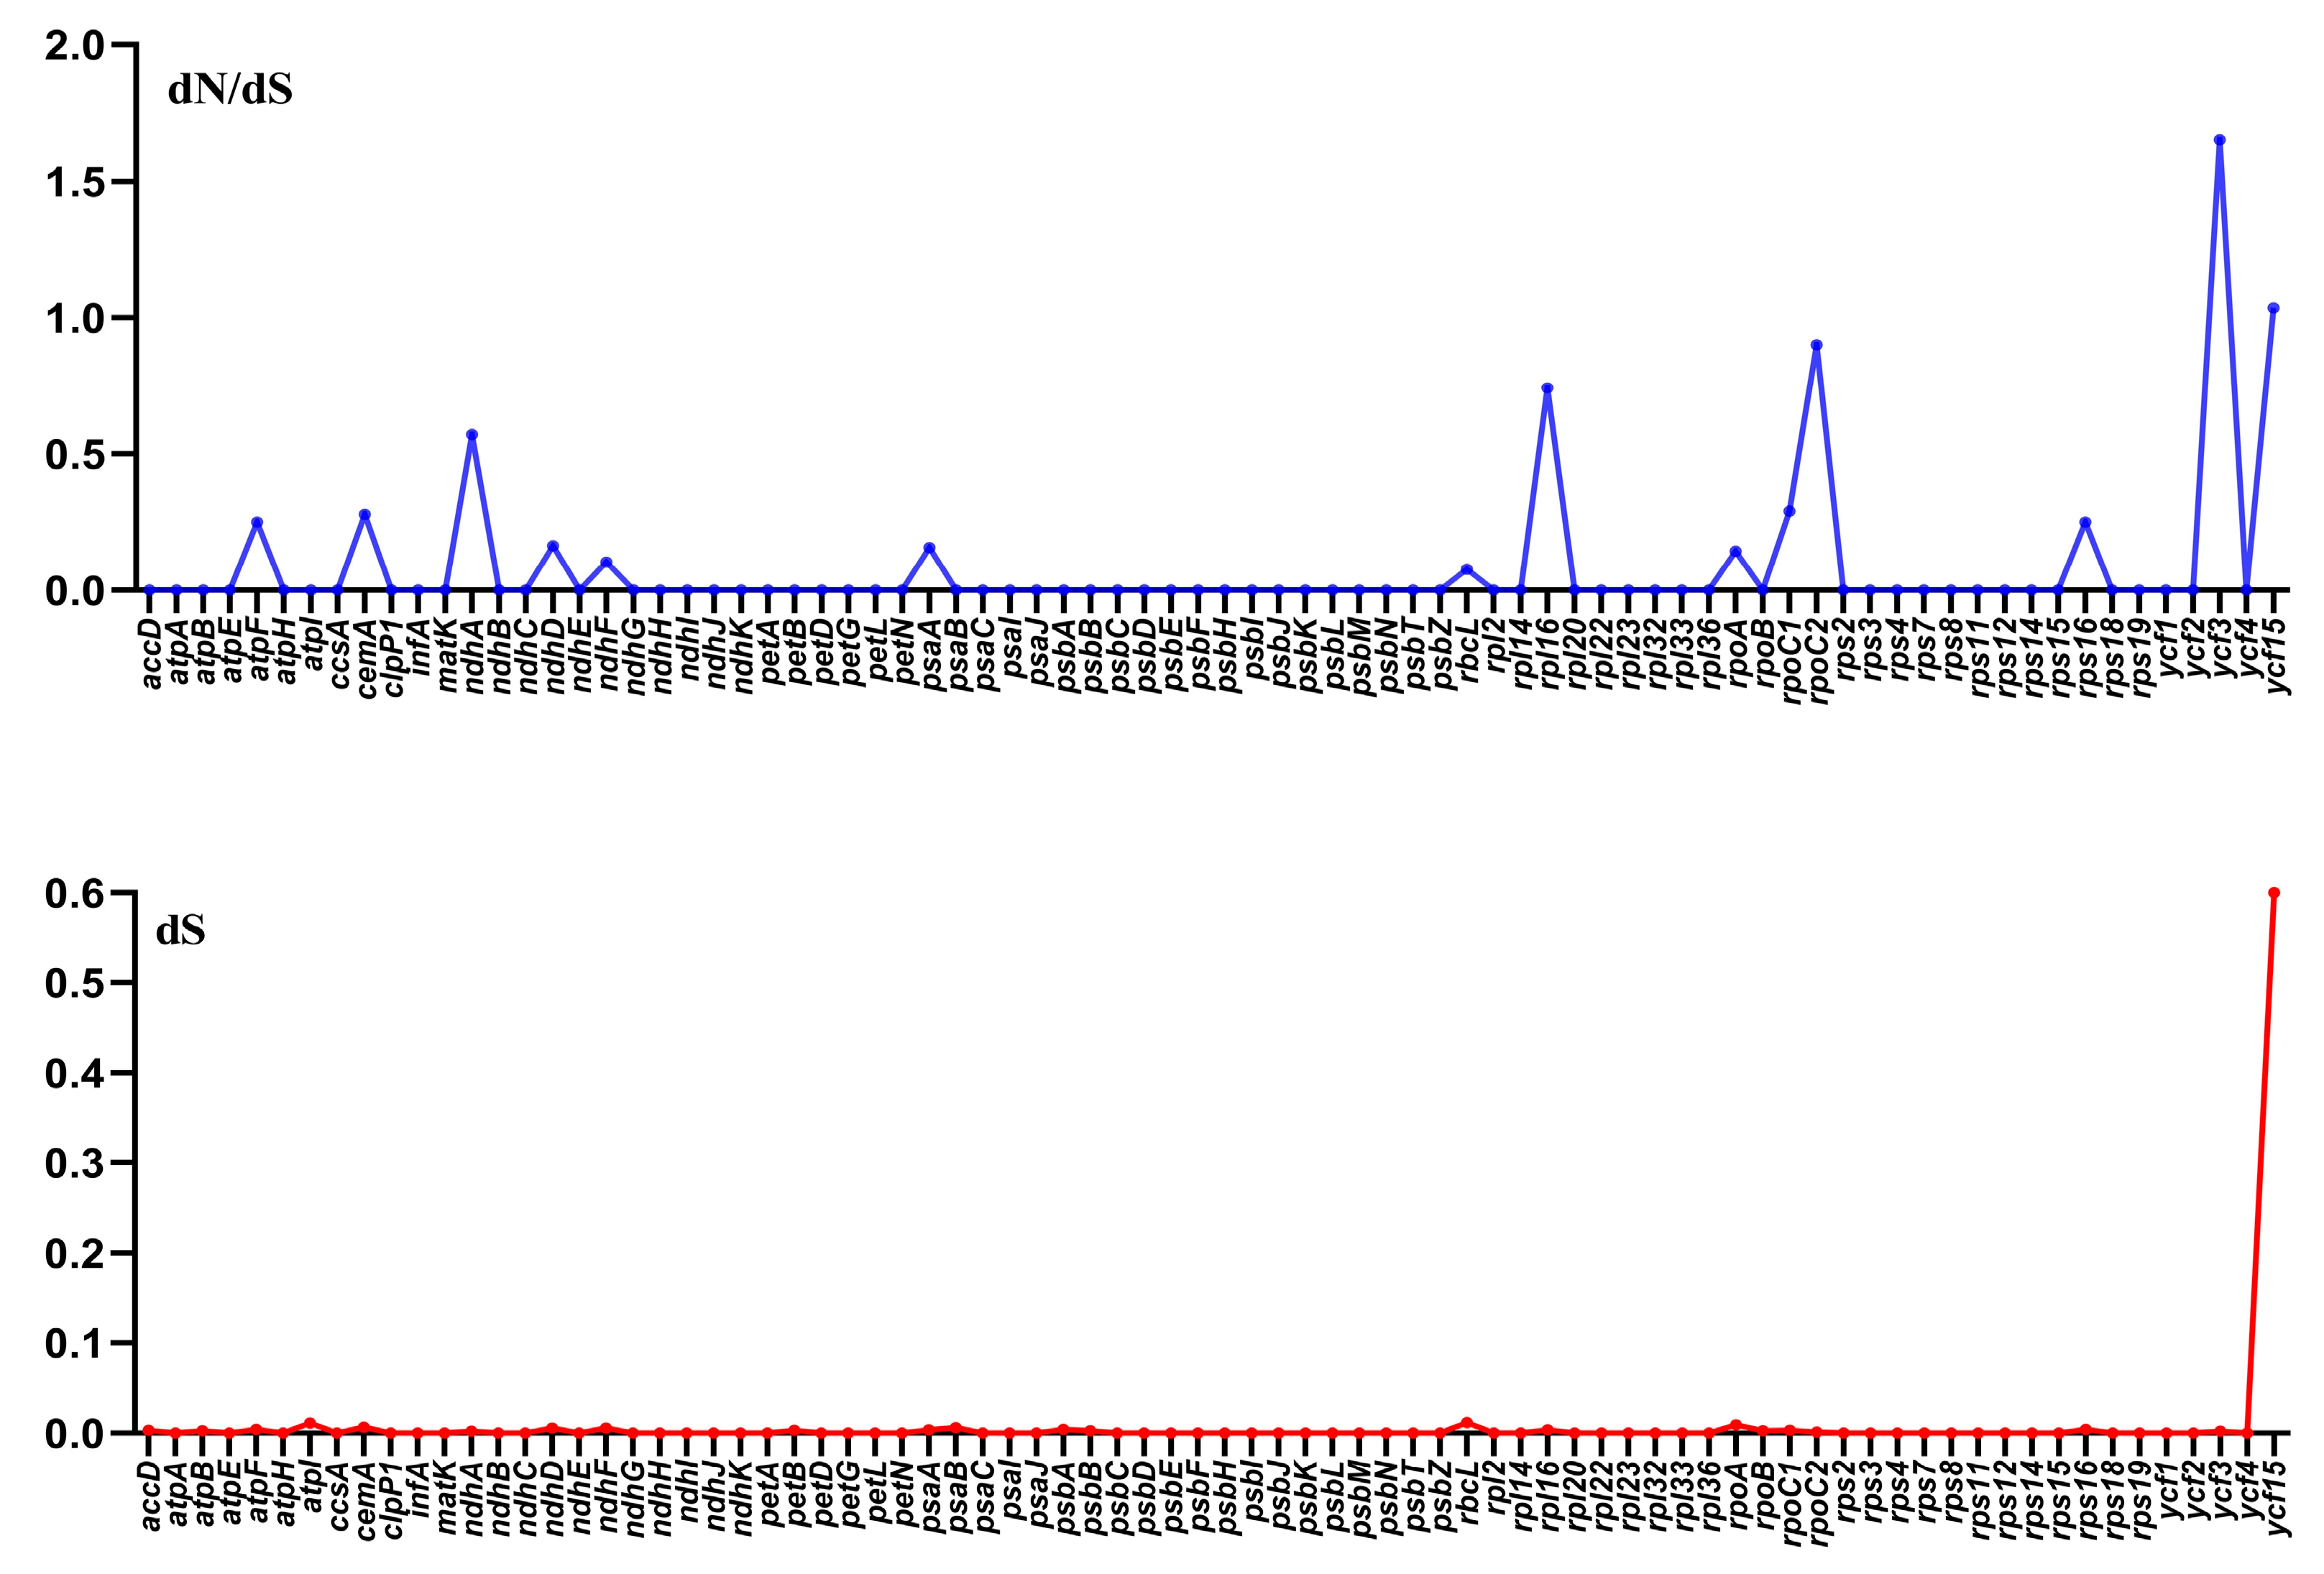
3.8. Characterization of the Substitution Rate

The rates of nonsynonymous/synonymous (dN/dS) substitutions were computed within the protein-coding sequences of E. cymosa and E. obtusifolia to evaluate the selective pressure. The results indicated that the dN/dS ratios were <1 for all the genes in E. cymosa vs. E. obtusifolia, except for the ycf3 and ycf15 genes, which had a dN/dS ratio of 1.6 and 1.03, respectively (Figure 9). The dS substitution values of all the genes ranged from 0 to 0.61 (Figure 9).

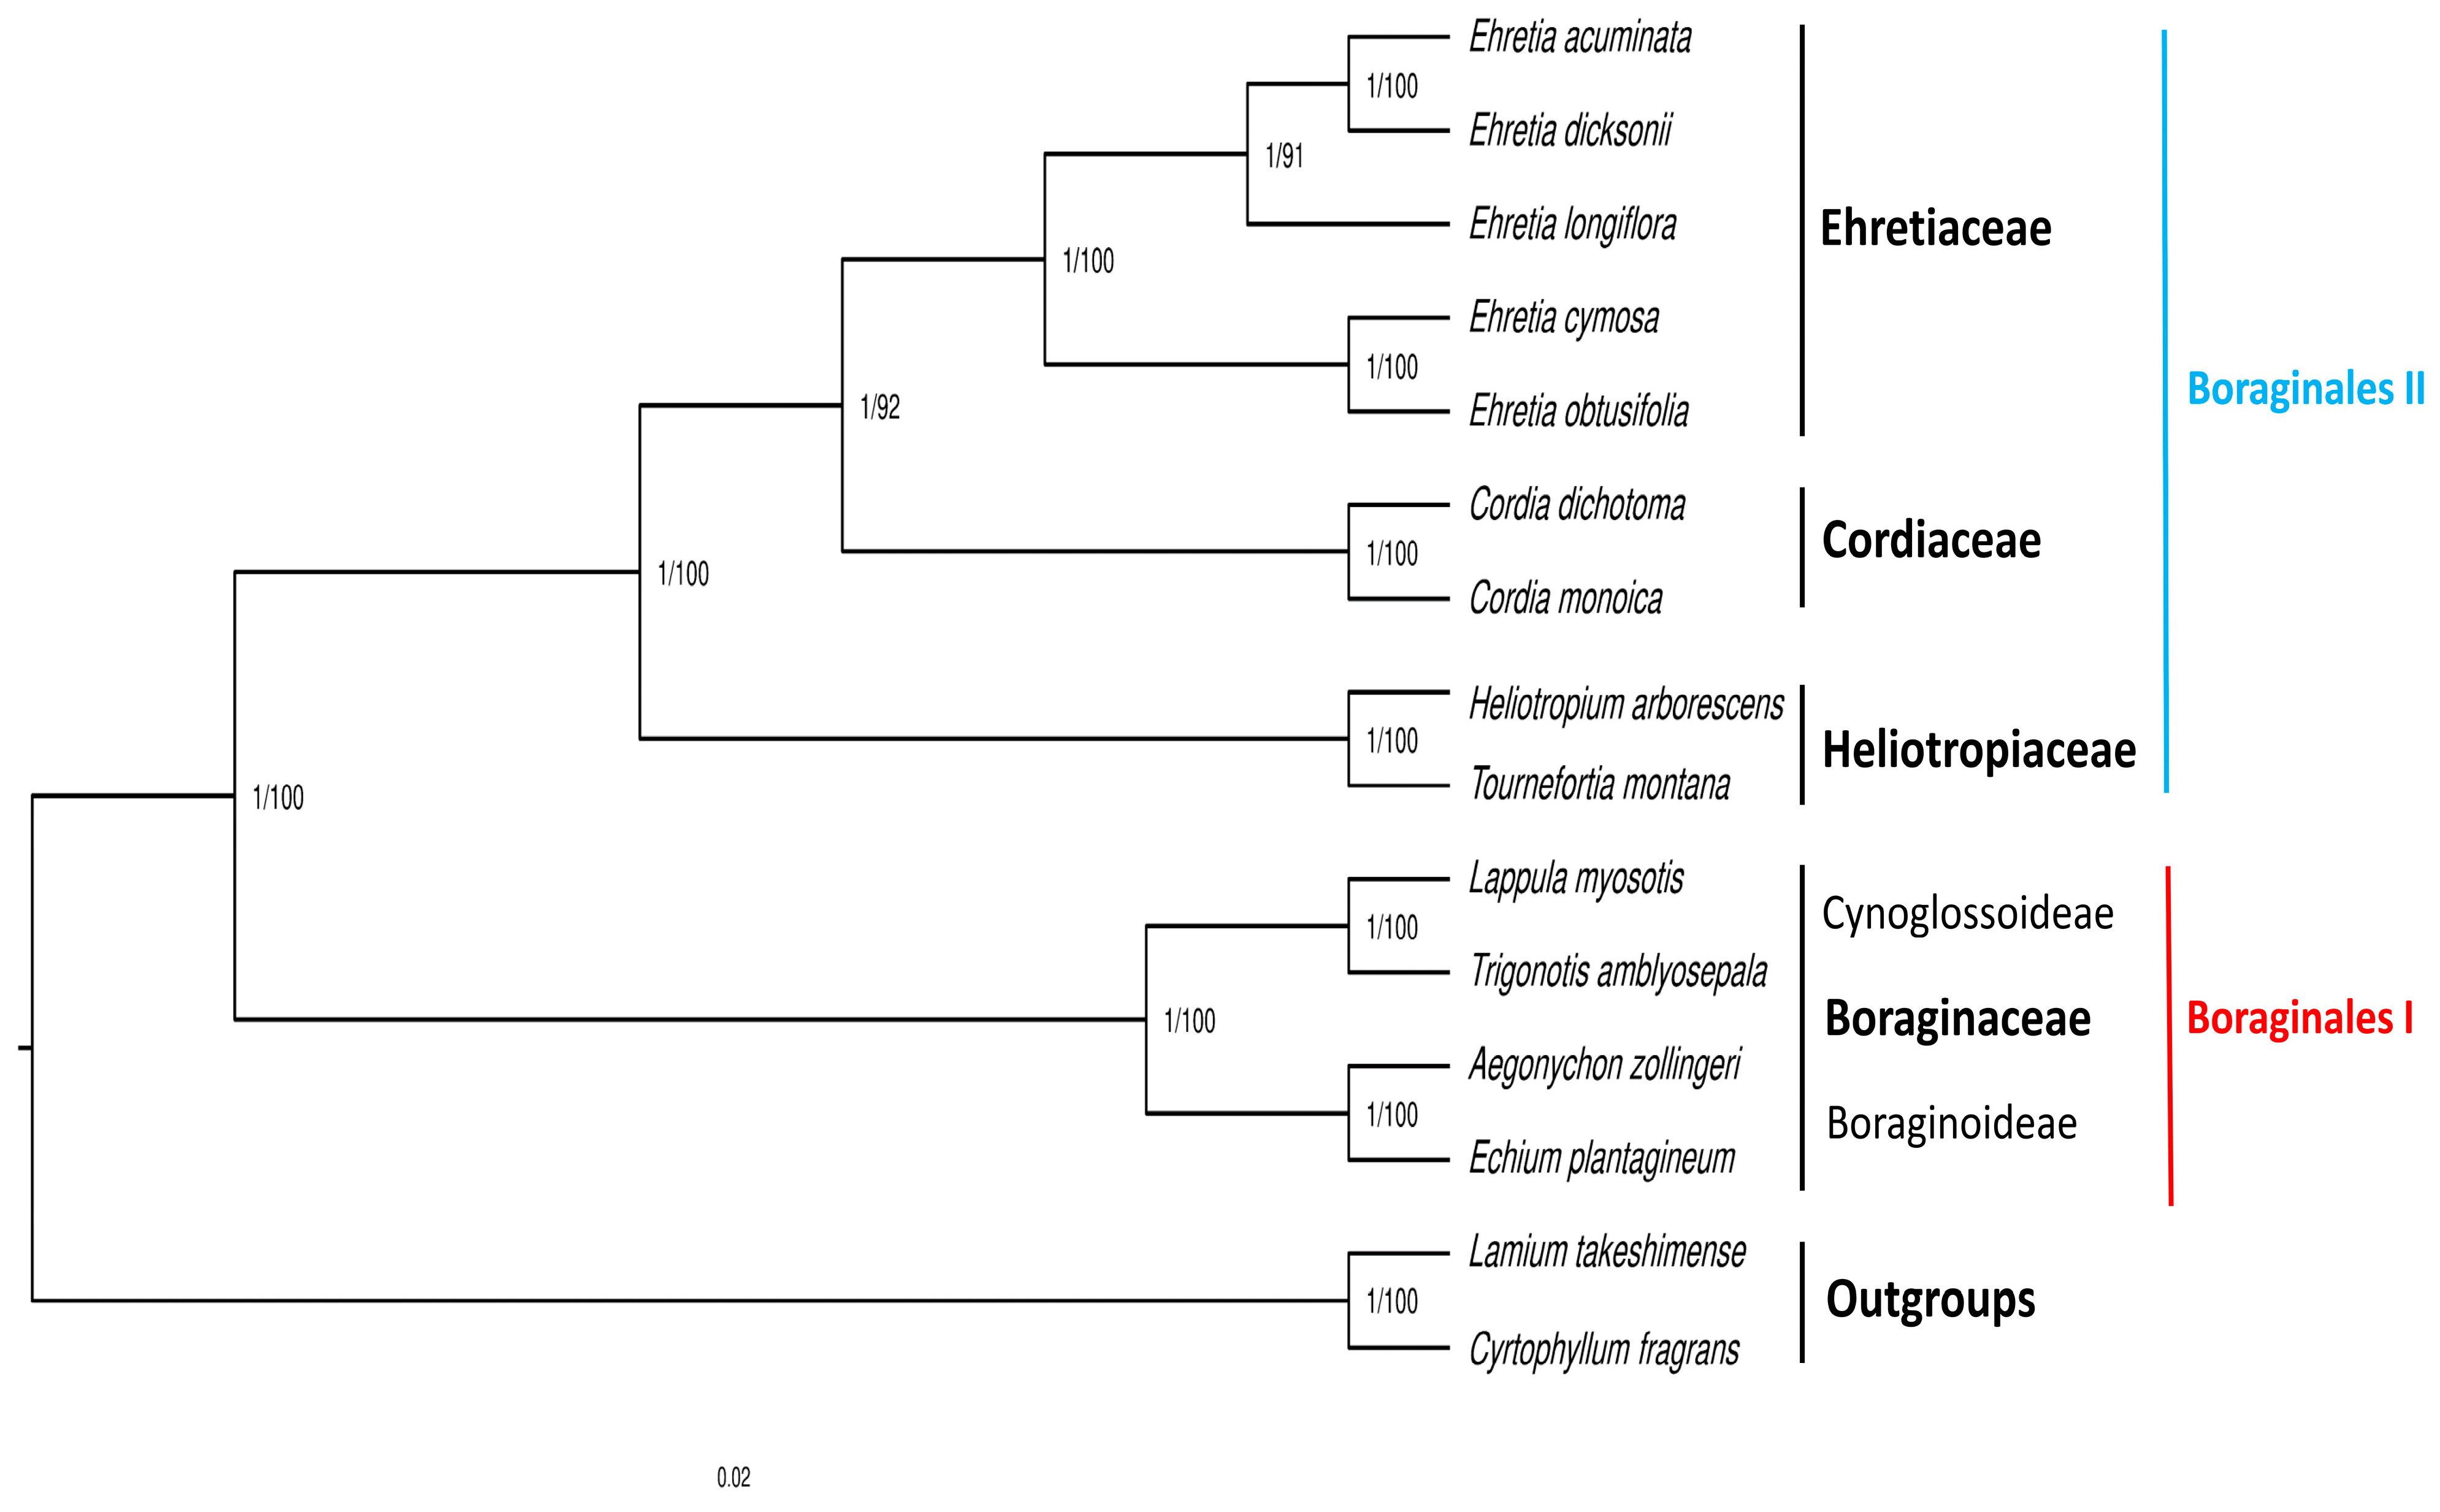
3.9. Phylogenetic Analysis

The phylogenetic results based on the BI and ML analyses were identical and so are presented here as a single tree with posterior probability (PP) and bootstrap (BS) support values (Figure 10). The order Boraginales was split into two main clades, namely Boraginales I and Boraginales II, which obtained strong support (PP = 1/BS = 100). First, the Boraginales I clade included only one family, Boraginaceae, consisting of two subfamilies, Boraginoideae and Cynoglossoideae, which received strong support (PP = 1/BS = 100). The subfamily Boraginoideae comprised the genera Aegonychon and Echium, while the subfamily Cynoglossoideae included the genera Lappula and Trigonotis. Second, the Boraginales II clade comprised three families, namely Ehretiaceae, Cordiaceae, and Heliotropiaceae, which received strong support (PP = 1/BS = 100). In addition, Ehretiaceae and Cordiaceae were recovered as sisters, with strong support (PP = 1/BS = 92).

4. Discussion

The complete chloroplast genome provides plenty of genetic information, which allows researchers to clarify the complicated evolutionary relationships among plants [47]. In the present study, we report the cp genomes of two species from the Ehretia genus. The cp genomes of E. cymosa and E. obtusifolia were found to be structurally similar to the cp genomes of other Boraginales species [48,49,50]. The cp genome sizes ranged from 156,328 bp in E. cymosa to 155,961 bp in E. obtusifolia (Figure 2). The GC of the cp genomes of E. cymosa and E. obtusifolia ranged from 37.86% to 37.87%, respectively, (Table 1). The GC content was slightly different from that observed in E. dicksonii (39.7%) [51]. The difference in GC content among separate species from the same genus may be due to the fact that various species have different codon use biases. The GC content in the IR regions was 43.17% in E. cymosa and 43.18% in E. obtusifolia, which was higher than the content in the regions of the SSC and LSC, possibly due to the fact that all the rRNAs are present in IR regions [52]. The IR regions may be more stable because of their high GC content in comparison to the LSC and SSC regions [53]. Both genomes consisted of 114 unique genes, which were divided into 80 protein-coding genes, 4 rRNA genes, and 30 tRNA genes (Table S1). In angiosperm cp genomes, intron composition is highly conserved [54], which is important for the control of gene expression [55]. In the E. cymosa and E. obtusifolia cp genomes, introns were identified in 18 genes, 6 of which were tRNA genes and 12 of which were protein-coding genes (Table S2).
The codon usage analysis revealed that the genes in the cp genomes of E. cymosa and E. obtusifolia were encoded by 27,513 and 27,393 codons, respectively. Codon usage plays a crucial role in gene expression [56], resulting in an association with gene expression levels, transcriptional selection, amino acid conservation, and GC content [57]. The majority of the codons were coding for leucine (Figure 3), and the codons in both genomes mostly had an RSCU value of <1. These results were similar to those previously found in relation to E. dicksonii [51]. RNA editing plays a vital role in the cp genome, which involves the alteration of nucleotides in the mRNA of functional genes [58]. The expression of functional proteins is influenced by this mechanism [59]. The RNA editing site analysis identified 31 editing sites in each genome, which were distributed within 16 protein-coding genes (Figure 4). All base conversions were found in the first and second positions of the triplet codon, resulting in changes in the amino acids, which is consistent with previous studies [54]. The majority of amino acid conversions were from serine to leucine, which is consistent with the characteristics of RNA editing in angiosperm plants [47,60].
The arrangement and recombination of the cp genome may be significantly influenced by the regions and the numbers of the repeat sequences [61]. The long repeat sequence analysis revealed that palindromic and forward repeats were the most common repeats in E. cymosa and E. obtusifolia (Figure 5), which is consistent with other angiosperm cp genome analyses [62,63,64,65,66]. The SSRs analysis showed that the cp genomes of E. cymosa and E. obtusifolia comprised 141 SSRs and 139 SSRs, respectively (Table 2). The SSRs have been demonstrated to be important molecular markers in taxonomic research [67]. They have also been utilized in several kinds of studies, including those that analyze gene flow and estimate genetic variation among animal or plant genomes [68,69]. The majority of the SSRs were mononucleotides, among which the A/T repeats were the most common. Most of the SSRs found in angiosperm cp genomes usually contain poly thymine (polyT) or poly adenine (polyA) repeats rather than tandem cytosine (C) and guanine (G) repeats [67,70,71].
The IR/LSC and IR/SSC boundaries of the five Ehretia cp genomes were compared in the present study. The variations in genome length are linked to the contraction and expansion of IR regions [72,73] or gene deletions [74]. The variation in the IR/LSC and IR/SSC borders may respond to a number of phylogenetic signals, such as those in subtle Caryophyllales and Gentianinae species [75,76]. The results showed that genes located in the junctions of Ehretia cp genomes were well conserved: rps19 was found in IRb/LSC regions, ycf1 in IRb/SSC and SSC/IRa regions, ndhF in the SSC region, and trnH in the LSC region (Figure 7). The order of the genes in all regions was similar to that observed in some Boraginales taxa, such as Trigonotis (Boraginaceae s.str) [77]. The analysis of the sequence divergence regions revealed a relatively high diversity within Ehretia cp genomes. As observed in angiosperm cp genomes, genic regions are more conserved than intergenic regions [78,79,80]. However, a number of variable regions were observed in the psbA, matK, atpA, rpoC2, rpoB, rbcL, ndhD, and ycf1 genes (Figure 8). Several of these divergence markers have been used to study the evolutionary relationships among plant species [81,82]. The identification of these highly diverse regions in Ehretia cp genomes would be useful for use as species-specific DNA markers.
Understanding how the rate of substitution affects the modification of gene function and structure requires an analysis of the adaptive evolution of genes. Estimating the dN/dS ratio can provide details about the limitations that natural selection has placed on organisms [83,84]. The selective pressure rate analysis of the 80 protein-coding genes between the E. cymosa and E. obtusifolia cp genomes indicated that the dN/dS ratio was <1 in all the paired genes, except for ycf3 and ycf15, which were detected under a positive selection with dN/dS values > 1 (Figure 9). Further research on the functions of these genes is necessary since they may have a significant role in the adaptive evolution of the Ehretia species.
The phylogenetic relationships inferred from the results of the BI and ML analyses divided the order Boraginales into two well-supported clades (Figure 10). The first clade included the family Boraginaceae and its two subfamilies, Boraginoideae and Cynoglossoideae, which is congruent with the findings of a previous study [85]. The second clade comprised three families, namely Ehretiaceae, Cordiaceae, and Heliotropiaceae. Moreover, Ehretiaceae was identified as a sister to Cordiaceae, which is again congruent with the findings of previous studies [22,51]. Our results support the recognition that the order Boraginales contains a number of distinct families, which is congruent with the findings of several molecular analyses in previous studies [1,19,51,86], but differs from the APG IV system view, which recognizes the order Boraginales to contain only a single family, that is, Boraginaceae, and several subfamilies [15].

5. Conclusions

In this study, we analyzed and compared the basic characteristics of the complete chloroplast genomes of two Ehretia species (E. cymosa and E. obtusifolia). Moreover, the base compositions, SSRs and long repeats, RNA editing sites, codon usages, and IR boundaries were identified and analyzed in these genomes. In the phylogenetic analysis, two clades in the order Boraginales were recognized, the first containing a single family (Boraginaceae) and the second including three families (Ehretiaceae, Cordiaceae, and Heliotropiaceae). The present results provide valuable insights into the evolutionary relationships within the order Boraginales. However, we suggest that the analysis of more cp genome sequences from other families in the order Boraginales (e.g., Wellstediaceae, Namaceae, Lennoaceae, Hydrophyllaceae, Hoplestigmataceae, Coldeniaceae, and Codonaceae) is necessary to expand our understanding of the evolutionary relationships within the order Boraginales.

Supplementary Materials

The following supporting information can be downloaded at: https://www.mdpi.com/article/10.3390/f14071486/s1, Table S1: Gene contents in Ehretia cymosa and Ehretia obtusifolia chloroplast genomes; Table S2: Exons and introns lengths in Ehretia cymosa and Ehretia obtusifolia chloroplast genomes; Table S3: Codon-anticodon recognition patterns and codon usage of the Ehretia cymosa chloroplast genome; Table S4: Codon-anticodon recognition patterns and codon usage of the Ehretia obtusifolia chloroplast genome; Table S5: Predicted RNA editing site in the Ehretia cymosa and Ehretia obtusifolia chloroplast genome; Table S6: Repeat sequences present in the Ehretia cymosa chloroplast genome; Table S7: Repeat sequences present in the Ehretia obtusifolia chloroplast genome; Table S8: Simple sequence repeats in the chloroplast genome of Ehretia cymosa; Table S9: Simple sequence repeats in the chloroplast genome of Ehretia obtusifolia.

Author Contributions

Conceptualization, M.S.A., D.A.A. and E.J.A.; methodology, D.A.A. and E.J.A.; software, M.S.A.; validation, D.A.A. and E.J.A.; formal analysis, M.S.A.; investigation, M.S.A.; validation, D.A.A. and E.J.A.; writing—original draft preparation, M.S.A.; supervision, D.A.A. All authors have read and agreed to the published version of the manuscript.

Funding

This research received no external funding.

Data Availability Statement

The datasets generated and analyzed in this study are available in the GeneBank of NCBI, and the complete chloroplast genome sequences of E. cymosa and E. obtusifolia are deposited in GenBank of NCBI under the following accession numbers: E. cymosa (OP679792) and E. obtusifolia (OQ730227).

Conflicts of Interest

The authors declare no conflict of interest.

References

  1. Luebert, F.; Cecchi, L.; Frohlich, M.W.; Gottschling, M.; Guilliams, C.M.; Hasenstab-Lehman, K.E.; Hilger, H.H.; Miller, J.S.; Mittelbach, M.; Nazaire, M.; et al. Familial Classification of the Boraginales. Taxon 2016, 65, 502–522. [Google Scholar] [CrossRef] [Green Version]
  2. Heywood, V.H.; Brummitt, R.K.; Culham, A. Flowering Plant Families of the World; John Wiley: Hoboken, NJ, USA, 2007; ISBN 9781554072064. [Google Scholar]
  3. Simpson, M.G. Diversity and Classification of Flowering Plants: Eudicots. In Plant Systematics; Elsevier: Amsterdam, The Netherlands, 2019; pp. 285–466. [Google Scholar]
  4. Candolle, A.P.d. Prodromus Systematis Naturalis Regni Vegetabilis, Sive, Enumeratio Contracta Ordinum Generum Specierumque Plantarum Huc Usque Cognitarium, Juxta Methodi Naturalis, Normas Digesta/Auctore Aug. Pyramo de Candolle. In Sumptibus Sociorum Treuttel et Würtz; De l’Ecole de Medecine: Paris, France, 1824. [Google Scholar]
  5. Engler, A.; Krause, K.; Pilger, R.; Prantl, K. Die Natürlichen Pflanzenfamilien Nebst Ihren Gattungen Und Wichtigeren Arten, Insbesondere Den Nutzpflanzen, Unter Mitwirkung Zahlreicher Hervorragender Fachgelehrten Begründet; Engelmann, W., Ed.; Verlag von Wilhelm Engelmann: Leipzig, Germany, 1887. [Google Scholar]
  6. Hutchinson, J. The Families of Flowering Plants. I. Dicotyledons. Arranged According to a New System Based on Their Probable Phylogeny. J. Hutchinson. Bot. Gaz. 1926, 82, 111–112. [Google Scholar] [CrossRef]
  7. Dahlgren, R.M.T. A Revised System of Classification of the Angiosperms. Bot. J. Linn. Soc. 1980, 80, 91–124. [Google Scholar] [CrossRef]
  8. Thorne, R. An Updated Phylogenetic Classification of the Flowering Plants. Aliso 1992, 13, 265–389. [Google Scholar] [CrossRef] [Green Version]
  9. Takhtajan, A. Diversity and Classification of Flowering Plants; Columbia University Press: New York, NY, USA, 1997; ISBN 9780231100984. [Google Scholar]
  10. The Angiosperm Phylogeny Group. An Ordinal Classification for the Families of Flowering Plants. Ann. Mo. Bot. Gard. 1998, 85, 531. [Google Scholar] [CrossRef] [Green Version]
  11. The Angiosperm Phylogeny Group. An Update of the Angiosperm Phylogeny Group Classification for the Orders and Families of Flowering Plants: APG II. Bot. J. Linn. Soc. 2003, 141, 399–436. [Google Scholar] [CrossRef] [Green Version]
  12. Moore, M.J.; Jansen, R.K. Molecular Evidence for the Age, Origin, and Evolutionary History of the American Desert Plant Genus Tiquilia (Boraginaceae). Mol. Phylogenetics Evol. 2006, 39, 668–687. [Google Scholar] [CrossRef] [PubMed]
  13. The Angiosperm Phylogeny Group. An Update of the Angiosperm Phylogeny Group Classification for the Orders and Families of Flowering Plants: APG III. Bot. J. Linn. Soc. 2009, 161, 105–121. [Google Scholar] [CrossRef] [Green Version]
  14. Nazaire, M.; Hufford, L. A Broad Phylogenetic Analysis of Boraginaceae: Implications for the Relationships of Mertensia. Syst. Bot. 2012, 37, 758–783. [Google Scholar] [CrossRef]
  15. The Angiosperm Phylogeny Group. An Update of the Angiosperm Phylogeny Group Classification for the Orders and Families of Flowering Plants: APG IV. Bot. J. Linn. Soc. 2016, 181, 1–20. [Google Scholar] [CrossRef] [Green Version]
  16. Gottschling, M.; Hilger, H.H.; Wolf, M.; Diane, N. Secondary Structure of the ITS1 Transcript and Its Application in a Reconstruction of the Phylogeny of Boraginales. Plant Biol. 2001, 3, 629–636. [Google Scholar] [CrossRef]
  17. Cohen, J.I. A Phylogenetic Analysis of Morphological and Molecular Characters of Boraginaceae: Evolutionary Relationships, Taxonomy, and Patterns of Character Evolution. Cladistics 2013, 30, 139–169. [Google Scholar] [CrossRef] [PubMed]
  18. Weigend, M.; Luebert, F.; Gottschling, M.; Couvreur, T.L.P.; Hilger, H.H.; Miller, J.S. From Capsules to Nutlets-Phylogenetic Relationships in the Boraginales. Cladistics 2013, 30, 508–518. [Google Scholar] [CrossRef] [PubMed]
  19. Refulio-Rodriguez, N.F.; Olmstead, R.G. Phylogeny of Lamiidae. Am. J. Bot. 2014, 101, 287–299. [Google Scholar] [CrossRef] [PubMed]
  20. Hasenstab-Lehman, K. Phylogenetics of the Borage Family: Delimiting Boraginales and Assessing Closest Relatives. Aliso 2017, 35, 41–49. [Google Scholar] [CrossRef]
  21. Zhang, C.; Zhang, T.; Luebert, F.; Xiang, Y.; Huang, C.-H.; Hu, Y.; Rees, M.; Frohlich, M.W.; Qi, J.; Weigend, M.; et al. Asterid Phylogenomics/Phylotranscriptomics Uncover Morphological Evolutionary Histories and Support Phylogenetic Placement for Numerous Whole-Genome Duplications. Mol. Biol. Evol. 2020, 37, 3188–3210. [Google Scholar] [CrossRef]
  22. Gottschling, M.; Luebert, F.; Hilger, H.H.; Miller, J.S. Molecular Delimitations in the Ehretiaceae (Boraginales). Mol. Phylogenetics Evol. 2014, 72, 1–6. [Google Scholar] [CrossRef]
  23. Grevich, J.J.; Daniell, H. Chloroplast Genetic Engineering: Recent Advances and Future Perspectives. CRC Crit. Rev. Plant Sci. 2005, 24, 83–107. [Google Scholar] [CrossRef]
  24. Roston, R.L.; Jouhet, J.; Yu, F.; Gao, H. Editorial: Structure and Function of Chloroplasts. Front Plant Sci. 2018, 9, 1656. [Google Scholar] [CrossRef]
  25. Shaw, J.; Lickey, E.B.; Schilling, E.E.; Small, R.L. Comparison of Whole Chloroplast Genome Sequences to Choose Noncoding Regions for Phylogenetic Studies in Angiosperms: The Tortoise and the Hare III. Am. J. Bot. 2007, 94, 275–288. [Google Scholar] [CrossRef] [Green Version]
  26. Mower, J.P.; Vickrey, T.L. Chapter Nine-Structural Diversity Among Plastid Genomes of Land Plants. In Plastid Genome Evolution; Chaw, S.-M., Jansen, R.K.B.T.-A., Eds.; Academic Press: Cambridge, MA, USA, 2018; Volume 85, pp. 263–292. ISBN 0065-2296. [Google Scholar]
  27. Bendich, A.J. Circular Chloroplast Chromosomes: The Grand Illusion. Plant Cell 2004, 16, 1661–1666. [Google Scholar] [CrossRef] [PubMed] [Green Version]
  28. Liu, S.; Ni, Y.; Li, J.; Zhang, X.; Yang, H.; Chen, H.; Liu, C. CPGView: A Package for Visualizing Detailed Chloroplast Genome Structures. Mol. Ecol. Resour. 2023, 23, 694–704. [Google Scholar] [CrossRef] [PubMed]
  29. Yao, J.; Zhao, F.; Xu, Y.; Zhao, K.; Quan, H.; Su, Y.; Hao, P.; Liu, J.; Yu, B.; Yao, M.; et al. Complete Chloroplast Genome Sequencing and Phylogenetic Analysis of Two Dracocephalum Plants. Biomed. Res. Int. 2020, 2020, 4374801. [Google Scholar] [CrossRef] [PubMed]
  30. Chen, Y.Y.; Chen, Y.Y.; Shi, C.; Huang, Z.; Zhang, Y.; Li, S.; Li, Y.; Ye, J.; Yu, C.; Li, Z.; et al. SOAPnuke: A MapReduce Acceleration-Supported Software for Integrated Quality Control and Preprocessing of High-Throughput Sequencing Data. Gigascience 2018, 7, 1–6. [Google Scholar] [CrossRef] [PubMed] [Green Version]
  31. Dierckxsens, N.; Mardulyn, P.; Smits, G. NOVOPlasty: De Novo Assembly of Organelle Genomes from Whole Genome Data. Nucleic Acids Res. 2017, 45, e18. [Google Scholar] [CrossRef] [PubMed] [Green Version]
  32. Tillich, M.; Lehwark, P.; Pellizzer, T.; Ulbricht-Jones, E.S.; Fischer, A.; Bock, R.; Greiner, S. GeSeq-Versatile and Accurate Annotation of Organelle Genomes. Nucleic Acids Res. 2017, 45, W6–W11. [Google Scholar] [CrossRef] [Green Version]
  33. Greiner, S.; Lehwark, P.; Bock, R. OrganellarGenomeDRAW (OGDRAW) Version 1.3.1: Expanded Toolkit for the Graphical Visualization of Organellar Genomes. Nucleic Acids Res. 2019, 47, W59–W64. [Google Scholar] [CrossRef] [Green Version]
  34. Tamura, K.; Stecher, G.; Peterson, D.; Filipski, A.; Kumar, S. MEGA6: Molecular Evolutionary Genetics Analysis Version 6.0. Mol. Biol. Evol. 2013, 30, 2725–2729. [Google Scholar] [CrossRef] [Green Version]
  35. Lenz, H.; Knoop, V. PREPACT 2.0: Predicting C-to-U and U-to-C RNA Editing in Organelle Genome Sequences with Multiple References and Curated RNA Editing Annotation. Bioinform. Biol. Insights 2013, 7, 1–19. [Google Scholar] [CrossRef]
  36. Kurtz, S.; Choudhuri, J.V.; Ohlebusch, E.; Schleiermacher, C.; Stoye, J.; Giegerich, R. REPuter: The Manifold Applications of Repeat Analysis on a Genomic Scale. Nucleic Acids Res. 2001, 29, 4633–4642. [Google Scholar] [CrossRef] [Green Version]
  37. Beier, S.; Thiel, T.; Münch, T.; Scholz, U.; Mascher, M. MISA-Web: A Web Server for Microsatellite Prediction. Bioinformatics 2017, 33, 2583–2585. [Google Scholar] [CrossRef] [Green Version]
  38. Kearse, M.; Moir, R.; Wilson, A.; Stones-Havas, S.; Cheung, M.; Sturrock, S.; Buxton, S.; Cooper, A.; Markowitz, S.; Duran, C.; et al. Geneious Basic: An Integrated and Extendable Desktop Software Platform for the Organization and Analysis of Sequence Data. Bioinformatics 2012, 28, 1647–1649. [Google Scholar] [CrossRef] [Green Version]
  39. Librado, P.; Rozas, J. DnaSP v5: A Software for Comprehensive Analysis of DNA Polymorphism Data. Bioinformatics 2009, 25, 1451–1452. [Google Scholar] [CrossRef] [Green Version]
  40. Mayor, C.; Brudno, M.; Schwartz, J.R.; Poliakov, A.; Rubin, E.M.; Frazer, K.A.; Pachter, L.S.; Dubchak, I. VISTA: Visualizing Global DNA Sequence Alignments of Arbitrary Length. Bioinformatics 2000, 16, 1046–1047. [Google Scholar] [CrossRef] [PubMed] [Green Version]
  41. Amiryousefi, A.; Hyvönen, J.; Poczai, P. IRscope: An Online Program to Visualize the Junction Sites of Chloroplast Genomes. Bioinformatics 2018, 34, 3030–3031. [Google Scholar] [CrossRef] [Green Version]
  42. Katoh, K.; Standley, D.M. MAFFT Multiple Sequence Alignment Software Version 7: Improvements in Performance and Usability. Mol. Biol. Evol. 2013, 30, 772–780. [Google Scholar] [CrossRef] [Green Version]
  43. Ronquist, F.; Teslenko, M.; van der Mark, P.; Ayres, D.L.; Darling, A.; Höhna, S.; Larget, B.; Liu, L.; Suchard, M.A.; Huelsenbeck, J.P. MrBayes 3.2: Efficient Bayesian Phylogenetic Inference and Model Choice across a Large Model Space. Syst. Biol. 2012, 61, 539–542. [Google Scholar] [CrossRef] [PubMed] [Green Version]
  44. Nguyen, L.-T.; Schmidt, H.A.; von Haeseler, A.; Minh, B.Q. IQ-TREE: A Fast and Effective Stochastic Algorithm for Estimating Maximum-Likelihood Phylogenies. Mol. Biol. Evol. 2015, 32, 268–274. [Google Scholar] [CrossRef] [PubMed]
  45. Posada, D. JModelTest: Phylogenetic Model Averaging. Mol. Biol. Evol. 2008, 25, 1253–1256. [Google Scholar] [CrossRef]
  46. Kalyaanamoorthy, S.; Minh, B.Q.; Wong, T.K.F.; von Haeseler, A.; Jermiin, L.S. ModelFinder: Fast Model Selection for Accurate Phylogenetic Estimates. Nat. Methods 2017, 14, 587–589. [Google Scholar] [CrossRef] [Green Version]
  47. Luo, J.; Hou, B.-W.; Niu, Z.-T.; Liu, W.; Xue, Q.-Y.; Ding, X.-Y. Comparative Chloroplast Genomes of Photosynthetic Orchids: Insights into Evolution of the Orchidaceae and Development of Molecular Markers for Phylogenetic Applications. PLoS ONE 2014, 9, e99016. [Google Scholar] [CrossRef] [PubMed]
  48. Guo, X.; Wang, X.; Wang, Q.; Liu, C.; Zhang, R.; Cheng, A.; Sun, J. The Complete Chloroplast Genome Sequence of Borago Officinalis Linn. (Boraginaceae) and Its Phylogenetic Analysis. Mitochondrial DNA Part B 2020, 5, 1461–1462. [Google Scholar] [CrossRef] [Green Version]
  49. Carvalho Leonardo, I.; Barreto Crespo, M.T.; Capelo, J.; Bustos Gaspar, F. The Complete Plastome of Echium plantagineum L. (Boraginaceae), the First Chloroplast Genome Belonging to the Echium Genus. Mitochondrial DNA B Resour. 2022, 7, 1154–1156. [Google Scholar] [CrossRef]
  50. Wu, J.-H.; Li, H.-M.; Lei, J.-M.; Liang, Z.-R. The Complete Chloroplast Genome Sequence of Trigonotis Peduncularis (Boraginaceae). Mitochondrial DNA B Resour. 2022, 7, 456–457. [Google Scholar] [CrossRef] [PubMed]
  51. Li, Q.; Wei, R. Comparison of Boraginales Plastomes: Insights into Codon Usage Bias, Adaptive Evolution, and Phylogenetic Relationships. Diversity 2022, 14, 1104. [Google Scholar] [CrossRef]
  52. Liu, K.; Wang, R.; Guo, X.-X.; Zhang, X.-J.; Qu, X.-J.; Fan, S.-J. Comparative and Phylogenetic Analysis of Complete Chloroplast Genomes in Eragrostideae (Chloridoideae, Poaceae). Plants 2021, 10, 109. [Google Scholar] [CrossRef]
  53. Long, L.; Li, Y.; Wang, S.; Liu, Z.; Wang, J.; Yang, M. Complete Chloroplast Genomes and Comparative Analysis of Ligustrum Species. Sci. Rep. 2023, 13, 212. [Google Scholar] [CrossRef]
  54. Jansen, R.; Ruhlman, T. Genomics of Chloroplasts and Mitochondria; Springer: Berlin/Heidelberg, Germany, 2012. [Google Scholar]
  55. Shaul, O. How Introns Enhance Gene Expression. Int. J. Biochem. Cell Biol. 2017, 91, 145–155. [Google Scholar] [CrossRef]
  56. Chen, X.; Li, Q.; Li, Y.; Qian, J.; Han, J. Chloroplast Genome of Aconitum Barbatum Var. Puberulum (Ranunculaceae) Derived from CCS Reads Using the PacBio RS Platform. Front. Plant Sci. 2015, 6, 42. [Google Scholar] [CrossRef] [Green Version]
  57. Sharp, P.M.; Emery, L.R.; Zeng, K. Forces That Influence the Evolution of Codon Bias. Philos. Trans. R. Soc. B Biol. Sci. 2010, 365, 1203–1212. [Google Scholar] [CrossRef] [PubMed] [Green Version]
  58. Tang, W.; Luo, C. Molecular and Functional Diversity of RNA Editing in Plant Mitochondria. Mol. Biotechnol. 2018, 60, 935–945. [Google Scholar] [CrossRef]
  59. Shikanai, T. RNA Editing in Plant Organelles: Machinery, Physiological Function and Evolution. Cell Mol. Life Sci. 2006, 63, 698–708. [Google Scholar] [CrossRef]
  60. Konhar, R.; Debnath, M.; Vishwakarma, S.; Bhattacharjee, A.; Sundar, D.; Tandon, P.; Dash, D.; Biswal, D. The Complete Chloroplast Genome of Dendrobium Nobile, an Endangered Medicinal Orchid from North-East India and Its Comparison with Related Dendrobium Species. PeerJ 2019, 7, e7756. [Google Scholar] [CrossRef] [PubMed] [Green Version]
  61. Guisinger, M.M.; Kuehl, J.V.; Boore, J.L.; Jansen, R.K. Extreme Reconfiguration of Plastid Genomes in the Angiosperm Family Geraniaceae: Rearrangements, Repeats, and Codon Usage. Mol. Biol. Evol. 2010, 28, 583–600. [Google Scholar] [CrossRef] [Green Version]
  62. Li, J.; Yang, M.; Li, Y.; Jiang, M.; Liu, C.; He, M.; Wu, B. Chloroplast Genomes of Two Pueraria DC. Species: Sequencing, Comparative Analysis and Molecular Marker Development. FEBS Open Bio 2022, 12, 349–361. [Google Scholar] [CrossRef] [PubMed]
  63. Tian, C.; Li, X.; Wu, Z.; Li, Z.; Hou, X.; Li, F.Y. Characterization and Comparative Analysis of Complete Chloroplast Genomes of Three Species from the Genus Astragalus (Leguminosae). Front. Genet. 2021, 12, 705482. [Google Scholar] [CrossRef]
  64. Gan, J.; Li, Y.; Tang, D.; Guo, B.; Li, D.; Cao, F.; Sun, C.; Yu, L.; Yan, Z. The Complete Chloroplast Genomes of Gynostemma Reveal the Phylogenetic Relationships of Species within the Genus. Genes 2023, 14, 929. [Google Scholar] [CrossRef]
  65. Zhang, Z.; Zhang, D.-S.; Zou, L.; Yao, C.-Y. Comparison of Chloroplast Genomes and Phylogenomics in the Ficus Sarmentosa Complex (Moraceae). PLoS ONE 2022, 17, e0279849. [Google Scholar] [CrossRef]
  66. Contreras-Díaz, R.; Arias-Aburto, M.; van den Brink, L. Characterization of the Complete Chloroplast Genome of Zephyranthes Phycelloides (Amaryllidaceae, Tribe Hippeastreae) from Atacama Region of Chile. Saudi J. Biol. Sci. 2022, 29, 650–659. [Google Scholar] [CrossRef]
  67. Provan, J.; Powell, W.; Hollingsworth, P.M. Chloroplast Microsatellites: New Tools for Studies in Plant Ecology and Evolution. Trends Ecol. Evol. 2001, 16, 142–147. [Google Scholar] [CrossRef]
  68. Addisalem, A.B.; Esselink, G.D.; Bongers, F.; Smulders, M.J.M. Genomic Sequencing and Microsatellite Marker Development for Boswellia Papyrifera, an Economically Important but Threatened Tree Native to Dry Tropical Forests. AoB Plants 2015, 7, plu086. [Google Scholar] [CrossRef] [Green Version]
  69. Ebert, D.; Peakall, R. Chloroplast Simple Sequence Repeats (CpSSRs): Technical Resources and Recommendations for Expanding CpSSR Discovery and Applications to a Wide Array of Plant Species. Mol. Ecol. Resour. 2009, 9, 673–690. [Google Scholar] [CrossRef]
  70. Ishaq, M.N.; Ehirim, B.O.; Nwanyanwu, G.C.; Abubaka, R.I. DNA Fingerprinting Simple Sequence Repeat (SSR) Marker-Basedof Some Varieties of Rice (Oryza Sativa L.) Released in Nigeria. Afr. J. Biotechnol. 2019, 18, 242–248. [Google Scholar] [CrossRef] [Green Version]
  71. Kuang, D.-Y.; Wu, H.; Wang, Y.-L.; Gao, L.-M.; Zhang, S.-Z.; Lu, L. Complete Chloroplast Genome Sequence of Magnolia Kwangsiensis (Magnoliaceae): Implication for DNA Barcoding and Population Genetics. Genome 2011, 54, 663–673. [Google Scholar] [CrossRef] [PubMed] [Green Version]
  72. Raubeson, L.A.; Peery, R.; Chumley, T.W.; Dziubek, C.; Fourcade, H.M.; Boore, J.L.; Jansen, R.K. Comparative Chloroplast Genomics: Analyses Including New Sequences from the Angiosperms Nuphar advena and Ranunculus macranthus. BMC Genom. 2007, 8, 174. [Google Scholar] [CrossRef] [PubMed] [Green Version]
  73. Wang, W.; Messing, J. High-Throughput Sequencing of Three Lemnoideae (Duckweeds) Chloroplast Genomes from Total DNA. PLoS ONE 2011, 6, e24670. [Google Scholar] [CrossRef] [PubMed] [Green Version]
  74. Wakasugi, T.; Tsudzuki, J.; Ito, S.; Nakashima, K.; Tsudzuki, T.; Sugiura, M. Loss of All Ndh Genes as Determined by Sequencing the Entire Chloroplast Genome of the Black Pine Pinus Thunbergii. Proc. Natl. Acad. Sci. USA 1994, 91, 9794–9798. [Google Scholar] [CrossRef]
  75. Yao, G.; Jin, J.-J.; Li, H.-T.; Yang, J.-B.; Mandala, V.S.; Croley, M.; Mostow, R.; Douglas, N.A.; Chase, M.W.; Christenhusz, M.J.M.; et al. Plastid Phylogenomic Insights into the Evolution of Caryophyllales. Mol. Phylogenet Evol. 2019, 134, 74–86. [Google Scholar] [CrossRef] [PubMed]
  76. Fu, P.; Sun, S.; Twyford, A.D.; Li, B.; Zhou, R.; Chen, S.; Gao, Q.; Favre, A. Lineage-specific Plastid Degradation in Subtribe Gentianinae (Gentianaceae). Ecol. Evol. 2021, 11, 3286–3299. [Google Scholar] [CrossRef]
  77. Xu, X.-M.; Liu, D.-H.; Zhu, S.-X.; Wang, Z.-L.; Wei, Z.; Liu, Q.-R. Phylogeny of Trigonotis in China—With a Special Reference to Its Nutlet Morphology and Plastid Genome. Plant Divers. 2023, in press. [Google Scholar] [CrossRef]
  78. Huo, Y.; Gao, L.; Liu, B.; Yang, Y.; Kong, S.; Sun, Y.; Yang, Y.; Wu, X. Complete Chloroplast Genome Sequences of Four Allium Species: Comparative and Phylogenetic Analyses. Sci. Rep. 2019, 9, 12250. [Google Scholar] [CrossRef] [PubMed] [Green Version]
  79. Song, Y.; Zhang, Y.; Xu, J.; Li, W.; Li, M. Characterization of the Complete Chloroplast Genome Sequence of Dalbergia Species and Its Phylogenetic Implications. Sci. Rep. 2019, 9, 20401. [Google Scholar] [CrossRef] [PubMed] [Green Version]
  80. Zhang, X.-F.; Landis, J.B.; Wang, H.-X.; Zhu, Z.-X.; Wang, H.-F. Comparative Analysis of Chloroplast Genome Structure and Molecular Dating in Myrtales. BMC Plant Biol. 2021, 21, 219. [Google Scholar] [CrossRef]
  81. Dong, W.; Xu, C.; Li, C.; Sun, J.; Zuo, Y.; Shi, S.; Cheng, T.; Guo, J.; Zhou, S. Ycf1, the Most Promising Plastid DNA Barcode of Land Plants. Sci. Rep. 2015, 5, 8348. [Google Scholar] [CrossRef] [Green Version]
  82. Jiang, S.; Chen, F.; Qin, P.; Xie, H.; Peng, G.; Li, Y.; Guo, X. The Specific DNA Barcodes Based on Chloroplast Genes for Species Identification of Theaceae Plants. Physiol. Mol. Biol. Plants 2022, 28, 837–848. [Google Scholar] [CrossRef]
  83. Shi, H.; Yang, M.; Mo, C.; Xie, W.; Liu, C.; Wu, B.; Ma, X. Complete Chloroplast Genomes of Two Siraitia Merrill Species: Comparative Analysis, Positive Selection and Novel Molecular Marker Development. PLoS ONE 2019, 14, e0226865. [Google Scholar] [CrossRef]
  84. Zhang, X.; Zhou, T.; Yang, J.; Sun, J.; Ju, M.; Zhao, Y.; Zhao, G. Comparative Analyses of Chloroplast Genomes of Cucurbitaceae Species: Lights into Selective Pressures and Phylogenetic Relationships. Molecules 2018, 23, 2165. [Google Scholar] [CrossRef] [Green Version]
  85. Chacón, J.; Luebert, F.; Hilger, H.H.; Ovchinnikova, S.; Selvi, F.; Cecchi, L.; Guilliams, C.M.; Hasenstab-Lehman, K.; Sutorý, K.; Simpson, M.G.; et al. The Borage Family (Boraginaceae s. Str.): A Revised Infrafamilial Classification Based on New Phylogenetic Evidence, with Emphasis on the Placement of Some Enigmatic Genera. Taxon 2016, 65, 523–546. [Google Scholar] [CrossRef] [Green Version]
  86. Tang, C.; Li, S.; Wang, Y.; Wang, X. Comparative Genome/Transcriptome Analysis Probes Boraginales’ Phylogenetic Position, WGDs in Boraginales, and Key Enzyme Genes in the Alkannin/Shikonin Core Pathway. Mol. Ecol. Resour. 2019, 20, 228–241. [Google Scholar] [CrossRef]
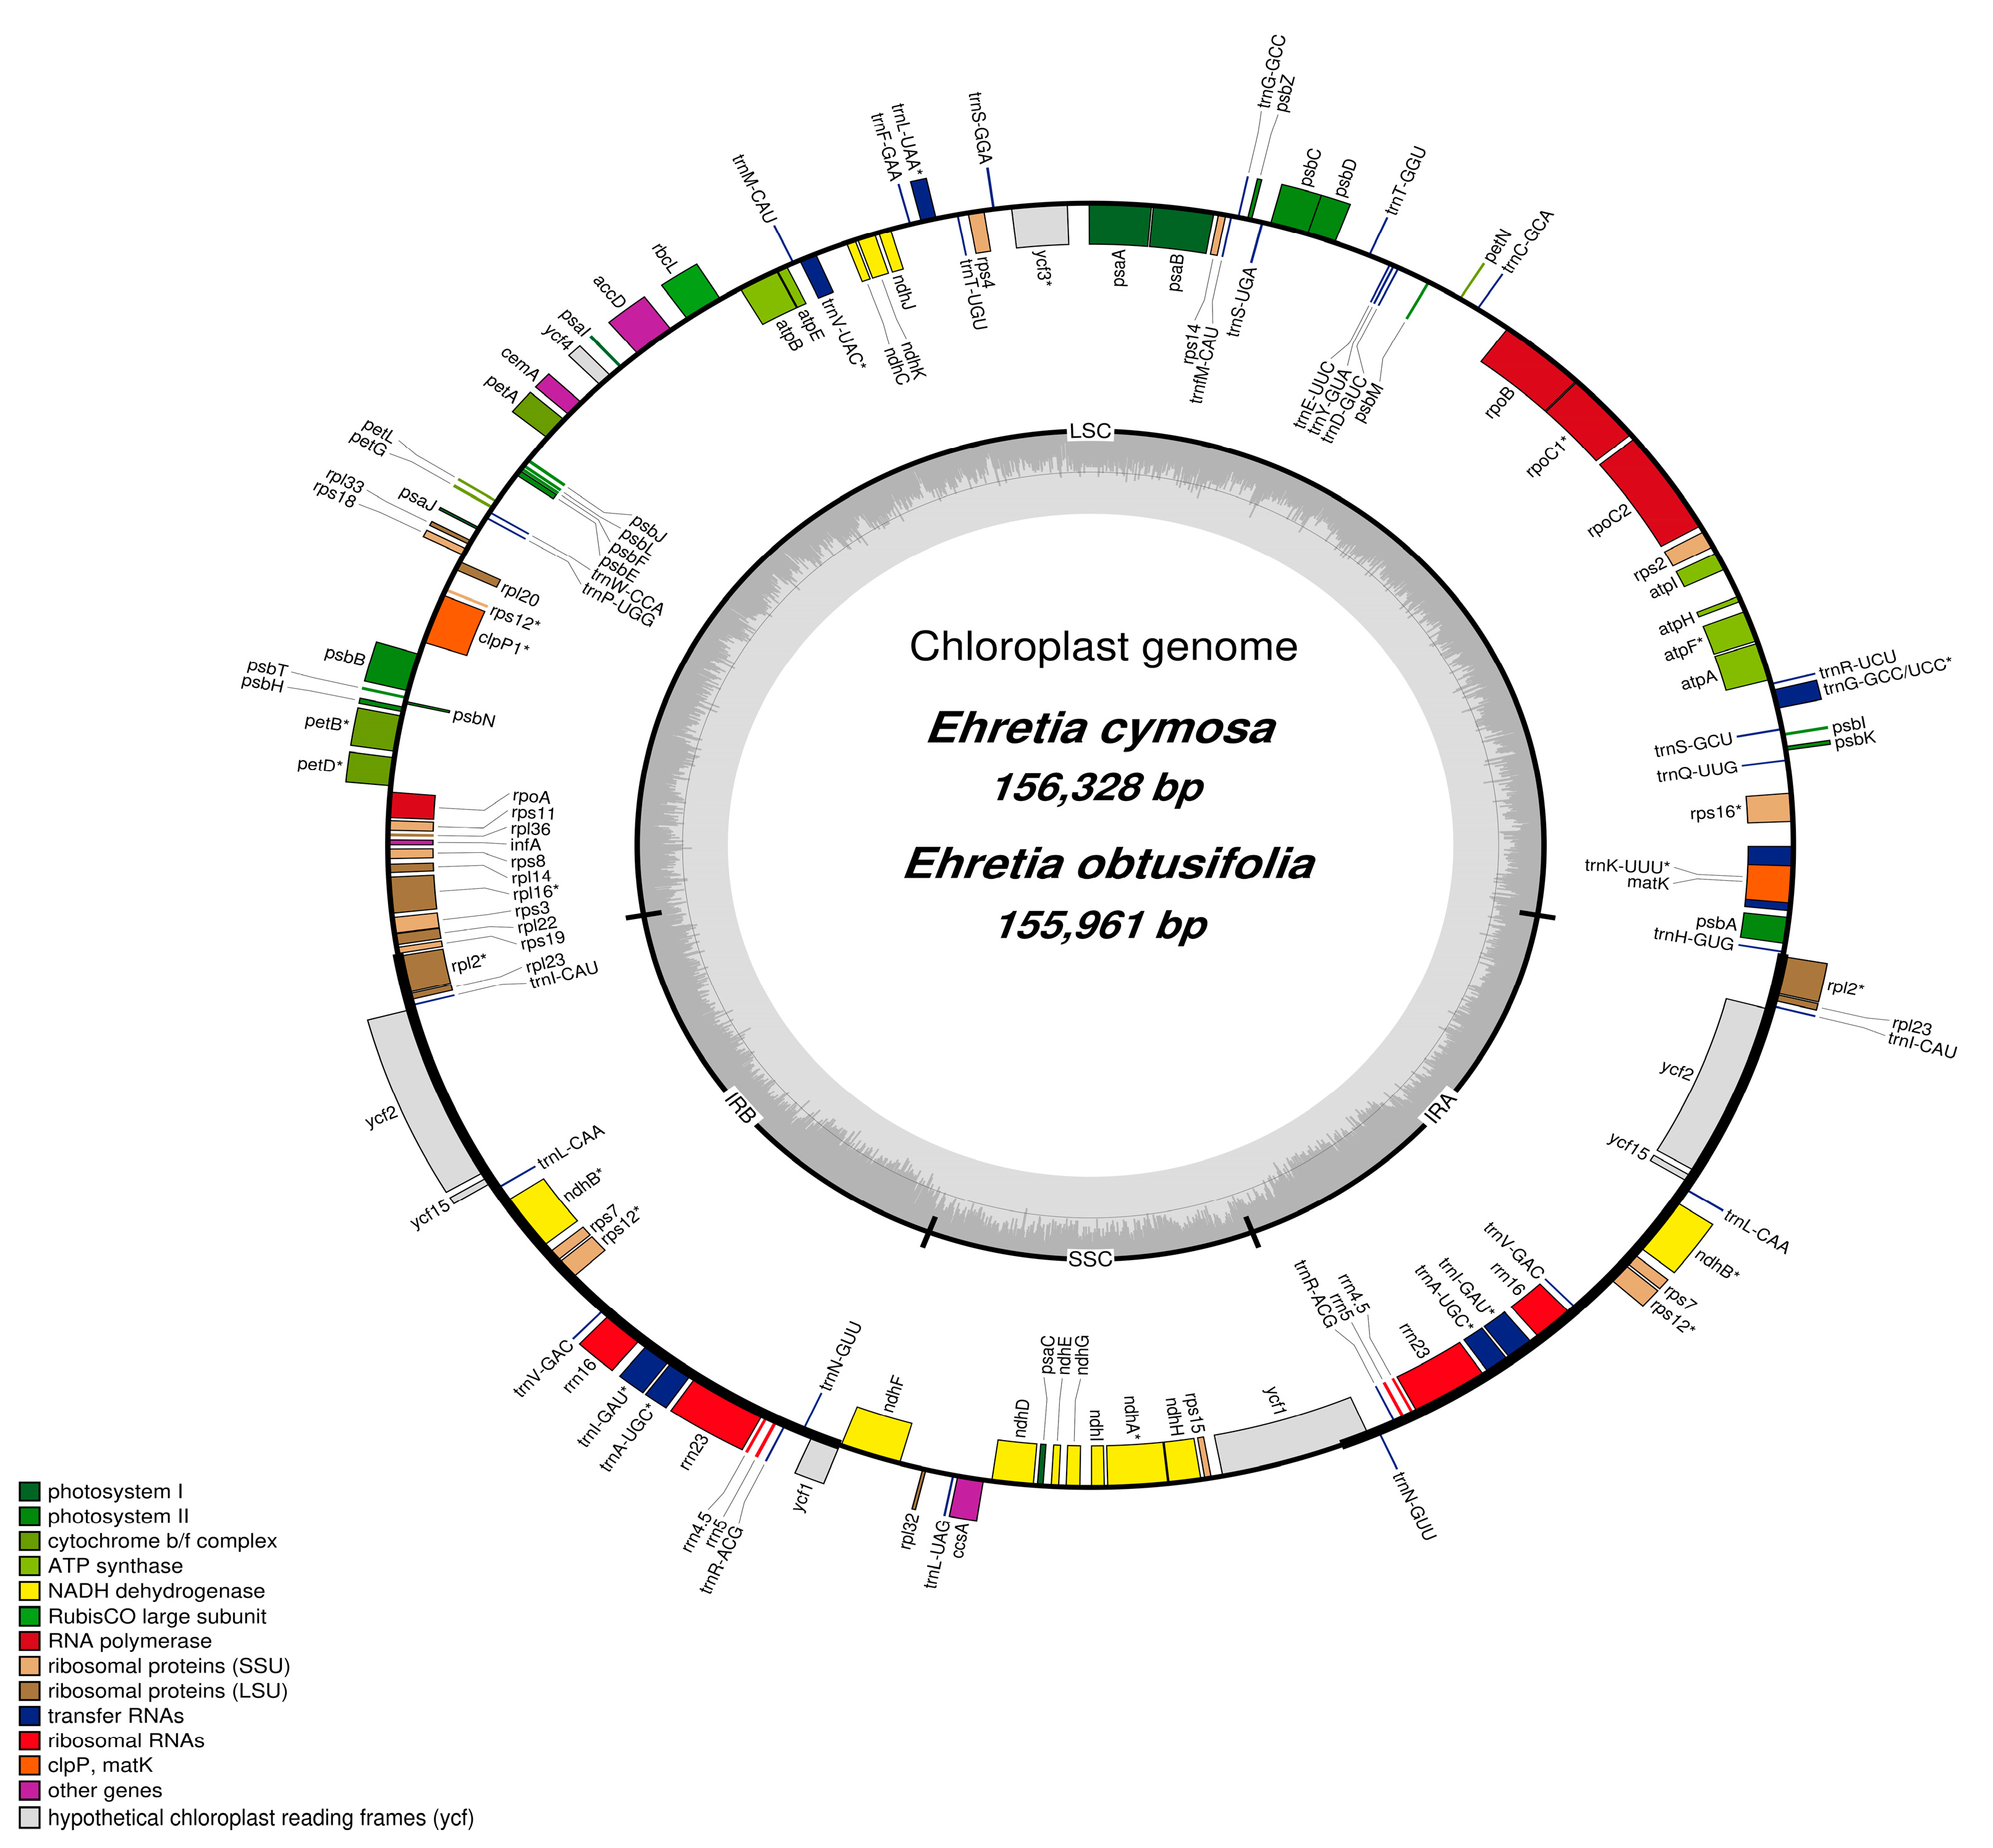
Figure 1. (A) Plant habit and flowers of E. cymosa, (B) plant habit and flowers of E. obtusifolia. Plant photos by M. Alawfi.
Forests 14 01486 g001
Figure 2. Chloroplast genome map of the E. cymosa and E. obtusifolia. Genes present in the inner part of the circles are transcribed in a clockwise direction. Genes present in the outer part of the circles are transcribed in an anti-clockwise direction. In the inner map, the brightly grey region refers to the AT contents, while the dark grey region refers to the GC content. The colored bars indicate functional genes. Asterisk symbol (*) refers to the genes with introns. The SSC and LSC represent the small and large single-copy regions. The IR represents inverted repeat regions.
Forests 14 01486 g002
Figure 3. Amino acid frequencies in E. cymosa and E. obtusifolia chloroplast genomes.
Forests 14 01486 g003
Figure 4. The predicted RNA editing site in Ehretia cymosa and Ehretia obtusifolia coding genes.
Forests 14 01486 g004
Figure 5. The number of different repeats in the chloroplast genomes of E. cymosa, E. obtusifolia, E. acuminata, E. dicksonii, and E. longiflora. C = complement, F = forward, P = palindromic, and R = reverse.
Forests 14 01486 g005
Figure 6. Number and types of SSR in the five Ehretia species.
Forests 14 01486 g006
Figure 7. Comparison between the IR, SSC, and LSC boundaries of the five Ehretia chloroplast genomes.
Forests 14 01486 g007
Figure 8. Visual alignment of the five Ehretia chloroplast genomes using E. cymosa as a reference. The x-axis refers to the genomic coordinate, whereas the y-axis refers to the identity percentage (50% to 100%). The top arrows refer to the direction of each gene. UTR = untranslated region; CNS = conserved non-coding regions. The sequence alignment was conducted using the mVISTA program.
Forests 14 01486 g008
Figure 9. The ratios of dS and dN/dS of 80 protein-coding genes from E. cymosa vs. E. obtusifolia chloroplast genomes.
Forests 14 01486 g009
Figure 10. The phylogenetic tree generated by BI and ML analyses based on 15 complete chloroplast genomes; the tree illustrates the relationships among four families of the order Boraginales and the number in the branch nodes express the (PP)/(BS) values.
Forests 14 01486 g010
Table 1. The base composition of E. cymosa and E. obtusifolia chloroplast genomes.
SpeciesEhretia cymosaEhretia obtusifolia
Genome size (bp)156,328155,961
IR (bp)25,78125,798
LSC (bp)86,62486,211
SSC (bp)18,14218,154
Total number of genes134134
rRNA44
tRNA3030
Protein-coding genes8080
T (U) %31.4031.40
C %19.2919.31
A %30.7230.70
G %18.5718.56
Overall GC content %37.8637.87
GC content in LSC %35.9135.91
GC content in SSC %32.1532.01
GC content in IR %43.1743.18
Table 2. The SSRs in two chloroplast genomes of E. cymosa and E. obtusifolia.
SSR TypeRepeat UnitSpecies
E. cymosaE. obtusifolia
MonoA/T
C/G
130
2
128
2
DiAT/AT44
TriAAG/CTT11
TetraAAAC/GTTT
AAAT/ATTT
1
2
1
2
PentaAATCC/ATTGG11
Disclaimer/Publisher’s Note: The statements, opinions and data contained in all publications are solely those of the individual author(s) and contributor(s) and not of MDPI and/or the editor(s). MDPI and/or the editor(s) disclaim responsibility for any injury to people or property resulting from any ideas, methods, instructions or products referred to in the content.

