
Landscape Function Analysis: Responses to Bush Encroachment in a Semi-Arid Savanna in the Molopo Region, South Africa

 , and
, and
Abstract
:1. Introduction
2. Materials and Methods
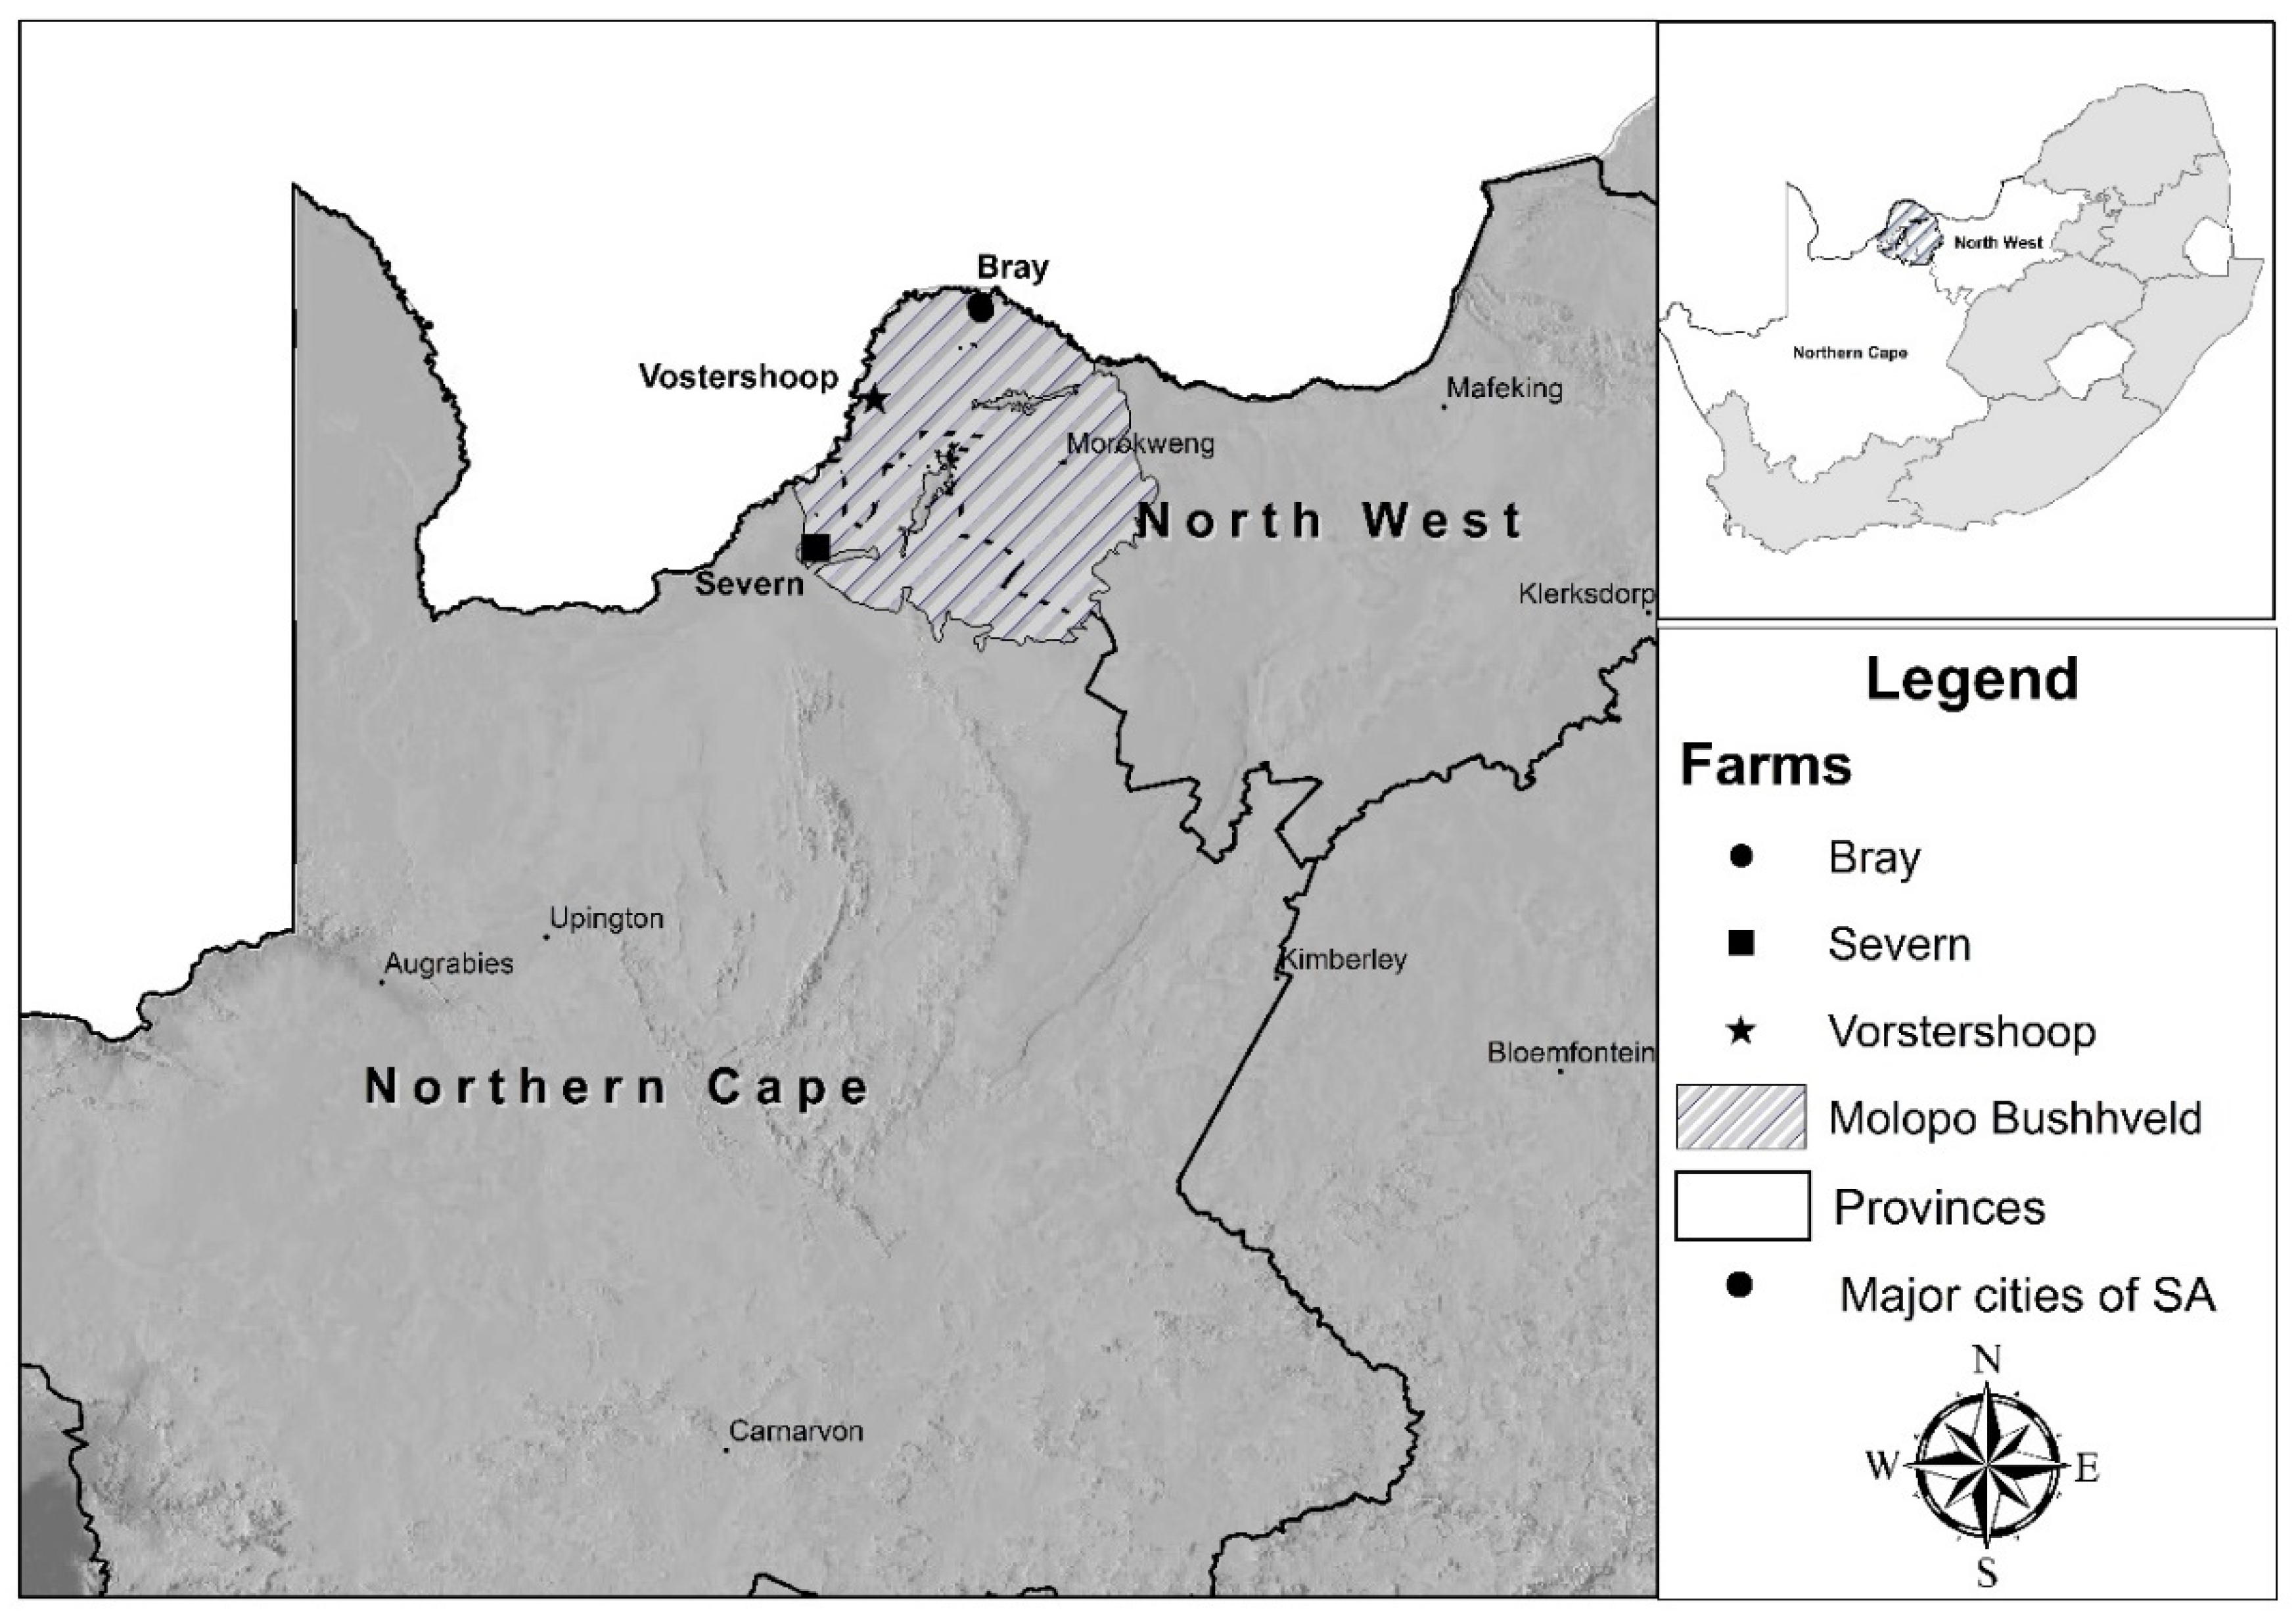
2.1. Study Area
2.2. Experimental Design and Sampling
2.3. Soil Analysis
2.4. Statistical Analysis
3. Results
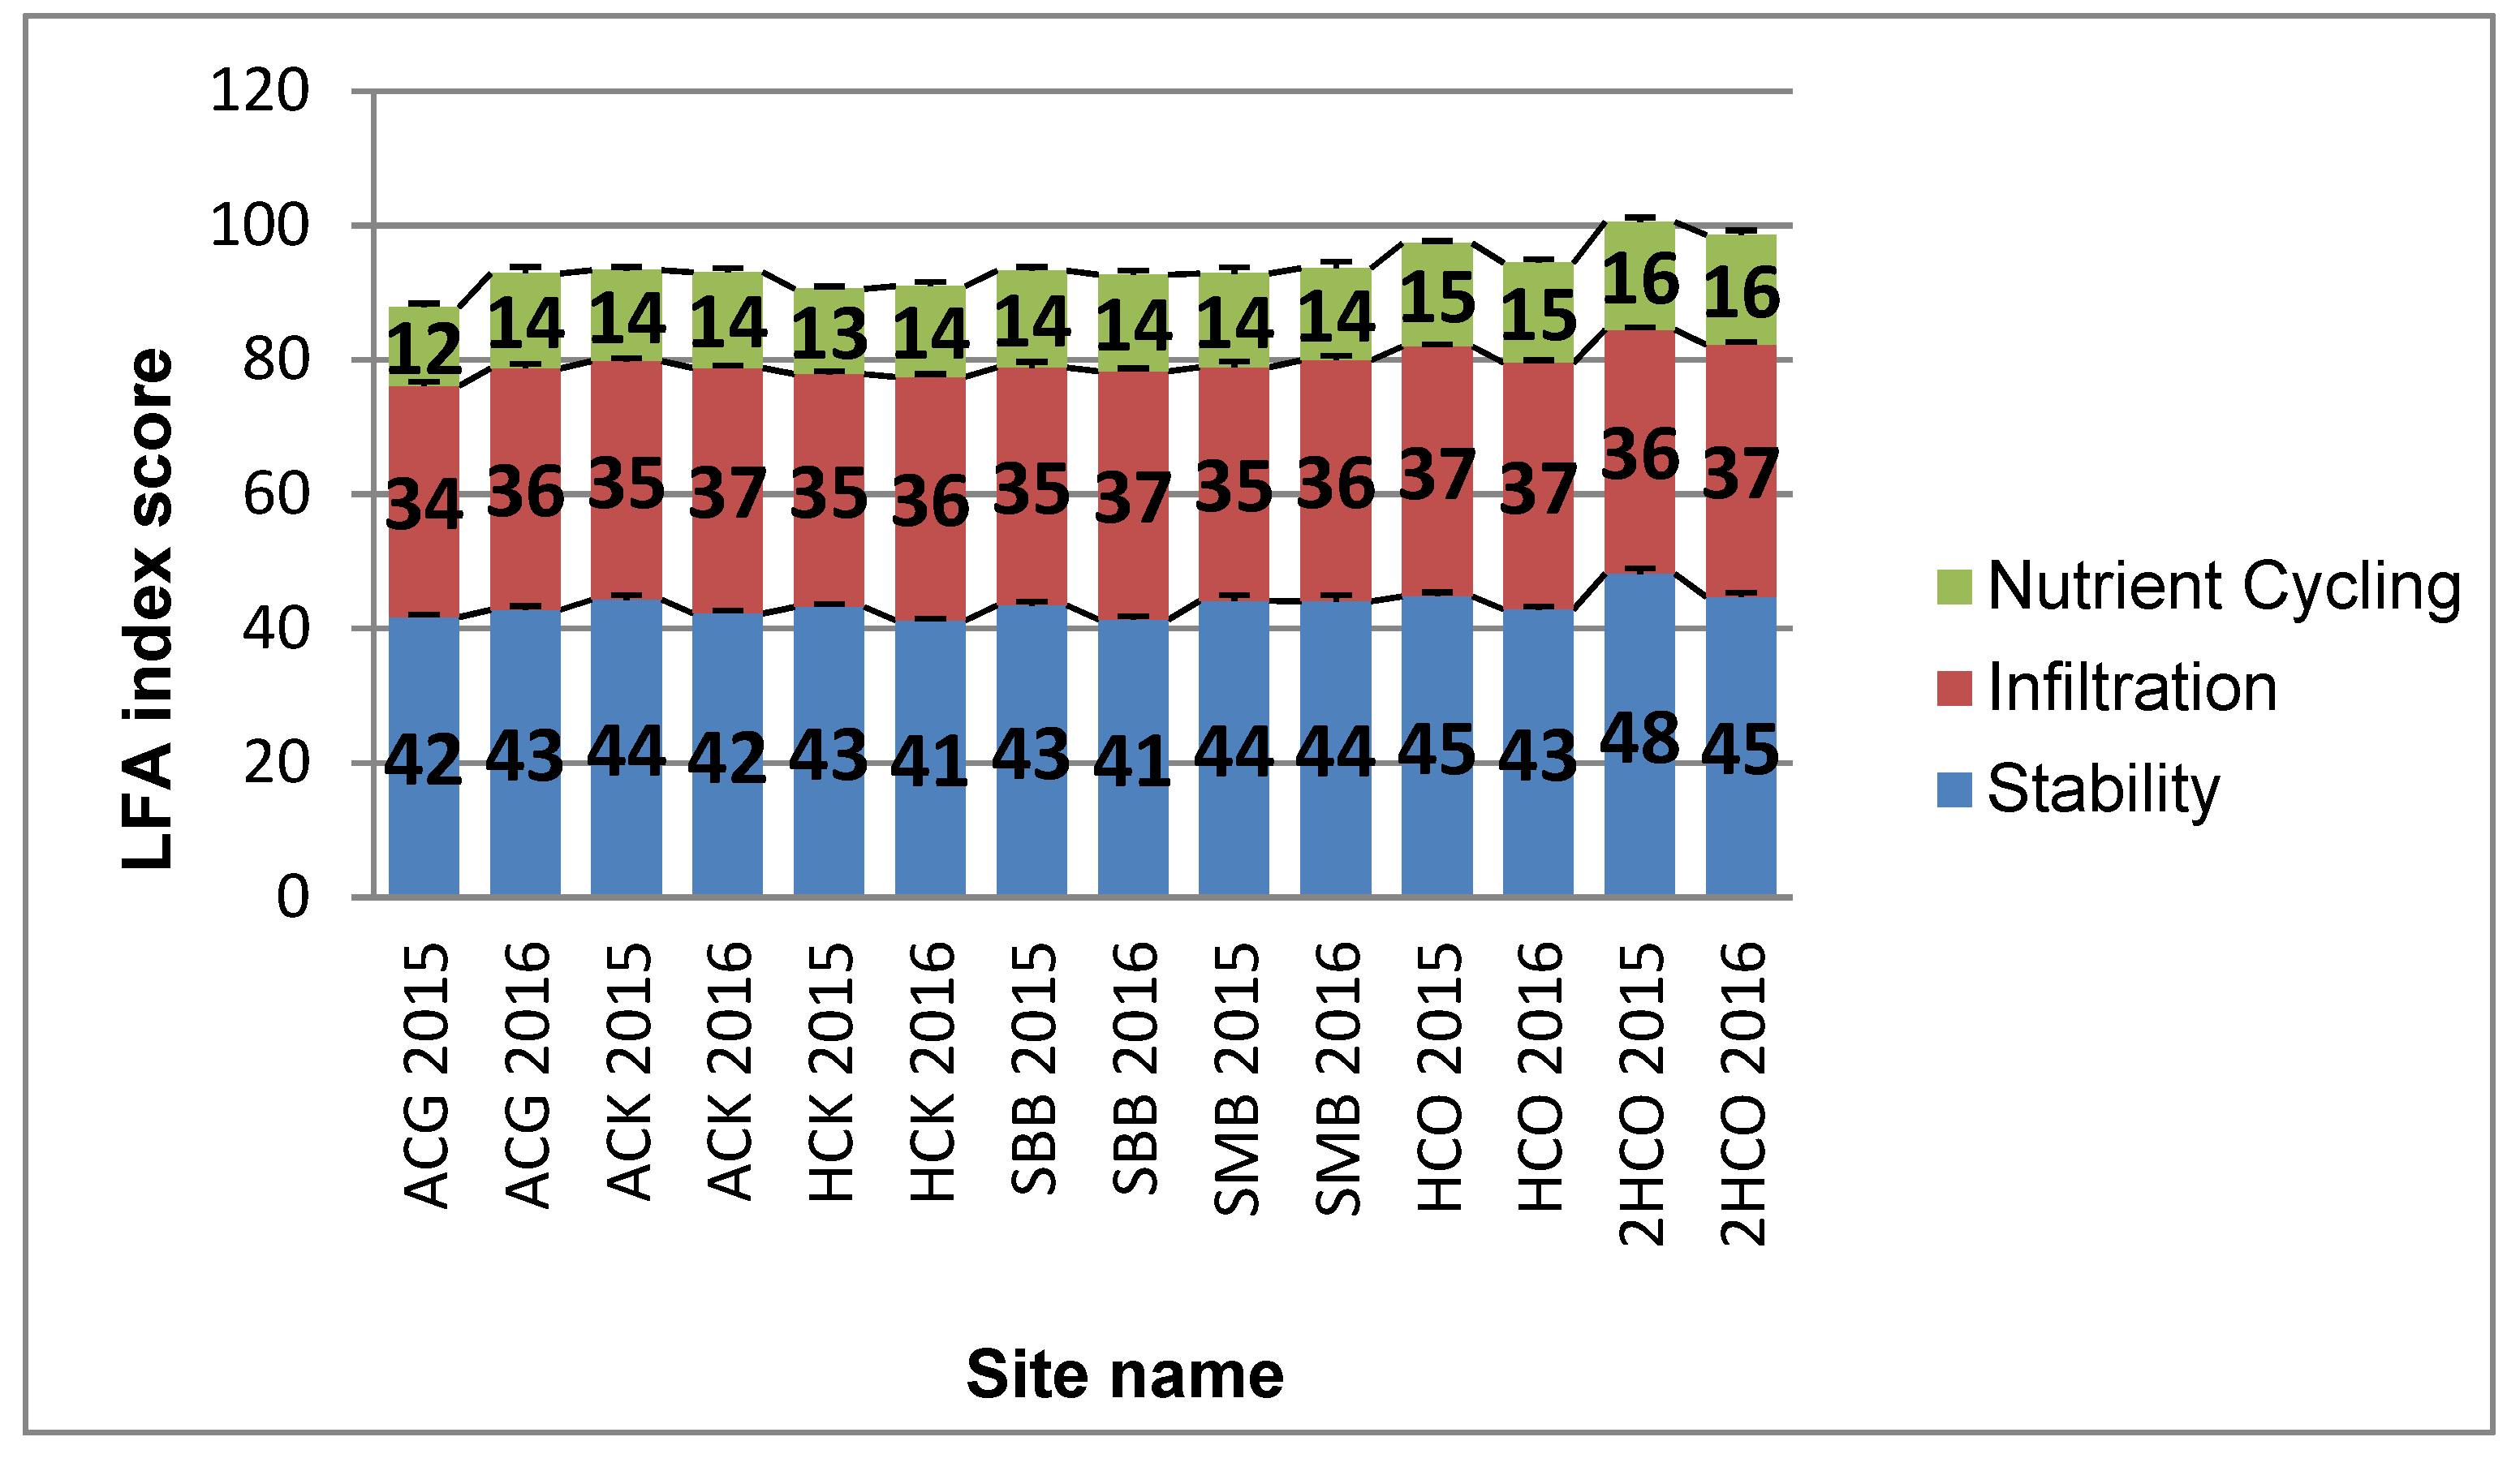
3.1. LFA Indices
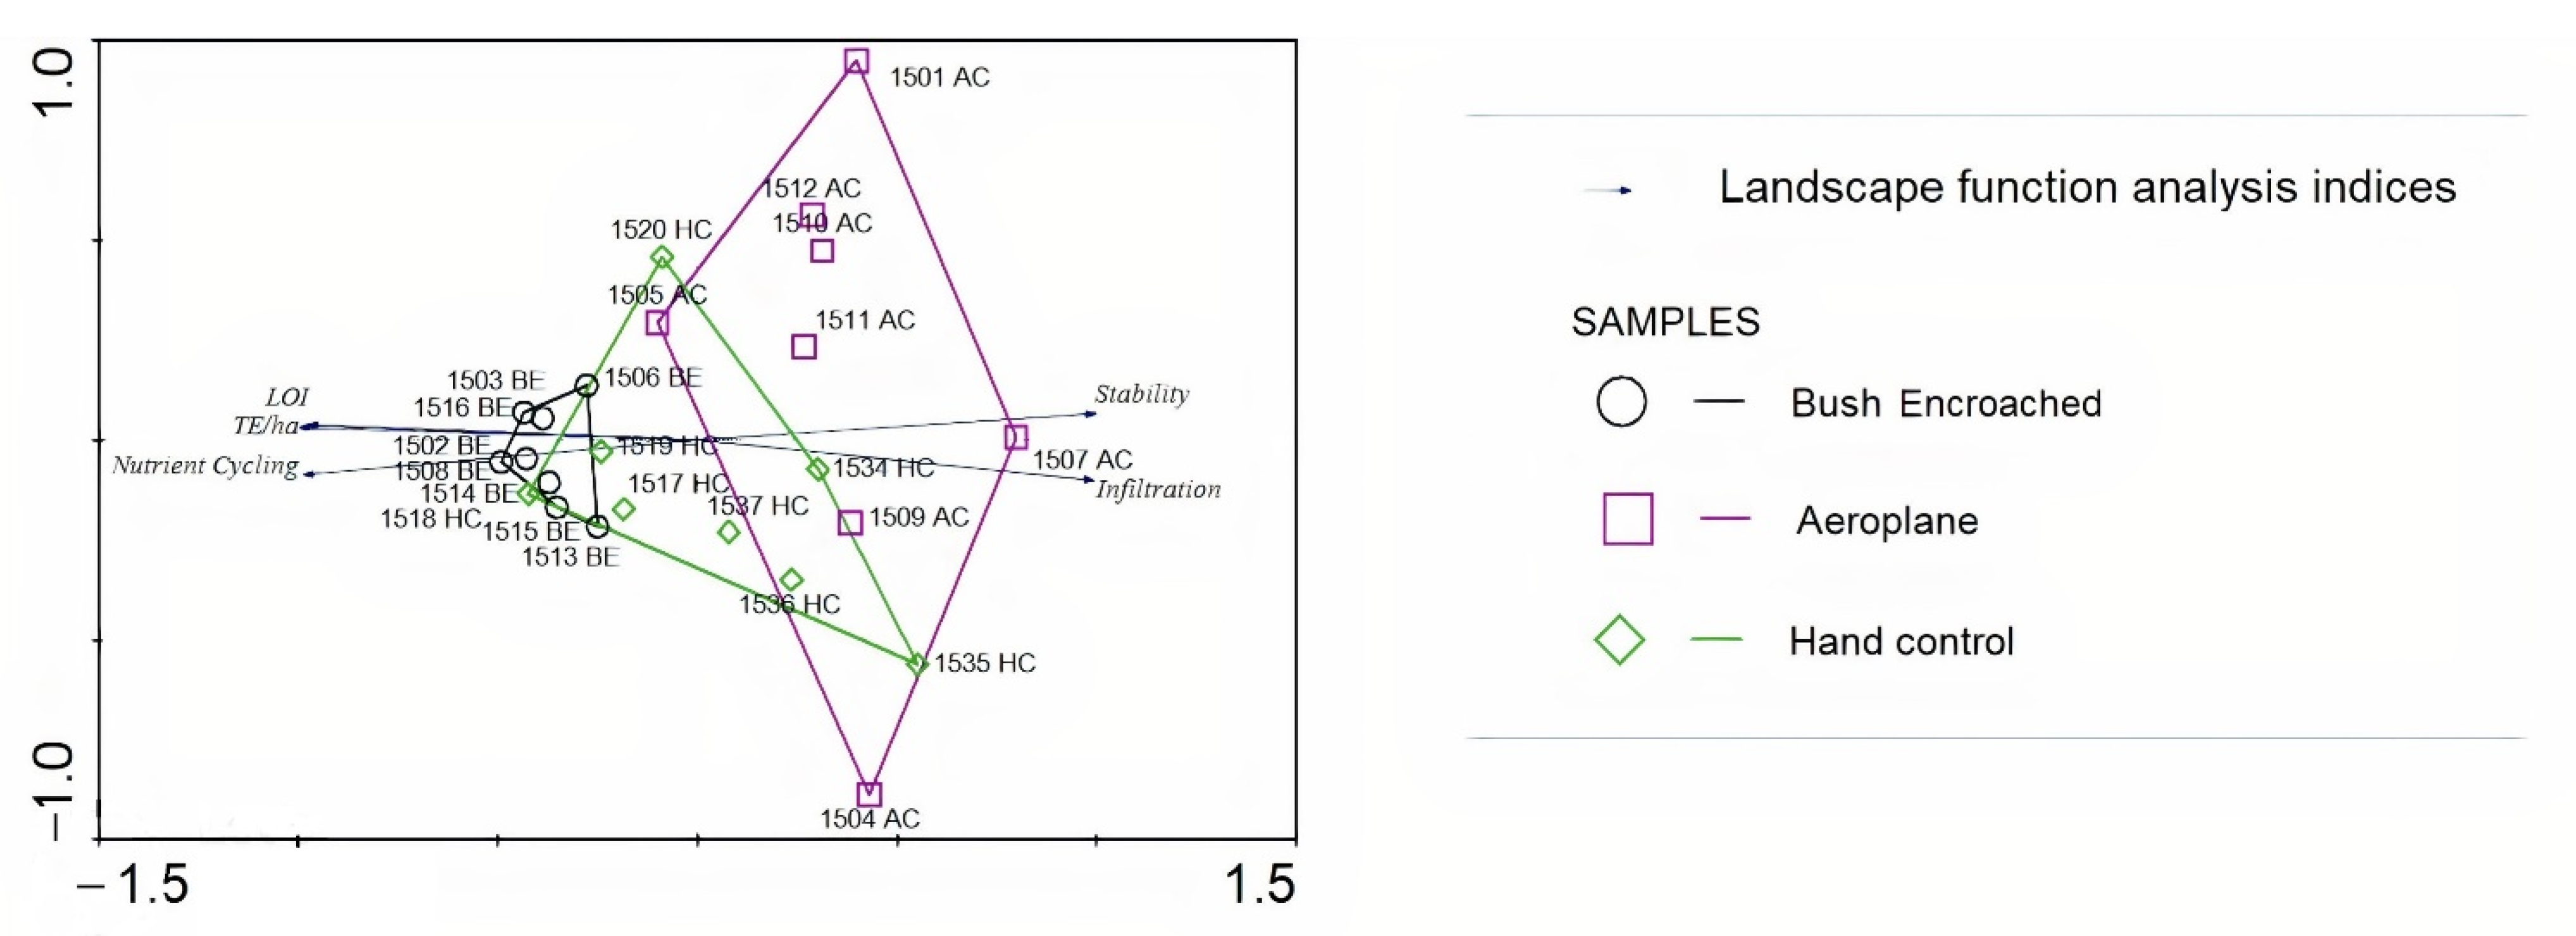
3.2. Association of Bush-Controlled and Bush-Encroached Sites Based on LFA Index Scores
3.3. Patch Type Associations with Soil Chemical Properties
3.4. Soil Chemical Properties across Treatments
4. Discussion
4.1. Landscape Function of Bush-Controlled and Bush-Encroached Sites
4.2. Soil Properties across Treatements and Patch Types
5. Conclusions
- Bush-encroached sites can be considered as fully functional landscapes in drought years that will persist in their current state for many years if no control technologies were to be applied.
- An increase in shrub cover can be considered as a means to compensate for the loss of function that would, initially, have been supplied by grassy swards since shrubs have different modes of using soil moisture and cycling mineral nutrients and also have the ability to create more robust, long-lasting litter. In this way, despite the loss of herbaceous vegetation, the functioning of bush-encroached landscapes is largely retained but by different biophysical processes.
- It is also possible that shrubs may protect landscapes against much more serious degradation under drought conditions. The functionality of bush-encroached sites is further reinforced by the similarity between the scores derived for bush-controlled sites in this study. This, however, should be viewed cautiously, since sampling was conducted during an extreme drought event. Nutrient cycling, stability and infiltration—all indicators of the functionality of the landscape—did not differ between bush-controlled and bush-encroached sites. Long-term investigation is therefore proposed.
- Hand-controlled (HC) and hand-controlled with re-application (2HC) sites had the highest functionality scores for both survey years. These high functionality scores can be ascribed to the high amounts of litter and cryptogams found throughout the three different treatments. The shade created by larger grass litter and shrub litter patches found at these sites provided suitable sub-habitats for the cryptogams. The deep, loose, sandy soils of the Molopo region also played a role in the low stability and above-average infiltration scores recorded for all sites as well as the increase in deep-soil mineral nutrient cycling. Large inter-patches found between most of the nutrient accumulating patches played a vital role in similar functionality scores being recorded for bush-controlled and bush-encroached sites over both survey years. High grazing intensities and the lack of forage, as a result of the drought, could be the two main contributing factors that caused the increase in inter-patch size, as well as the decrease in the size and frequency of the nutrient accumulating patches.
Author Contributions
Funding
Institutional Review Board Statement
Informed Consent Statement
Data Availability Statement
Acknowledgments
Conflicts of Interest
Appendix A

| Study Area Location | Farm 1: Bray (Figure 1) Lat. (South): 25.38378 Long. (East): 23.38014 | Farm 2: Bray (Figure 1) Lat. (South): 25.36234 Long. (East): 23.37437 | Farm 3: Vorstershoop (Figure 1) Lat. (South): 25.81379 Long. (East): 22.8565 | Farm 4: Severn (Figure 1) Lat. (South): 26.54924 Long. (East): 22.56828 |
|---|---|---|---|---|
| Total number of sampling sites | AC: 4 sites BT: 4 sites | AC: 4 sites BT: 4 sites HC: 4 sites | BT: 3 sites SB: 3 sites SM: 3 sites | BT: 4 sites HC: 4 sites HC2: 4 sites |
| Land tenure type | Commercial game farming | Commercial cattle farming | Commercial cattle farming | Commercial cattle farming |
| Stock composition | Game:
| Cattle and horses | Cattle | Cattle |
| Current stocking rate | 10 large stock units (LSU) per ha | 10 LSU/ha | 12 LSU/ha | 10 LSU/ha |
| Grazing system | Open system—no camps (paddocks) | Four-camp rotational grazing system rotating every two weeks | Eight-camp rotational grazing for nine days; resting period of 63 days per camp | Six-camp rotational grazing with two camps resting for an entire growing season |
| Chemical treatment with arboricide | Non-selective Tebuthiuron granules were applied in a grid formation by aeroplane (AC) at a dosage of 2.5–3 kg/ha to camps measuring 1000 ha. The camps were treated in 2008/2009. Chemicals are reapplied every 10 years. Reapplication falls outside this project’s timeframe. Selected species: Senegalia mellifera, Vachellia luederitzii | Non-selective (AC) and selective (HC). Tebuthiuron granules were applied by AC and by hand (HC) at a dosage of 3 kg/ha to camps measuring 245 ha. The camps were treated in 2008/2009. Selected species: Dichrostachys cinerea, S. mellifera, Terminalia sericea V. luederitzii | Stem burning (SB) was first conducted in 1982. The second SB treatment was conducted in 1999/2000. Selected species: S. mellifera, V. luederitzii | The double hand-control sites (HC2) were treated in 2000 and followed up in 2012 at the start of the growing season (Oct./Sep.). Single hand-control sites (HC) were treated in 2006 (selective). Tebuthiuron granules were used. The treated HC2 camps measured 240 ha and 260 ha, and the HC camps measured 119 ha and 115 ha. Species selected: Rhigozum trichotomum, S. mellifera, V. luederitzii |
Appendix B. Description of Patches
Appendix B.1. Inter-Patches (Ips)

Appendix B.2. Grass Patches (GPs)

Appendix B.3. Grass Litter Patches (GLPs)

Appendix B.4. Litter Patches (LPs)

Appendix B.5. Shrub Patches (SPs)

Appendix B.6. Shrub Litter Patches (SLPs)

Appendix B.7. Grass Shrub Patches (GSPs)

References
- Kgosikoma, O.E.; Harvie, B.A.; Mojeremane, W. Bush encroachment in relation to rangeland management systems and environmental conditions in Kalahari ecosystem of Botswana. Afr. J. Agric. Res. 2012, 7, 2312–2319. [Google Scholar] [CrossRef]
- Liniger, H.; Studer, R.M. Sustainable Rangeland Management in Sub-Saharan Africa–Guidelines to Good Practice; University of Bern: Bern, Switzerland, 2019. [Google Scholar]
- Mucina, L.; Rutherford, M. The Vegetation of South Africa, Lesotho and Swaziland; South African National Biodiversity Institute: Pretoria, South Africa, 2006. [Google Scholar]
- Dougill, A.J.; Akanyang, L.; Perkins, J.S.; Eckardt, F.D.; Stringer, L.C.; Favretto, N.; Atlhopheng, J.; Mulale, K. Land use, rangeland degradation and ecological changes in the southern Kalahari, Botswana. Afr. J. Ecol. 2016, 54, 59–67. [Google Scholar] [CrossRef] [Green Version]
- Zerbo, I.; Bernhardt-Römermann, M.; Ouédraogo, O.; Hahn, K.; Thiombiano, A. Diversity and occurrence of herbaceous communities in West African savannas in relation to climate, land use and habitat. Folia Geobot. 2018, 53, 17–39. [Google Scholar] [CrossRef]
- Siebert, F.; Van Staden, N.; Komape, D.M.; Swemmer, A.M.; Siebert, S.J. Effects of land-use change on herbaceous vegetation in a semi-arid Mopaneveld savanna. Bothalia 2021, 51, 1–26. [Google Scholar] [CrossRef]
- Hoffman, T.; Ashwell, A. Nature Divided: Land Degradation in South Africa; University of Cape Town Press: Cape Town, South Africa, 2001. [Google Scholar]
- Smit, G.N. An approach to tree thinning to structure southern African savannas for long-term restoration from bush encroachment. J. Environ. Manag. 2004, 71, 179–191. [Google Scholar] [CrossRef]
- Reed, M.S.; Dougill, A.J. Linking degradation assessment to sustainable land management: A decision support system for Kalahari pastoralists. J. Arid. Environ. 2010, 74, 149–155. [Google Scholar] [CrossRef]
- O’Connor, T.G.; Puttick, J.R.; Hoffman, M.T. Bush encroachment in southern Africa: Changes and causes. Afr. J. Range Forage Sci. 2014, 31, 67–88. [Google Scholar] [CrossRef]
- Almeida de Souza, A.; Galvão, L.S.; Korting, T.S.; Prieto, J.D. Dynamics of savanna clearing and land degradation in the newest agricultural frontier in Brazil. GIsci. Remote Sens. 2020, 57, 965–984. [Google Scholar] [CrossRef]
- Joubert, D.F.; Rothauge, A.; Smit, G.N. A conceptual model of vegetation dynamics in the semiarid Highland savanna of Namibia, with particular reference to bush thickening by Acacia mellifera. J. Arid. Environ. 2008, 72, 2201–2210. [Google Scholar] [CrossRef]
- Eldridge, D.J.; Bowker, M.A.; Maestre, F.T.; Roger, E.; Reynolds, J.F.; Whitford, W.G. Impacts of shrub encroachment on ecosystem structure and functioning: Towards a global synthesis. Ecol. Lett. 2011, 14, 709–722. [Google Scholar] [CrossRef]
- Ward, D. Do we understand the causes of bush encroachment in African savannas? Afr. J. Range Forage Sci. 2005, 22, 101–105. [Google Scholar] [CrossRef]
- Eldridge, D.J.; Maestre, F.T.; Maltez-Mouro, S.; Bowker, M.A. A global database of shrub encroachment effects on ecosystem structure and functioning: Ecological Archives E093-234. Ecology 2012, 93, 2499. [Google Scholar] [CrossRef] [Green Version]
- Lukomska, N.; Quaas, M.F.; Baumgärtner, S. Bush encroachment control and risk management in semi-arid rangelands. J. Environ. Manag. 2014, 145, 24–34. [Google Scholar] [CrossRef] [Green Version]
- Grant, W.E.; Hamilton, W.T.; Quintanilla, E. Sustainability of agroecosystems in semi-arid grasslands: Simulated management of woody vegetation in the Rio Grande Plains of southern Texas and northeastern Mexico. Ecol. Model. 1999, 124, 29–42. [Google Scholar] [CrossRef]
- Angassa, A.; Oba, G. Bush encroachment control demonstrations in southern Ethiopia: 1. woody species survival strategies with implications for herder land management. Afr. J. Ecol. 2009, 47, 63–76. [Google Scholar] [CrossRef]
- De Klerk, J.N. Bush Encroachment in Namibia: Report on Phase 1 of the Bush Encroachment Research, Monitoring, and Management Project; Ministry of Environment and Tourism, Directorate of Environmental Affairs: Windhoek, Namibia, 2004.
- Sankaran, M.; Ratnam, J.; Hanan, N.P. Tree–grass coexistence in savannas revisited–insights from an examination of assumptions and mechanisms invoked in existing models. Ecol. Lett. 2004, 7, 480–490. [Google Scholar] [CrossRef]
- Scholes, R.; Walker, B. An African Savanna; Cambridge University Press: Cambridge, UK, 2004. [Google Scholar]
- Higgins, S.I.; Bond, W.J.; Trollope, W.S.W. Fire, resprouting and variability: A recipe for grass–tree coexistence in savanna. J. Ecol. 2000, 88, 213–229. [Google Scholar] [CrossRef]
- Owen-Smith, N. Veld management in South Africa. In Veld Management in South Africa; Tainton, N., Ed.; University of Natal Press: Pietermaritzburg, South Africa, 1999. [Google Scholar]
- Snyman, H.A. Soil seed bank evaluation and seedling establishment along a degradation gradient in a semi-arid rangeland. Afr. J. Range Forage Sci. 2004, 21, 37–47. [Google Scholar] [CrossRef]
- Snyman, H.A.D.; Du Preez, C.C. Rangeland degradation in a semi-arid South Africa—II: Influence on soil quality. J. Arid Environ. 2005, 60, 483–507. [Google Scholar] [CrossRef]
- Ludwig, J.A.; Wiens, J.A.; Tongway, D.J. A scaling rule for landscape patches and how it applies to conserving soil resources in savannas. Ecosystems 2000, 3, 84–97. [Google Scholar] [CrossRef]
- Moussa, A.S.; Van Rensburg, L.; Kellner, K.; Bationo, A. Exploring differences of soil quality as related to management in semiarid rangelands in the western Bophirima District, North West province, South Africa. Afr. J. Range Forage Sci. 2009, 26, 27–36. [Google Scholar] [CrossRef]
- Homewood, K.; Rodgers, W.A. Pastoralism, conservation and the overgrazing controversy. In Conservation in Africa: Peoples, Policies and Practice; Anderson, D., Grove, R.H., Eds.; Cambridge University Press: Cambridge, UK, 1987. [Google Scholar]
- Wiegand, K.; Saltz, D.; Ward, D. A patch-dynamics approach to savanna dynamics and woody plant encroachment–insights from an arid savanna. Perspect. Plant Ecol. Evol. Syst. 2006, 7, 229–242. [Google Scholar] [CrossRef]
- Snyman, H.A.; Van Rensburg, W.L.J. Effect of slope and plant cover on run-off, soil loss and water use efficiency of natural veld. J. Grassland Soc. S. Afr. 1986, 3, 153–158. [Google Scholar] [CrossRef]
- Teague, W.R.; Smit, G.N. Relations between woody and herbaceous components and the effects of bush-clearing in southern African savannas. J. Grassland Soc. S. Afr. 1992, 9, 60–71. [Google Scholar] [CrossRef]
- Harmse, C.J.; Kellner, K.; Dreber, N. Restoring productive rangelands: A comparative assessment of selective and non-selective chemical bush control in a semi-arid Kalahari savanna. J. Arid Environ. 2016, 135, 39–49. [Google Scholar] [CrossRef]
- Havstad, K.M.; Peters, D.P.C.; Skaggs, R.; Brown, J.; Bestelmeyer, B.; Fredrickson, E.; Herrick, J.; Wright, J. Ecological services to and from rangelands of the United States. Ecol. Econ. 2007, 64, 261–268. [Google Scholar] [CrossRef]
- Schwilch, G.; Hessel, R.; Verzandvoort, S. Desire for Greener Land: Options for Sustainable Land Management in Drylands; CTA/Alterra: Alterra, Wageningen University & Research: Wageningen, The Netherlands, 2012. [Google Scholar]
- Gibbens, R.P.; McNeely, R.P.; Havstad, K.M.; Beck, R.F.; Nolen, B. Vegetation changes in the Jornada Basin from 1858 to 1998. J. Arid. Environ. 2005, 61, 651–668. [Google Scholar] [CrossRef]
- Maestre, F.T.; Bowker, M.A.; Puche, M.D.; Belén Hinojosa, M.; Martínez, I.; García-Palacios, P.; Castillo, A.P.; Soliveres, S.; Luzuriaga, A.L.; Sánchez, A.M. Shrub encroachment can reverse desertification in semi-arid Mediterranean grasslands. Ecol. Lett. 2009, 12, 930–941. [Google Scholar] [CrossRef]
- Van Auken, O.W. Causes and consequences of woody plant encroachment into western North American grasslands. J. Environ. Manag. 2009, 90, 2931–2942. [Google Scholar] [CrossRef]
- Archer, S.R. Rangeland conservation and shrub encroachment: New perspectives on an old problem. In Wild Rangelands: Conserving Wildlife While Maintaining Livestock in Semi-Arid Ecosystems; Du Toit, J.T., Kock, R., Deutsch, J., Eds.; John Wiley & Sons: Hoboken, NJ, USA, 2012. [Google Scholar]
- Smit, G.N.; Richter, C.G.F.; Aucamp, A.J. Bush encroachment: An approach to understanding and managing the problem. In Veld Management in South Africa; Tainton, N.M., Ed.; University of Natal Press: Pietermaritzburg, South Africa, 1999; pp. 246–260. [Google Scholar]
- De Beer, A.S.; Jordaan, F.P. LandCare Guidelines for Bush Control Projects; North West Province: Potchefstroom, South Africa, 2001. [Google Scholar]
- Barac, A.S. EcoRestore: A Decision Support System for the Restoration of Degraded Rangelands in Southern Africa; North-West University: Potchefstroom, South Africa, 2003. [Google Scholar]
- Tongway, D.; Hindley, N. Landscape function analysis: Procedures for monitoring and assessing landscapes with special reference to minesites and rangelands. In Landscape Function Analysis: Procedures for Monitoring and Assessing Landscapes with Special Reference to Minesites and Rangelands; Tongway, D.J., Hindley, N., Eds.; CSIRO Sustainable Ecosystems: Canberra, Australia, 2004. [Google Scholar]
- Donaldson, C.H. Control of blackthorn in the Molopo area with special reference to fire. Proc. Annu. Congr. Grassl. Soc. S. Afr. 1966, 1, 57–62. [Google Scholar] [CrossRef]
- Harmse, C.J. Evaluation of Restoration and Management Actions in the Molopo Savanna of South Africa: An Integrative Perspective; North-West University: Potchefstroom, South Africa, 2013. [Google Scholar]
- Scholes, R.J.; Dowty, P.R.; Caylor, K.; Parsons, D.A.B.; Frost, P.G.H.; Shugart, H.H. Trends in savanna structure and composition along an aridity gradient in the Kalahari. J. Veg. Sci. 2002, 13, 419–428. [Google Scholar] [CrossRef]
- Thomas, A.D.; Dougill, A.J.; Berry, K.; Byrne, J.A. Soil crusts in the Molopo basin, southern Africa. NW Geogr. 2002, 2, 10–19. [Google Scholar]
- Sankaran, M.; Hanan, N.P.; Scholes, R.J.; Ratnam, J.; Augustine, D.J.; Cade, B.S.; Gignoux, J.; Higgins, S.I.; Le Roux, X.; Ludwig, F.; et al. Determinants of woody cover in African savannas. Nature 2005, 438, 846–849. [Google Scholar] [CrossRef]
- Rutherford, M.C.; Mucina, L.; Bredenkamp, G.J.; Smit, J.H.L.; Scott-Shaw, C.R.; Hoare, D.B.; Goodman, S.M.; Bezuidenhout, H.; Scott, L.; Ellis, F. Savanna biome. In The Vegetation of South Africa, Lesotho and Swaziland; Mucina, L., Rutherford, M.C., Eds.; South African National Biodiversity Institute: Pretoria, South Africa, 2006. [Google Scholar]
- Sankaran, M.; Ratnam, J.; Hanan, N. Woody cover in African savannas: The role of resources, fire and herbivory. Glob. Ecol. Biogeogr. 2008, 17, 236–245. [Google Scholar] [CrossRef]
- Thomas, D.; Shaw, P.A. The Kalahari Environment; Cambridge University Press: Cambridge, UK, 1991. [Google Scholar]
- Nash, D.J.; Endfield, G.H. A 19th century climate chronology for the Kalahari region of central southern Africa derived from missionary correspondence. Int. J. Climatol. 2002, 22, 821–841. [Google Scholar] [CrossRef] [Green Version]
- Donaldson, C.H.; Kelk, D.M. An investigation of the veld problems of the Molopo area: I. Early findings. Proc. Annu. Congr. Grassl. Soc. S. Afr. 1970, 5, 50–57. [Google Scholar] [CrossRef]
- Walker, A.S.D.; Key, R.M.; Pouliquen, G.; Gunn, G.; Sharrock, J.; McGeorge, I.; Koketso, M.; Farr, J. Geophysical modelling of the Molopo Farms Complex in southern Botswana; implications for its emplacement within the ~2 Ga large igneous provinces of southern and central Africa. S. Afr. J. Geol. 2010, 113, 381–400. [Google Scholar] [CrossRef] [Green Version]
- Reichhard, F.J. The Molopo Farms Complex, Botswana; history, stratigraphy, petrography, petrochemistry and Ni-Cu-PGE mineralization. Explor. Min. Geol. 1994, 3, 263–284. [Google Scholar]
- Johnson, M.R.; Anhauesser, C.R.; Thomas, R.J. Ultramafic and mafic intrusions of the Kaapvaal craton. In The Geology of South Africa; Johnson, M.R., Anhaeusser, C.R., Thomas, R.J., Eds.; Geological Society of South Africa: Johannesburg, South Africa, 2006. [Google Scholar]
- Low, A.B.; Rebelo, A.G. Vegetation of South Africa, Lesotho and Swaziland: A Companion to the Vegetation Map of South Africa, Lesotho and Swaziland; Department of Environmental Affairs & Tourism: Pretoria, South Africa, 1998. [Google Scholar]
- Sims, D. Agroclimatological Information, Crop Requirements and Agricultural Zones for Botswana. Land Utilization Division, Ministry of Agriculture, Gaborone. In The Kalahari Environment; Thomas, D.G., Shaw, P.A., Eds.; Cambridge University Press: Cambridge, UK, 1981. [Google Scholar]
- Gebremeskel, K.; Pieterse, P.J. Impact of grazing around a watering point on soil status of a semi-arid rangeland in Ethiopia. Afr. J. Ecol. 2007, 45, 72–79. [Google Scholar] [CrossRef]
- Acocks, J.P.H. Veld Types of South Africa, 3rd ed.; Botanical Research Institute: Pretoria, South Africa, 1988. [Google Scholar]
- Richter, C.G.F.; Snyman, H.A.; Smit, G.N. The influence of tree density on the grass layer of three semi-arid savanna types of southern Africa. Afr. J. Range Forage Sci. 2001, 18, 103–109. [Google Scholar] [CrossRef]
- Van den Berg, L. The Evaluation and Promotion of Best Practices for the Restoration of Arid-and Semi-Arid Rangelands in Southern Africa; North-West University: Potchefstroom, South Africa, 2007. [Google Scholar]
- Smit, G.N.; Rethman, N.F.G.; Moore, A. Vegetative growth, reproduction, browse production and response to tree clearing of woody plants in African savanna. Afr. J. Range Forage Sci. 1996, 13, 78–88. [Google Scholar] [CrossRef]
- Berkeley, A.; Thomas, A.D.; Dougill, A.J. Cyanobacterial soil crusts and woody shrub canopies in Kalahari rangelands. Afr. J. Ecol. 2005, 43, 137–145. [Google Scholar] [CrossRef]
- Tews, J.; Schurr, F.; Jeltsch, F. Seed dispersal by cattle may cause shrub encroachment of Grewia flava on southern Kalahari rangelands. Appl. Veg. Sci. 2004, 7, 89–102. [Google Scholar] [CrossRef]
- Engelbrecht, C.J.; Engelbrecht, F.A. Shifts in Köppen-Geiger climate zones over southern Africa in relation to key global temperature goals. Theor. Appl. Climatol. 2016, 123, 247–261. [Google Scholar] [CrossRef]
- Pansu, M.; Gautheyrou, J. Handbook of Soil Analysis; Springer: Heidelberg, Germany, 2006. [Google Scholar]
- Bray, R.H.; Kurtz, L.T. Determination of total, organic, and available forms of phosphorus in soils. Soil Sci. 1945, 59, 39–46. [Google Scholar] [CrossRef]
- AASHTO T 267; Standard Method of Test for Determination of Organic Content in Soils by Loss of Ignition. American Association of State Highway and Transportation Officials: Washington, DC, USA, 2013.
- TIBCO Software Inc. TIBCO Software Inc., Palo Alto, CA, USA, 2020. Available online: https://www.tibco.com/ (accessed on 11 July 2022).
- Ter Braak, C.J.F.; Smilauer, P. CANOCO Reference Manual and CanoDraw for Windows User’s Guide: Software for Canonical Community Ordination (Version 4.5); Biometris: Wageningen University & Research: Wageningen, The Netherlands, 2002. [Google Scholar]
- Dougill, A.J.; Heathwaite, A.L.; Thomas, D.S. Soil water movement and nutrient cycling in semi-arid rangeland: Vegetation change and system resilience. Hydrol. Process. 1998, 12, 443–459. [Google Scholar] [CrossRef]
- Wang, L.; D’odorico, P.; Ringrose, S.; Coetzee, S.; Macko, S. Biogeochemistry of Kalahari sands. J. Arid Environ. 2007, 71, 259–279. [Google Scholar] [CrossRef]
- Maestre, F.T.; Cortina, J. Insights into ecosystem composition and function in a sequence of degraded semiarid steppes. Restor. Ecol. 2004, 12, 494–502. [Google Scholar] [CrossRef]
- Breshears, D.D.; Whicker, J.J.; Zou, C.B.; Field, J.P.; Allen, C.D. A conceptual framework for dryland aeolian sediment transport along the grassland–forest continuum: Effects of woody plant canopy cover and disturbance. Geomorphology 2009, 105, 28–38. [Google Scholar] [CrossRef]
- Daryanto, S.; Eldridge, D.J.; Throop, H.L. Managing semi-arid woodlands for carbon storage: Grazing and shrub effects on above-and belowground carbon. Agric. Ecosyst. Env. 2013, 169, 1–11. [Google Scholar] [CrossRef]
- Eldridge, D.J.; Soliveres, S. Are shrubs really a sign of declining ecosystem function? Disentangling the myths and truths of woody encroachment in Australia. Aust. J. Bot. 2015, 62, 594–608. [Google Scholar] [CrossRef]
- Daryanto, S.; Eldridge, D.J. Plant and soil surface responses to a combination of shrub removal and grazing in a shrub-encroached woodland. J. Environ. Manag. 2010, 91, 2639–2648. [Google Scholar] [CrossRef]
- Mager, D.M. Carbohydrates in cyanobacterial soil crusts as a source of carbon in the southwest Kalahari, Botswana. Soil Biol. Biochem. 2010, 42, 313–318. [Google Scholar] [CrossRef]
- Thomas, A.D.; Hoon, S.R. Carbon dioxide fluxes from biologically-crusted Kalahari Sands after simulated wetting. J. Arid. Environ. 2010, 74, 131–139. [Google Scholar] [CrossRef] [Green Version]
- Elliot, D.; Lliott, D.; Thomas, A.; Hoon, S.; Sen, R. Niche partitioning of bacterial communities in biological crusts and soils under grasses, shrubs and trees in the Kalahari. Biodivers. Conserv. 2014, 23, 1709–1733. [Google Scholar] [CrossRef] [Green Version]
- Owens, M.K.; Lyons, R.K.; Alejandro, C.L. Rainfall partitioning within semiarid juniper communities: Effects of event size and canopy cover. Hydrol. Process. 2006, 20, 3179–3189. [Google Scholar] [CrossRef]
- Breshears, D.D.; Barnes, F.J. Interrelationships between plant functional types and soil moisture heterogeneity for semiarid landscapes within the grassland/forest continuum: A unified conceptual model. Landsc. Ecol. 1999, 14, 465–478. [Google Scholar] [CrossRef]
- Dean, W.; Milton, S.; Jeltsch, F. Large trees, fertile islands, and birds in arid savanna. J. Arid Environ. 1999, 41, 61–78. [Google Scholar] [CrossRef]
- Breshears, D.D. The grassland–forest continuum: Trends in ecosystem properties for woody plant mosaics? Front. Ecol. Environ. 2006, 4, 96–104. [Google Scholar] [CrossRef]
- Eldridge, D.J.; Beecham, G.; Grace, J.B. Do shrubs reduce the adverse effects of grazing on soil properties? Ecohydrology 2015, 8, 1503–1513. [Google Scholar] [CrossRef]
- Dougill, A.J.; Thomas, A.D. Kalahari sand soils: Spatial heterogeneity, biological soil crusts and land degradation. Land Degrad. Dev. 2004, 15, 233–242. [Google Scholar] [CrossRef]
- Neff, J.C.; Reynolds, R.L.; Belnap, J.; Lamothe, P. Multi-decadal impacts of grazing on soil physical and biogeochemical properties in southeast Utah. Ecol. Appl. 2005, 15, 87–95. [Google Scholar] [CrossRef] [Green Version]
- Hermans, C.; Vuylsteke, M.; Coppens, F.; Craciun, A.; Inzé, D.; Verbruggen, N. Early transcrinter-patchtomic changes induced by magnesium deficiency in Arabidopsis thaliana reveal the alteration of circadian clock gene expression in roots and the triggering of abscisic acid-responsive genes. New Phytol. 2010, 187, 119–131. [Google Scholar] [CrossRef] [PubMed]
- Guo, W.; Nazim, H.; Liang, Z.; Yang, D. Magnesium deficiency in plants: An urgent problem. Crop J. 2016, 4, 83–91. [Google Scholar] [CrossRef] [Green Version]
- Gransee, A.; Führs, H. Magnesium mobility in soils as a challenge for soil and plant analysis, magnesium fertilization and root uptake under adverse growth conditions. Plant Soil 2013, 368, 5–21. [Google Scholar] [CrossRef] [Green Version]
- Sela, G. Calcium in Plants and Soil Management of Nutrients. Available online: http://www.smart-fertilizer.com/articles/calcium-in-plants (accessed on 16 January 2017).
- Liu, C.-H.; Chao, Y.-Y.; Kao, C.H. Effect of potassium deficiency on antioxidant status and cadmium toxicity in rice seedlings. Bot. Stud. 2013, 54, 2. [Google Scholar] [CrossRef] [PubMed] [Green Version]
- Brady, N.C.; Weil, R.R. The Nature and Properties of Soils; Prentice Hall: Upper Saddle River, NJ, USA, 1999. [Google Scholar]
- Pardo, J.M.; Quintero, F.J. Plants and sodium ions: Keeping company with the enemy. Genome Biol. 2002, 3, 1–4. [Google Scholar] [CrossRef] [PubMed]
- Jones, J. Plant Nutrition and Soil Fertility Manual, 2nd ed.; CRC Press: Boca Raton, FL, USA, 2012. [Google Scholar]
- Tongway, D.; Hindley, N. Landscape function analysis: A system for monitoring rangeland function. Afr. J. Range Forage Sci. 2004, 21, 109–113. [Google Scholar] [CrossRef]


| Treatment | LOI | Stability | Infiltration | Nutrient Cycling | ||||
|---|---|---|---|---|---|---|---|---|
| 2015 | 2016 | 2015 | 2016 | 2015 | 2016 | 2015 | 2016 | |
| Aeroplane | 0.21 | 0.32 | 43.00 | 42.50 | 34.50 | 36.50 | 13.00 | 14.00 |
| Stem burning | 0.51 | 0.32 | 43.00 | 41.00 | 35.00 | 37.00 | 14.00 | 14.00 |
| Hand control | 0.26 | 0.13 | 45.33 | 43.00 | 36.00 | 36.67 | 14.67 | 15.00 |
| Bush thickened | 0.31 | 0.31 | 44.25 | 44.75 | 35.75 | 36.75 | 14.00 | 15.50 |
| Sustainably managed | 0.28 | 0.29 | 44.00 | 44.00 | 35.00 | 36.00 | 14.00 | 14.00 |
| Treatments | Patch Type | Ca | Mg | K | Na | P | pH (KCl) | C (%) |
|---|---|---|---|---|---|---|---|---|
| (mg/kg) | ||||||||
| Aeroplane-controlled | IP | 209.0 | 60.0 | 82.1 | 3.0 | 8.7 | 5.3 | 0.3 |
| GLP | 256.8 | 96.6 | 111.1 | 5.4 | 10.3 | 5.6 | 0.4 | |
| GP | 299.9 | 40.4 | 98.3 | 2.1 | 7.7 | 5.3 | 0.4 | |
| Hand controlled | IP | 124.0 | 65 | 48.5 | 0.5 | 8 | 4.8 | 0.3 |
| GLP | 148.3 | 81.5 | 64.7 | 0.8 | 7.8 | 5.2 | 0.3 | |
| Hand controlled with re-application | IP | 147 | 82.7 | 66.8 | 6.3 | 7.5 | 4.8 | 0.3 |
| GLP | 190.5 | 91.3 | 64.2 | 2.2 | 8.9 | 5.1 | 0.3 | |
| Sustainably managed | IP | 119 | 47.7 | 52.2 | 2.8 | 10.9 | 4.5 | 0.3 |
| GLP | 113.4 | 49.1 | 57.3 | 1.8 | 10.2 | 4.5 | 0.3 | |
| Stem burning | IP | 114 | 21 | 40.8 | 1.2 | 9.5 | 4.5 | 0.3 |
| Bush encroached | IP | 167.8 | 47.4 | 48.4 | 4.7 | 9.3 | 5 | 0.3 |
| GLP | 108.0 | 69.2 | 37.7 | 1.2 | 8.4 | 4.8 | 0.3 | |
| SLP | 350.7 | 53.0 | 78.9 | 2.2 | 9.6 | 5.6 | 0.5 | |
Publisher’s Note: MDPI stays neutral with regard to jurisdictional claims in published maps and institutional affiliations. |
© 2022 by the authors. Licensee MDPI, Basel, Switzerland. This article is an open access article distributed under the terms and conditions of the Creative Commons Attribution (CC BY) license (https://creativecommons.org/licenses/by/4.0/).
Share and Cite
Kellner, K.; Fouché, J.; Tongway, D.; Boneschans, R.; van Coller, H.; van Staden, N. Landscape Function Analysis: Responses to Bush Encroachment in a Semi-Arid Savanna in the Molopo Region, South Africa. Sustainability 2022, 14, 8616. https://doi.org/10.3390/su14148616
Kellner K, Fouché J, Tongway D, Boneschans R, van Coller H, van Staden N. Landscape Function Analysis: Responses to Bush Encroachment in a Semi-Arid Savanna in the Molopo Region, South Africa. Sustainability. 2022; 14(14):8616. https://doi.org/10.3390/su14148616
Chicago/Turabian StyleKellner, Klaus, Jaco Fouché, David Tongway, Ricart Boneschans, Helga van Coller, and Nanette van Staden. 2022. "Landscape Function Analysis: Responses to Bush Encroachment in a Semi-Arid Savanna in the Molopo Region, South Africa" Sustainability 14, no. 14: 8616. https://doi.org/10.3390/su14148616