Species Monitoring Using Unmanned Aerial Vehicle to Reveal the Ecological Role of Plateau Pika in Maintaining Vegetation Diversity on the Northeastern Qinghai-Tibetan Plateau

 ,
,
Abstract
:
1. Introduction
2. Materials and Methods
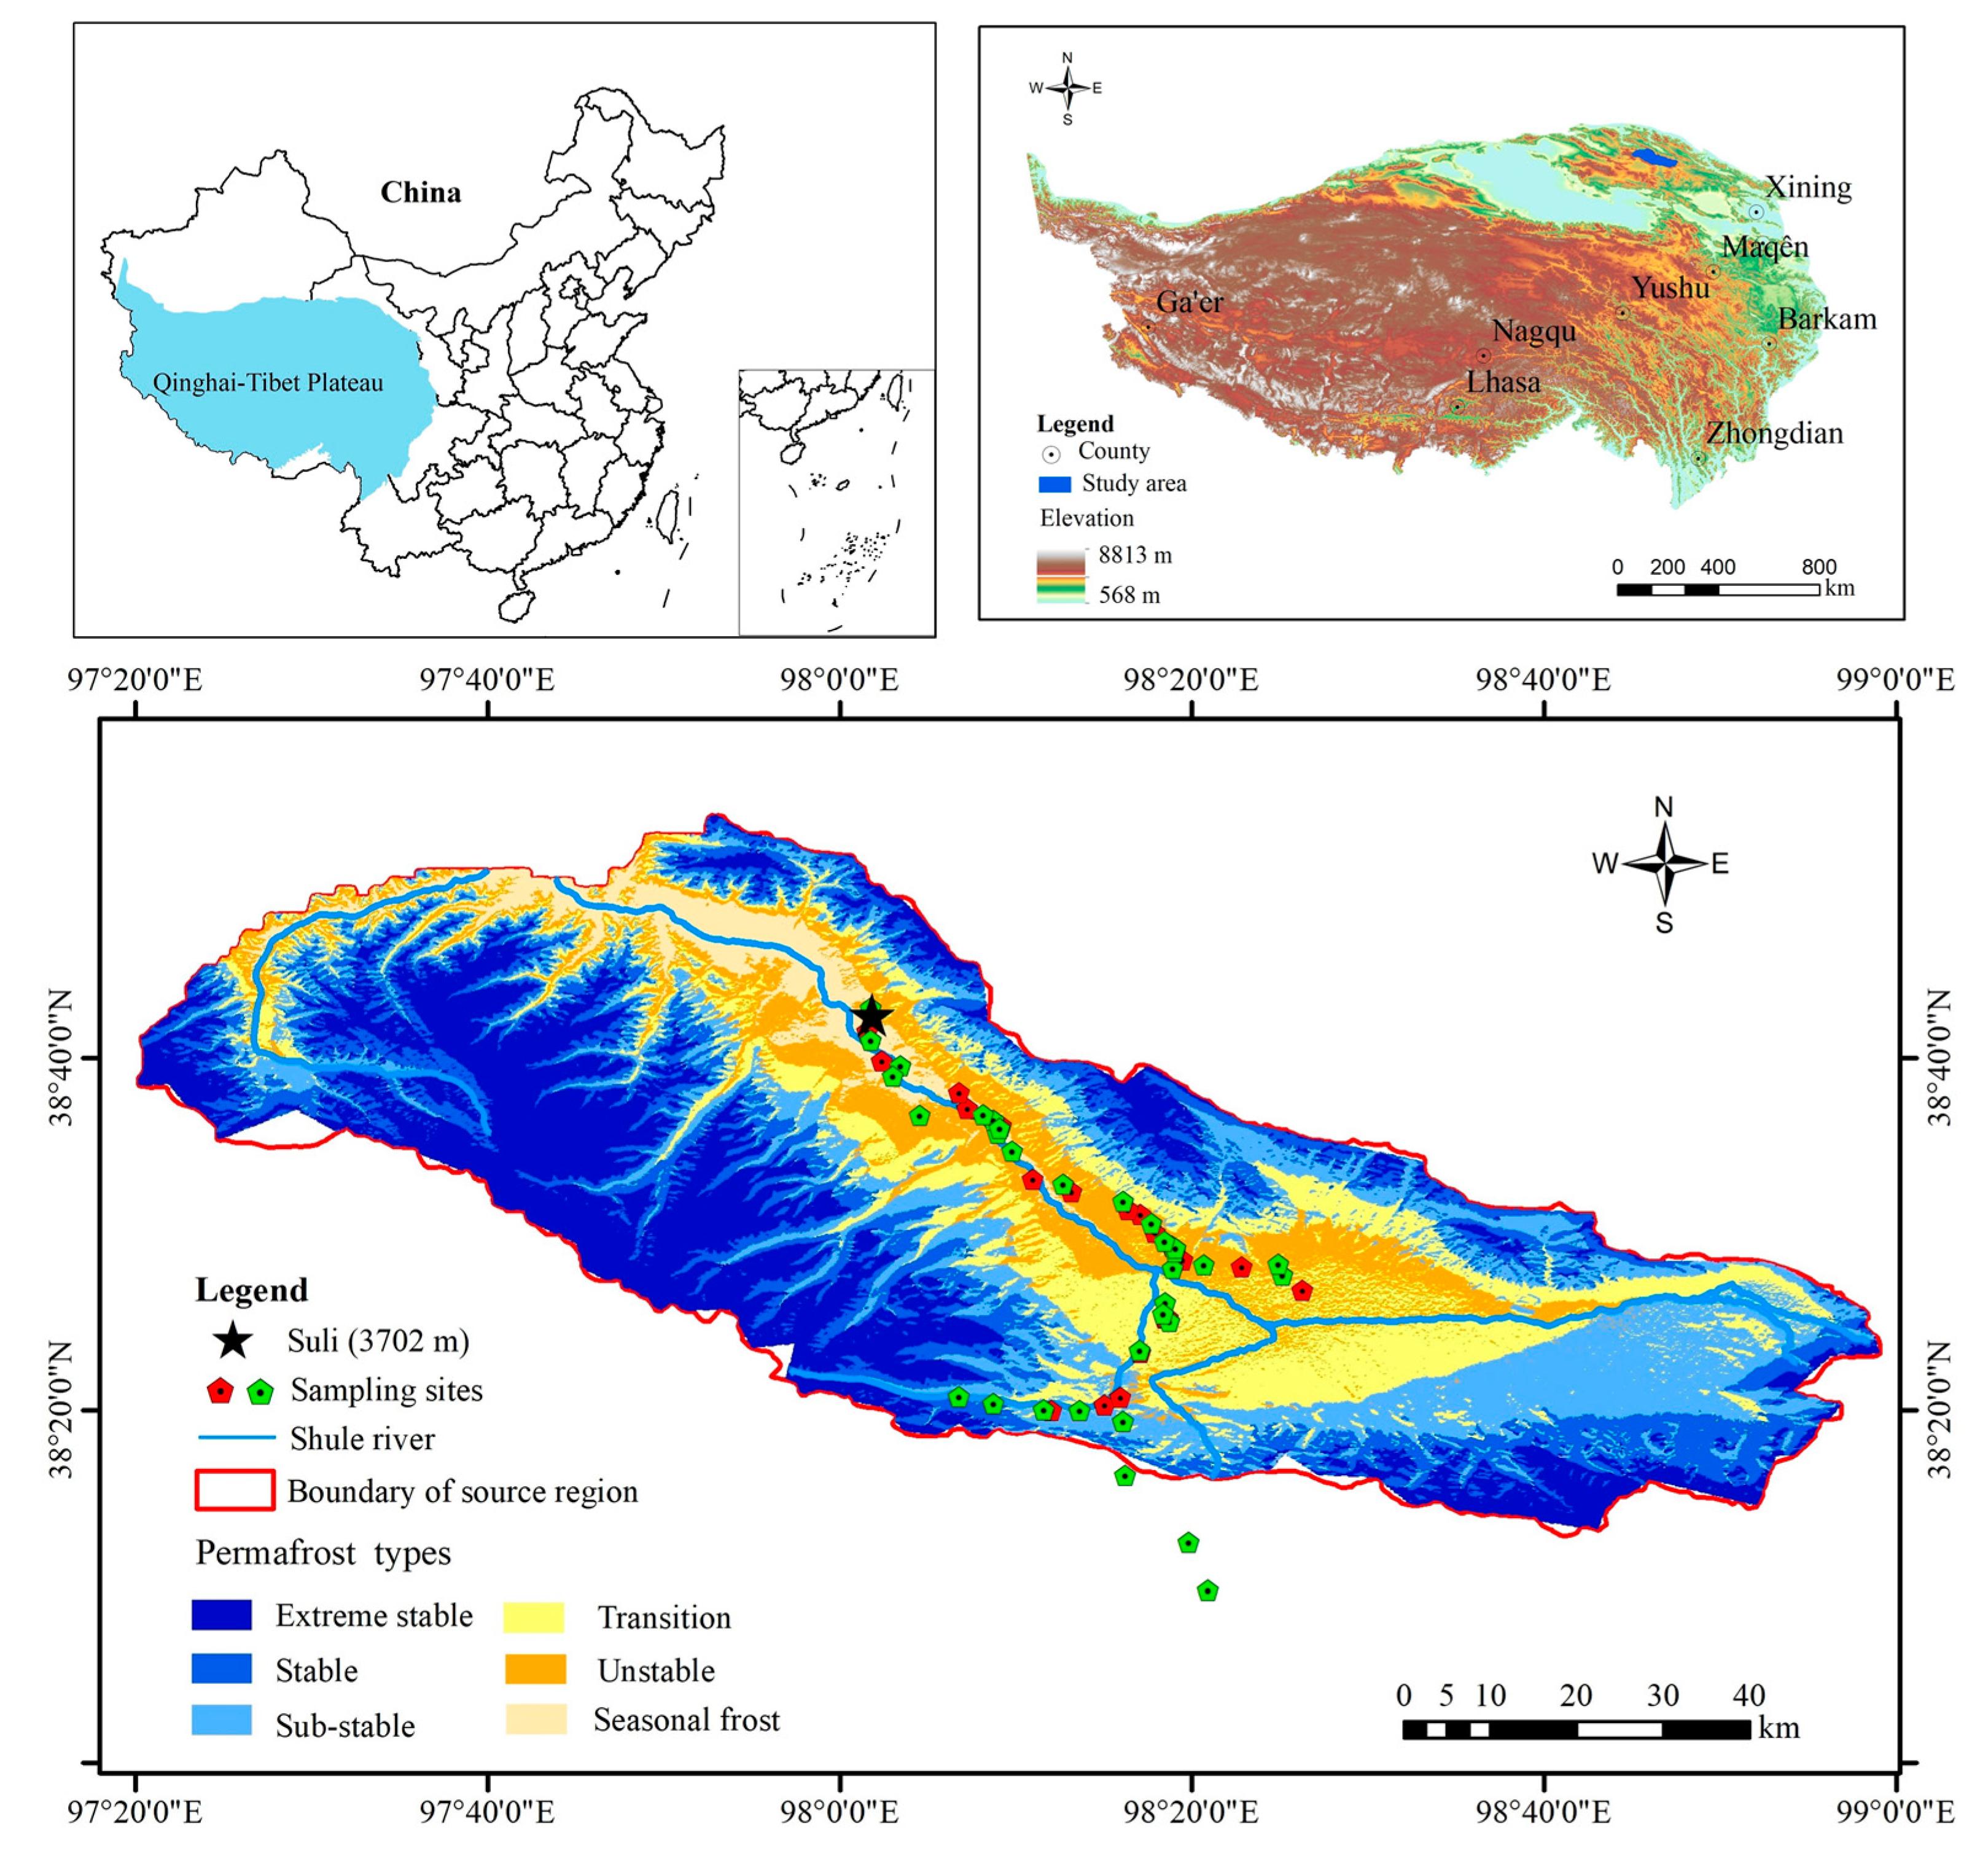
2.1. Study Area
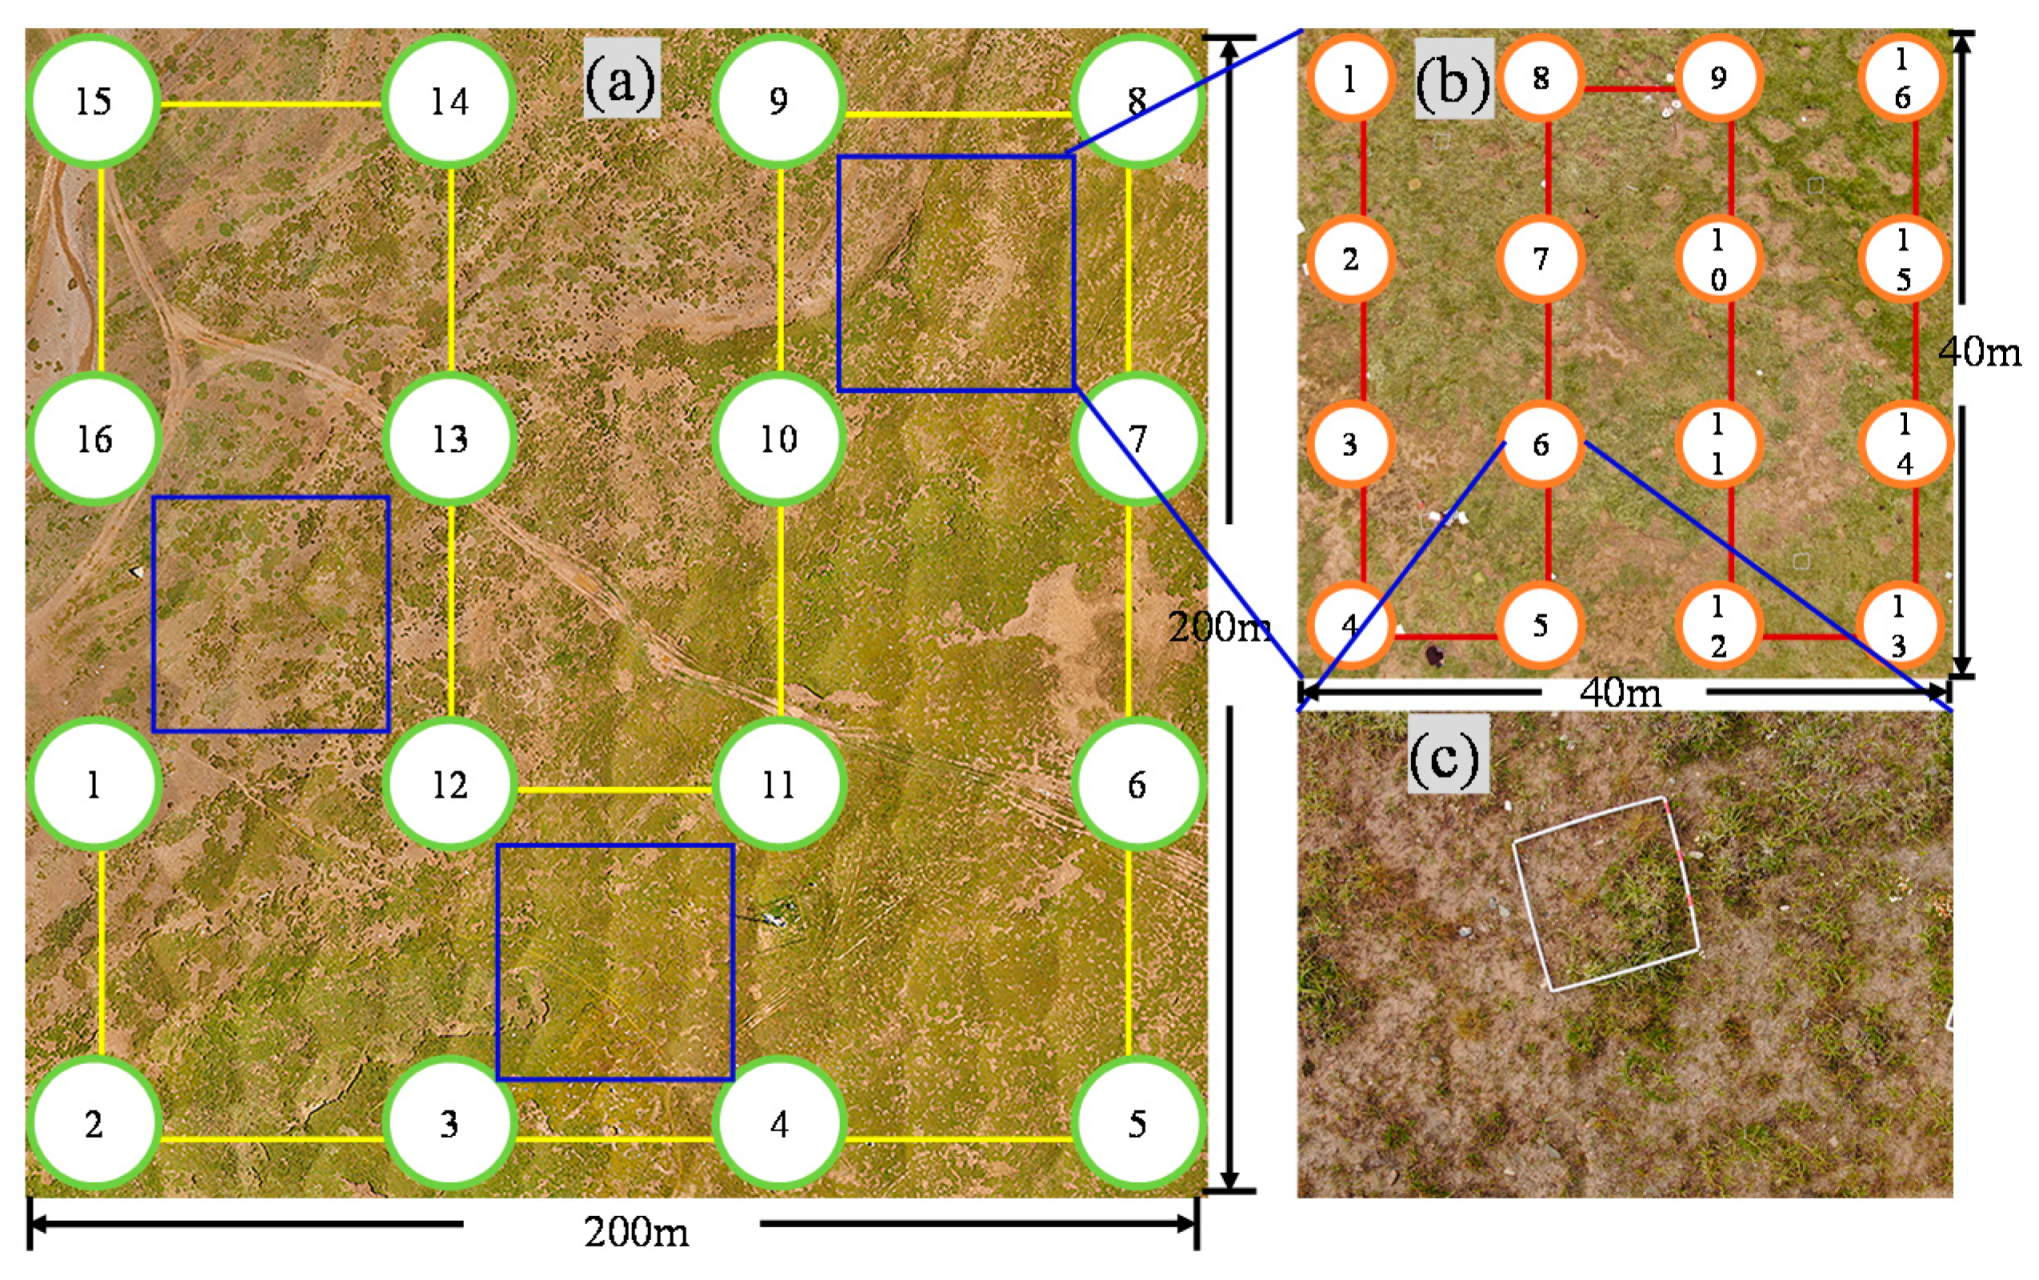
2.2. Study Scheme
2.2.1. UAV and Aerial Photographing
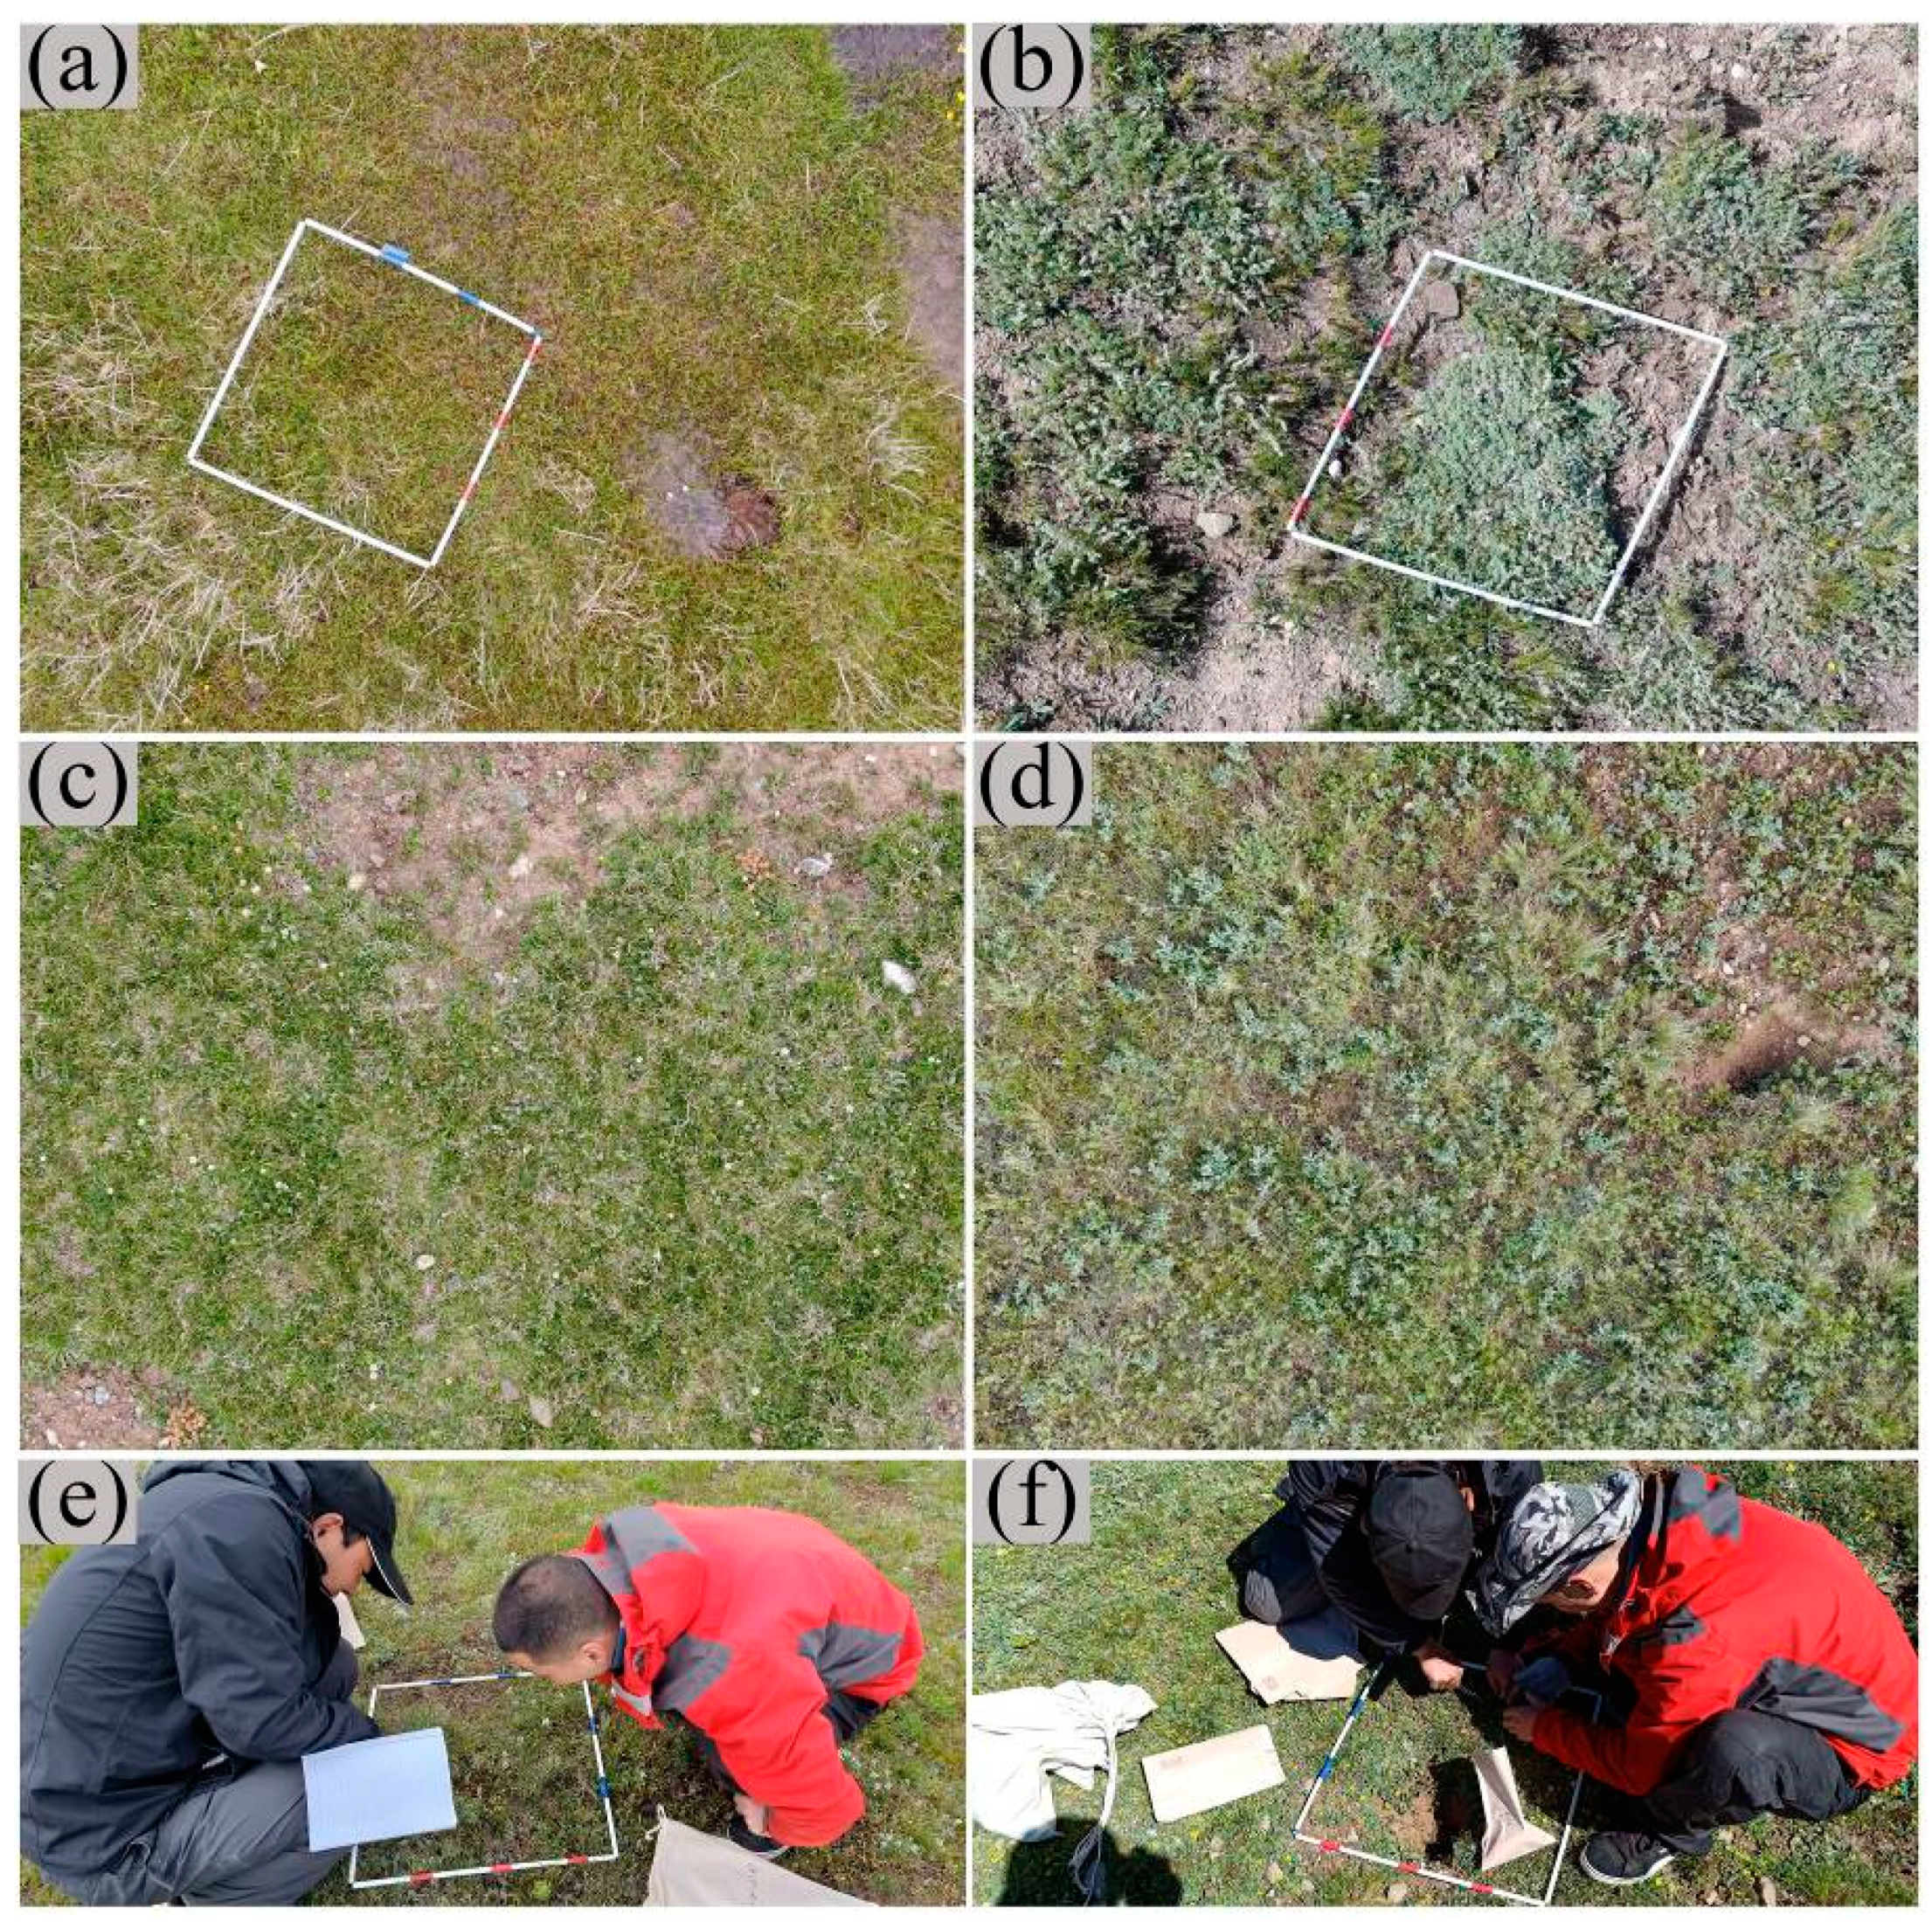
2.2.2. Synchronous Survey of UAV and Ground Measurement
2.2.3. Aerial Image Preprocessing
2.2.4. Pika Density at Plot Scale
2.2.5. Calculation of Vegetation Species Diversity Indexes
2.3. Data Statistics Analysis
3. Results
3.1. Monitoring Vegetation Species Composition and Pika Density at Plot Scale
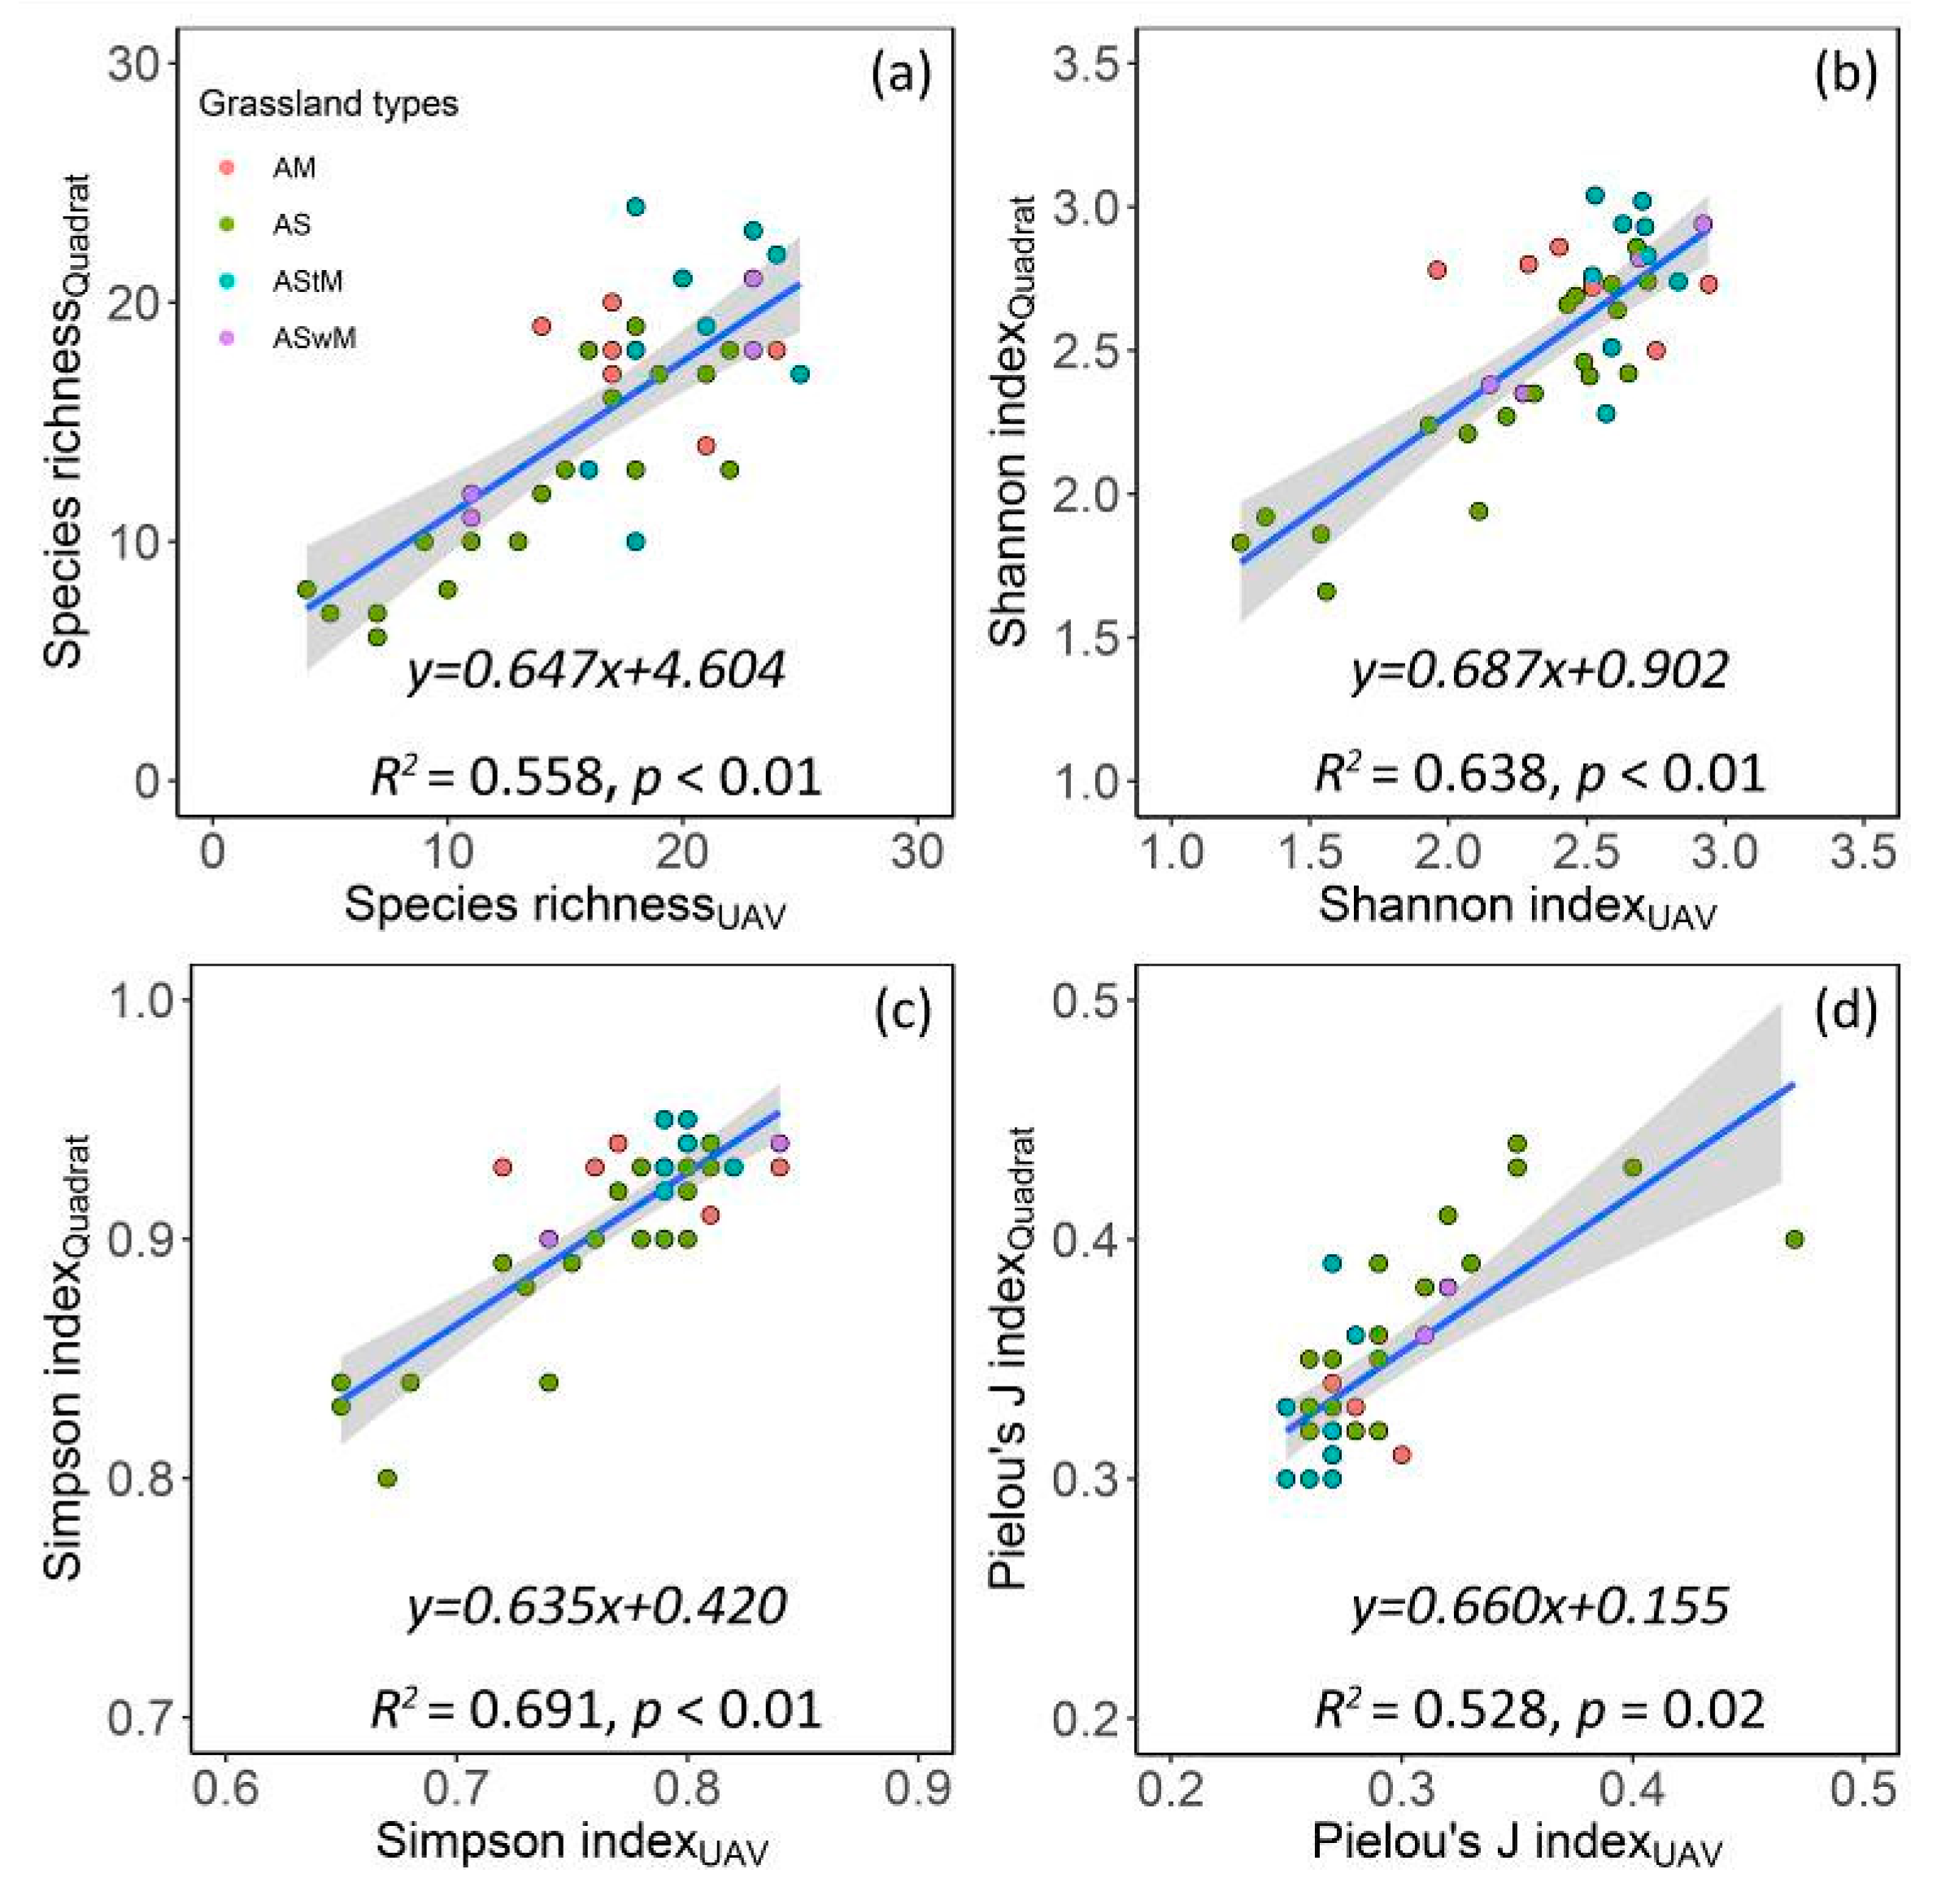
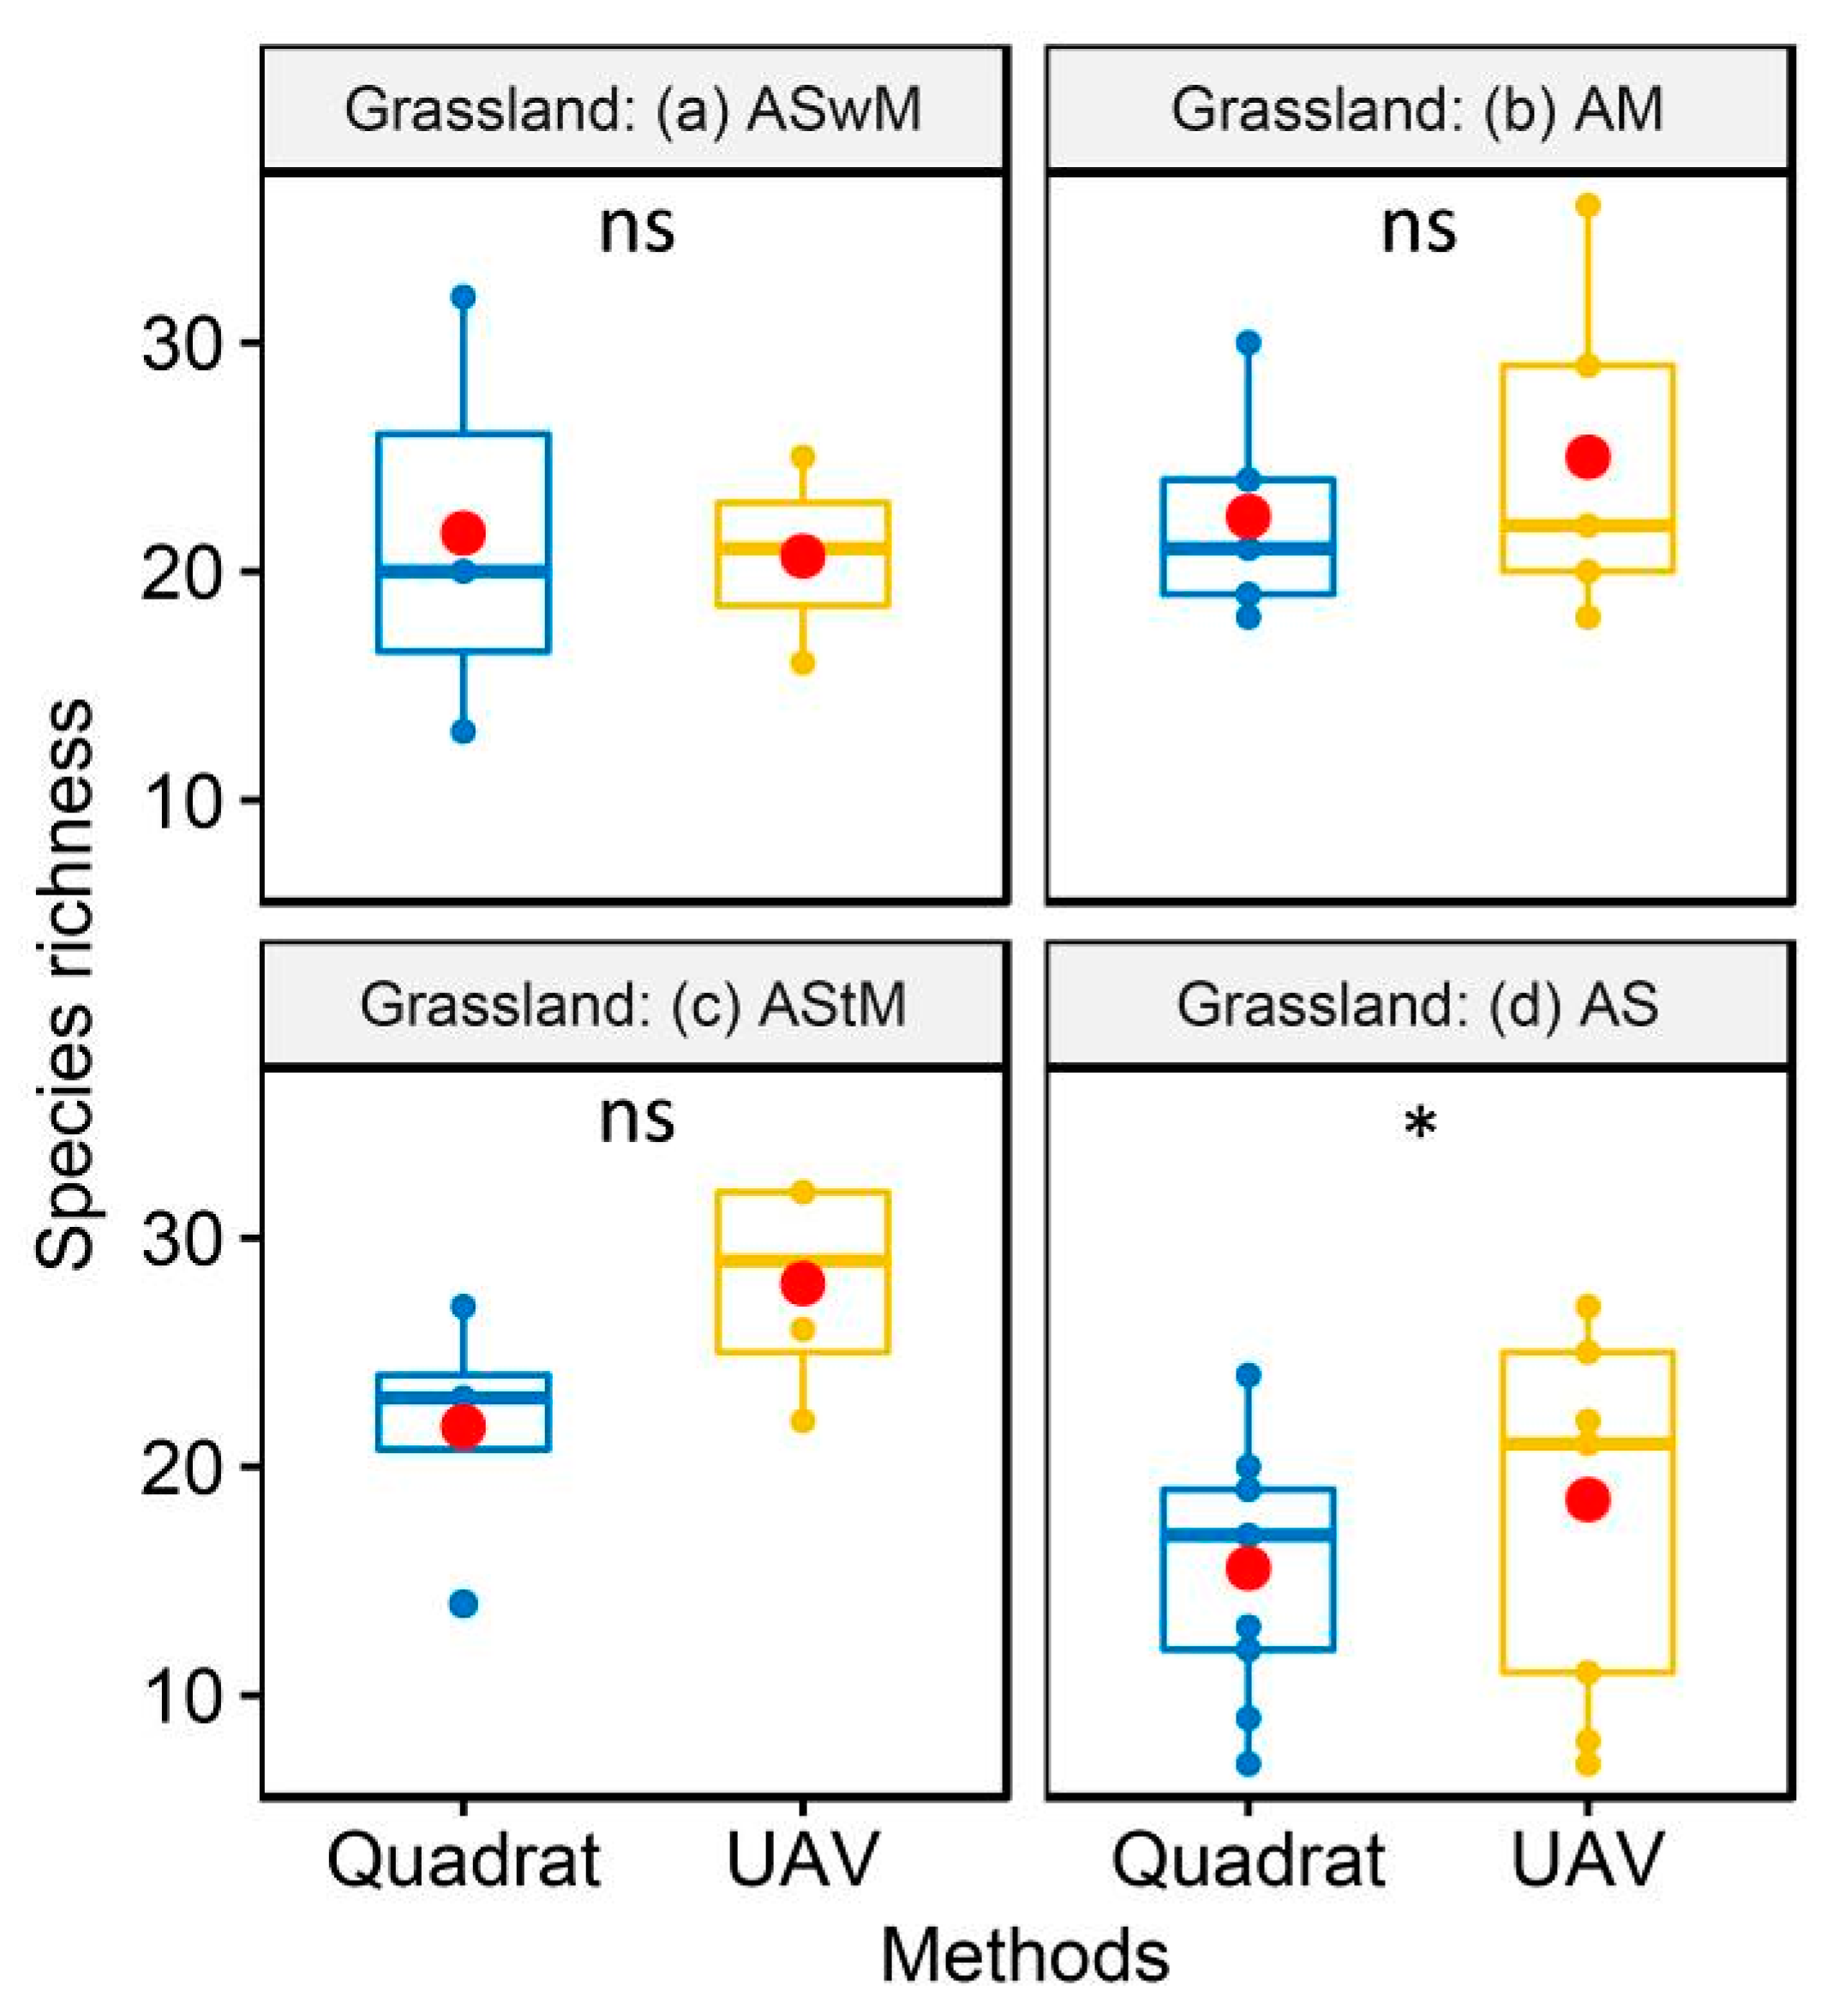
3.1.1. Accuracy of Vegetation Species Composition Monitoring based on UAV
3.1.2. Vegetation Species Composition at Plot Scale
3.1.3. Pika Burrows and Density at Plot Scale
3.2. Fractional Vegetation Cover, Bare Patch Area Fraction and Biomass of Functional Groups
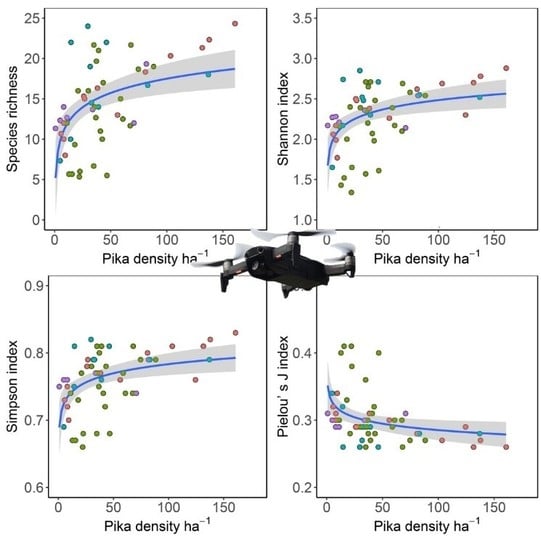
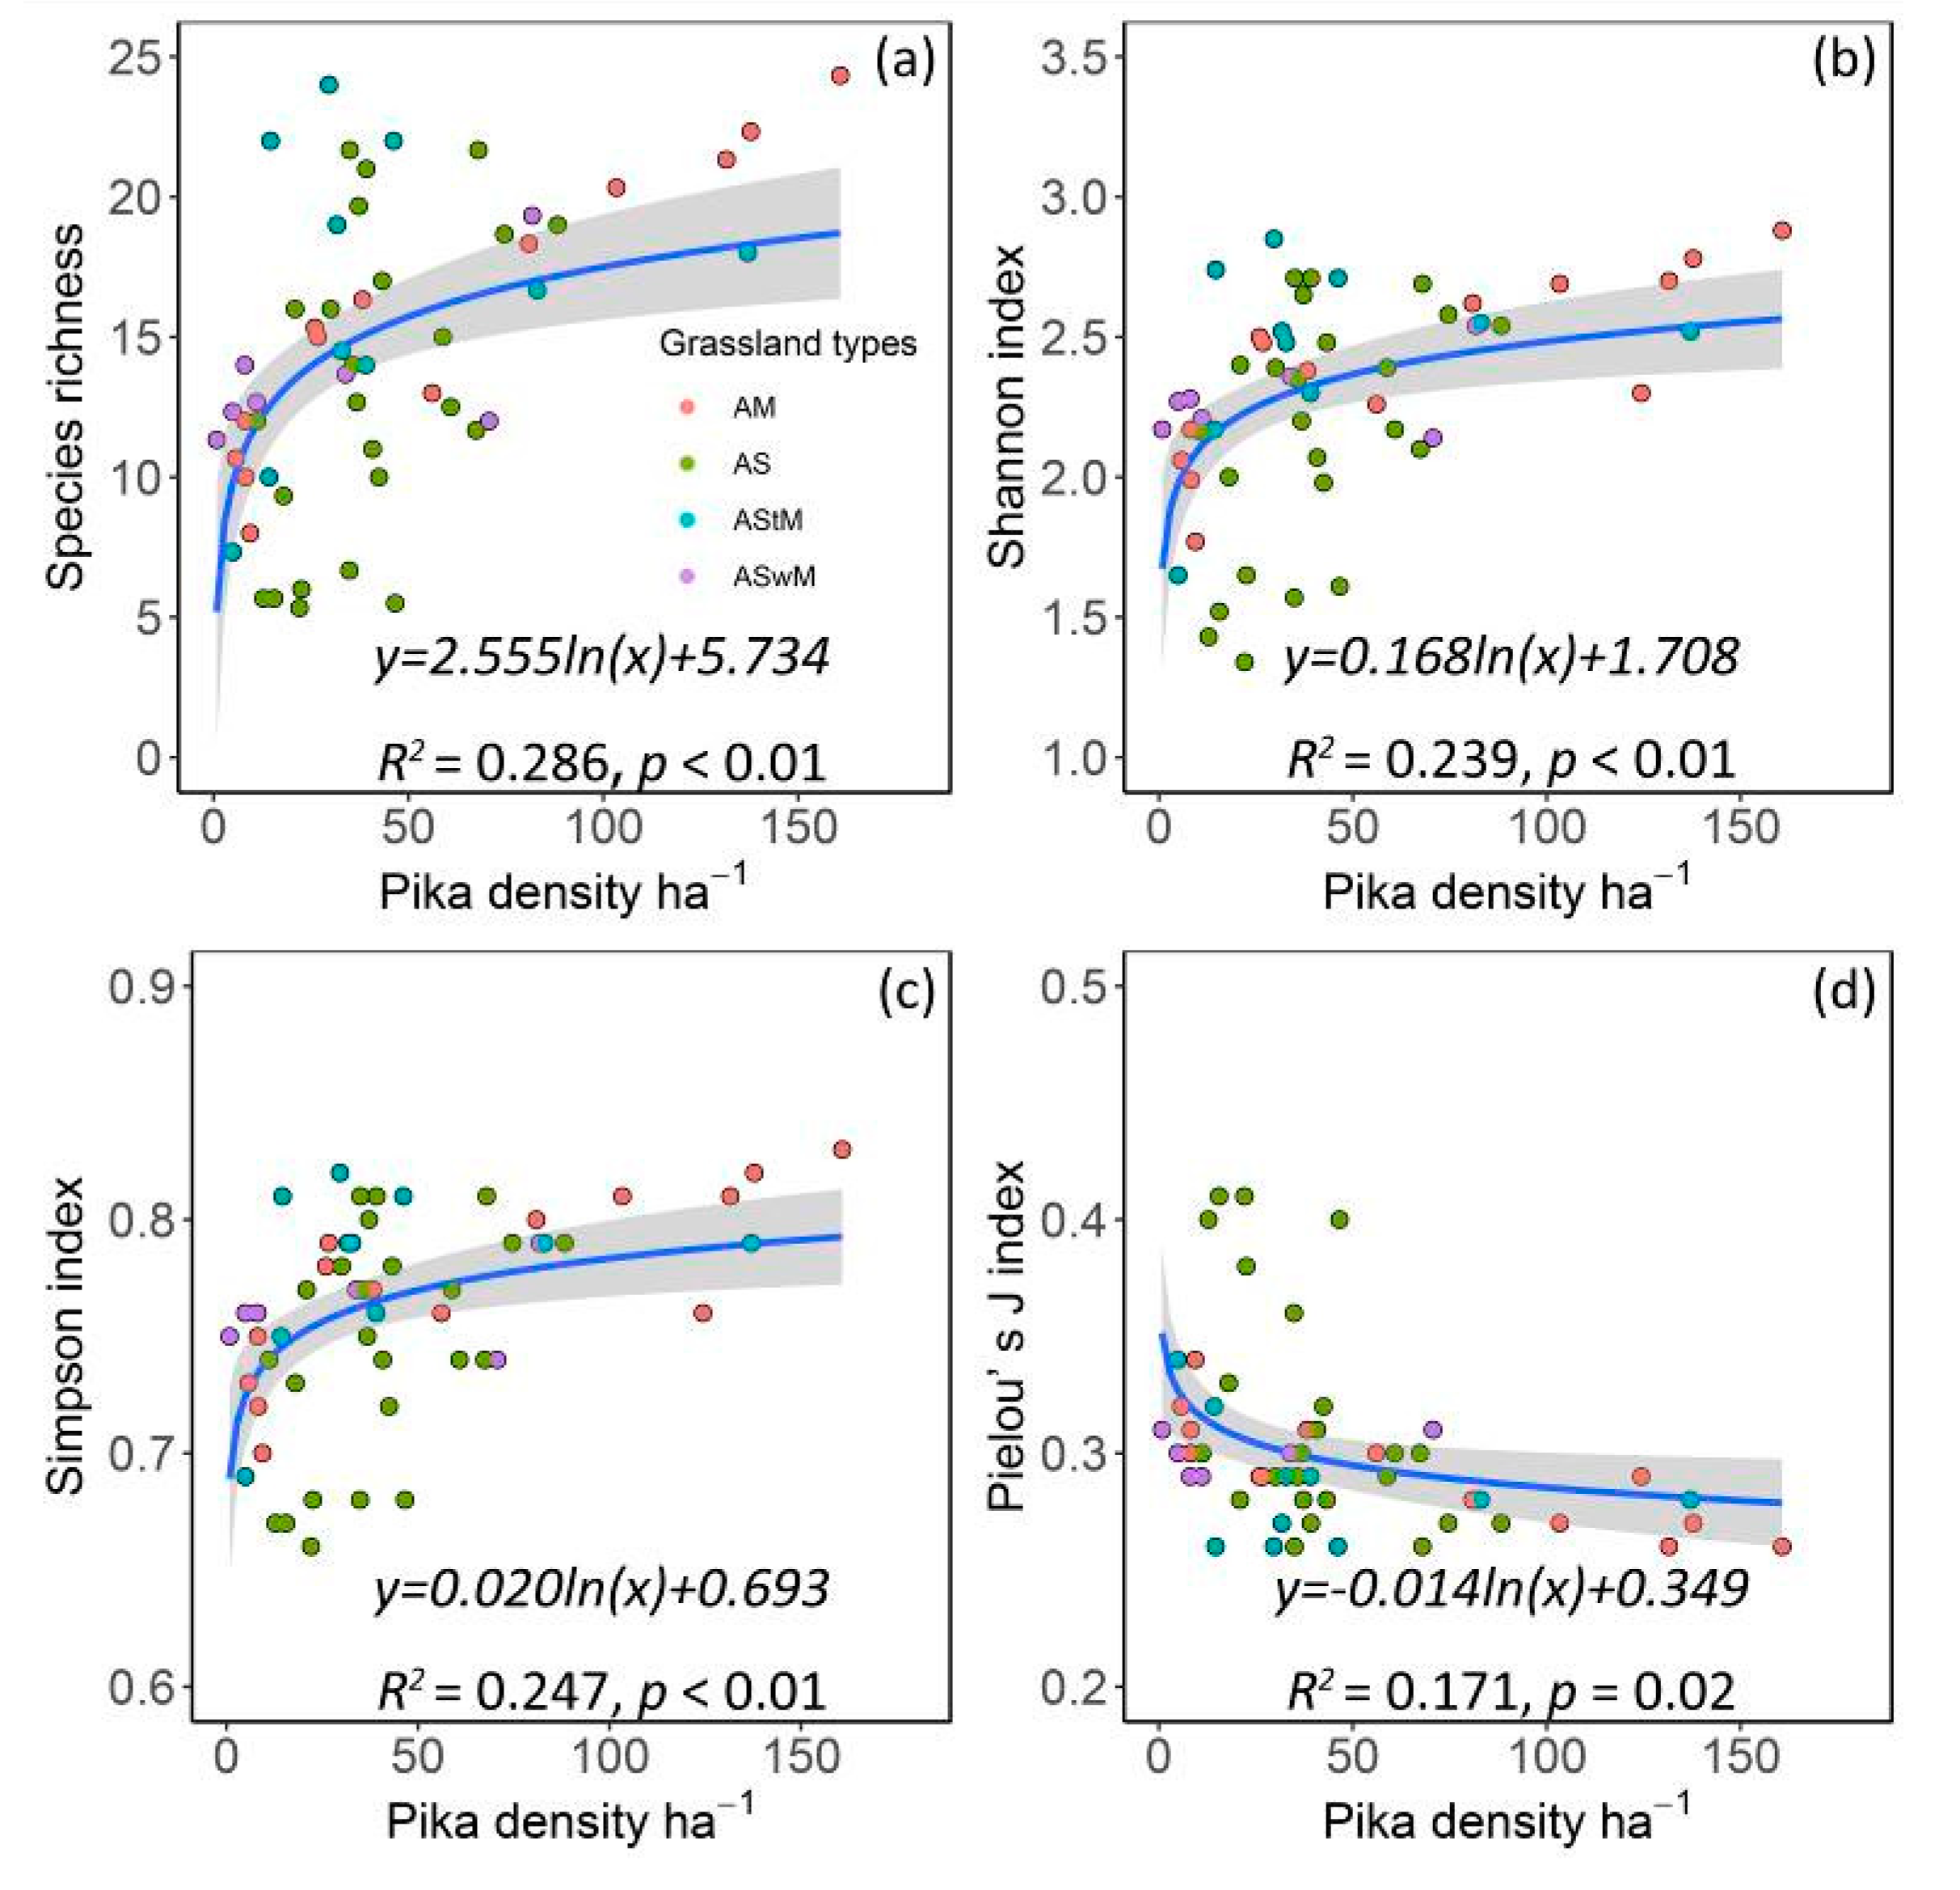
3.3. Relationships between Pika Density and Vegetation Diversity Indexes
4. Discussion
4.1. Monitoring Vegetation Species Composition at Plot Scale
4.2. Effects of Pika’s Disturbance on Vegetation Species Diversity
4.3. Limitation of the Current Monitoring Method by the UAV and Future Work
5. Conclusions
Author Contributions
Funding
Acknowledgments
Conflicts of Interest
Appendix A

| Functional Forms | Species | Quadrat | UAV | ||||||
|---|---|---|---|---|---|---|---|---|---|
| ASwM | AM | AStM | AS | ASwM | AM | AStM | AS | ||
| Grass | Poa pratensis | + | + | + | + | + | + | + | + |
| Koeleria cristata | + | + | + | + | + | + | |||
| Stipa purpurea | + | + | + | + | + | + | |||
| Elymus nutans | + | + | + | + | + | ||||
| Elymus sibiricus | + | + | + | + | + | ||||
| Roegneria thoroldiana | + | + | + | ||||||
| Leymus secalinus | + | + | |||||||
| Legume | Oxytropis ochrocephala | + | + | + | + | + | + | + | + |
| Hedysarum multijugum | + | + | + | + | + | + | + | + | |
| hermopsis przewalskii | + | + | + | + | |||||
| Oxytropis falcata †† | + | + | + | ||||||
| Sedge | Kobresia pygmaea | + | + | + | + | + | + | ||
| Kobresia robusta | + | + | + | + | + | ||||
| Kobresia tibetica | + | + | + | + | |||||
| Kobresia humilis | + | + | + | + | |||||
| Carex atrofuscoides | + | + | + | + | |||||
| Carex orbicularis | + | + | + | + | |||||
| Carex moorcroftii | + | + | |||||||
| Kobresia capillifolia | + | + | |||||||
| Forb | Aster tataricus | + | + | + | + | + | + | ||
| Leontopodium leontopodioides | + | + | + | + | + | + | + | + | |
| Veronica didyma | + | + | + | + | + | + | + | + | |
| Microula tibetica | + | + | + | + | + | + | + | + | |
| Potentilla bifurca | + | + | + | + | + | + | + | + | |
| Chenopodium album | + | + | + | + | + | + | + | ||
| Polygonum sibiricum | + | + | + | + | + | + | |||
| Androsace gmelinii | + | + | + | + | + | ||||
| Ajania pallasiana | + | + | + | + | + | + | |||
| Saussurea arenaria | + | + | + | + | + | + | |||
| Euphorbia micractina | + | + | + | + | + | + | |||
| Taraxacum mongolicum | + | + | + | + | + | + | |||
| Corydalis multisecta | + | + | + | + | + | + | |||
| Lagotis brachystachya | + | + | + | + | + | ||||
| Pomatosace filicula | + | + | + | + | + | ||||
| Heteropappus hispidus | + | + | + | + | + | ||||
| Sibbaldia procumbens † | + | + | + | + | |||||
| Ranunculus longicaulis | + | + | + | + | |||||
| Parnassia trinervis | + | + | + | + | |||||
| Dracocephalum heterophyllum | + | + | + | + | |||||
| Thalictrum alpinum | + | + | + | + | |||||
| Pleurospermum hookeri | + | + | + | + | |||||
| Senecio scandens | + | + | + | + | |||||
| Pedicularis Linn | + | + | + | + | |||||
| Lancea tibetica | + | + | + | + | |||||
| Potentilla multiceps | + | + | + | + | |||||
| Saussurea stella | + | + | + | ||||||
| Glaux maritima | + | + | + | ||||||
| Arenaria kansuensis | + | + | + | ||||||
| Androsace tapete | + | + | + | ||||||
| Gentiana leucomelaena | + | + | + | ||||||
| Polygonum capitatum | + | + | + | ||||||
| Bupleuri Radix | + | + | + | ||||||
| Gentiana squarrosa † | + | + | + | ||||||
| Aconitum pendulum | + | + | + | ||||||
| Iris tectorum †† | + | + | + | ||||||
| Primula nutans | + | + | |||||||
| Batrachium bungei | + | + | |||||||
| Potentilla acaulis † | + | + | |||||||
| Potentilla anserina | + | + | |||||||
| Saussurea japonica | + | + | |||||||
| Lepidium apetalum | + | + | |||||||
| Przewalskia tangutica †† | + | + | |||||||
| Saussurea superba | + | + | |||||||
| Lepidium apetalum | + | + | |||||||
| Ephedra monosperma | + | + | |||||||
| Ranunculaceae †† | + | ||||||||
| Pedicularis verticillata †† | + | ||||||||
| Allium carolinianum †† | + | ||||||||
| Gentiana siphonantha †† | + | ||||||||
| Comastoma pulmonarium †† | + | ||||||||
| Gentiana algida †† | + | ||||||||
| Rheum spiciforme †† | + | ||||||||
| Draba nemorosa †† | + | ||||||||
| Shrub | Potentilla fruticosa | + | + | + | + | ||||
| Total species indentified | 33 | 44 | 33 | 29 | 26 | 50 | 39 | 37 | |
| 63 | 71 | ||||||||
| Total species did not indentify | 11 | 3 | |||||||
References
- Miehe, G.; Schleuss, P.; Seeber, E.; Babel, W.; Biermann, T.; Braendle, M.; Chen, F.; Coners, H.; Foken, T.; Gerken, T.; et al. The Kobresia pygmaea ecosystem of the Tibetan highlands-Origin, functioning and degradation of the world’s largest pastoral alpine ecosystem Kobresia pastures of Tibet. Sci. Total. Environ. 2019, 648, 754–771. [Google Scholar] [CrossRef] [PubMed]
- Schaller, G. Wildlife of the Tibetan Steppe; University of Chicago Press: Chicago, IL, USA, 1998. [Google Scholar]
- Whittaker, R.H.; Levin, S.A.; Root, R.B. Niche, Habitat, and Ecotope. Am. Nat. 1973, 107, 321–338. [Google Scholar] [CrossRef]
- Hubbell, S.P. The Unified Neutral Theory of Biodiversity and Biogeography; Princeton University Press: Princeton, NJ, USA, 2001. [Google Scholar]
- Zhang, P.; Kowalchuk, G.; Soons, M.; Hefting, M.; Chu, C.; Firn, J.; Brown, C.; Zhou, X.; Zhou, X.; Guo, Z.; et al. SRUD: A simple non-destructive method for accurate quantification of plant diversity dynamics. J. Ecol. 2019, 107, 2155–2166. [Google Scholar] [CrossRef] [Green Version]
- Wang, G. The coenoniche of plant communities. Pratacul. Sci. 1990, 7, 52–57, (In Chinese with English abstract). [Google Scholar]
- Bai, Y.; Guo, X.; Zhang, R.; Wang, G. Trade-off between resource utilization and coexistence status of roegneria kamoji and polygonum sphaerostachyum of alpine meadow in the south of gansu. Acta Agrestia. Sin. 2009, 17, 298–303, (In Chinese with English abstract). [Google Scholar]
- Yang, Z.; Guo, H.; Zhang, J.; Du, G. Stochastic and deterministic processes together determine alpine meadow plant community composition on the tibetan plateau. Oecologia 2013, 171, 495–504. [Google Scholar] [CrossRef]
- Sellan, G.; Thompson, J.; Majalap, N.; Brearley, F. Soil characteristics influence species composition and forest structure differentially among tree size classes in a Bornean heath forest. Plant Soil 2019, 438, 1–13. [Google Scholar] [CrossRef] [Green Version]
- Aarssen, L.W.; Schamp, B.S.; Pither, J. Why are there so many small plants? Implications for species coexistence. J. Ecol. 2006, 94, 569–580. [Google Scholar] [CrossRef]
- Yang, Z.; Hautier, Y.; Borer, E.; Zhang, C.; Du, G. Abundance- and functional-based mechanisms of plant diversity loss with fertilization in the presence and absence of herbivores. Oecologia 2015, 179, 261–270. [Google Scholar] [CrossRef]
- Wang, L.; Delgadobaquerizo, M.; Wang, D.; Isbell, F.; Liu, J.; Feng, C.; Liu, J.; Zhong, Z.; Zhu, H.; Yuan, X.; et al. Diversifying livestock promotes multidiversity and multifunctionality in managed grasslands. Proc. Natl. Acad. Sci. USA 2019, 116, 6187–6192. [Google Scholar] [CrossRef] [Green Version]
- Cincotta, R.; Zhang, Y.; Zhou, X. Transhuman alpine pastoralism in northeastern Qinghai province: An evaluation of livestock population response during China’s agrarian economic reform. Nomadic Peoples 1992, 30, 3–25. [Google Scholar]
- Lai, C.; Smith, A. Keystone status of plateau pikas (Ochotona curzoniae): Effect of control on biodiversity of native birds. Biodiver. Conserv. 2003, 12, 1901–1912. [Google Scholar] [CrossRef]
- Qin, Y.; Chen, J.; Yi, S. Plateau pikas burrowing activity accelerates ecosystem carbon emission from alpine grassland on the Qinghai-Tibetan Plateau. Ecol. Eng. 2015, 84, 287–291. [Google Scholar] [CrossRef]
- Smith, A.; Foggin, J. The plateau pika (Ochotona curzoniae) is a keystone species for biodiversity on the Tibetan plateau. Anim. Conserv. 1999, 2, 235–240. [Google Scholar] [CrossRef]
- Huntly, N.; Reichman, O. Effect of subterranean mammalian herbivores on vegetation. J. Mammal. 1994, 75, 852–859. [Google Scholar] [CrossRef]
- Liu, W.; Li, L.; Yan, H.; Sun, H.; Zhang, L. Effects of burrowing activity of plateau pika (Ochotona curzoniae) on plant species richness and aboveground biomass. Acta Theriol. Sin. 2012, 32, 216–220, (In Chinese with English abstract). [Google Scholar]
- Ma, Y.; Wu, Y.; Liu, W.; Li, X.; Lin, H. Microclimate response of soil to plateau pika’s disturbance in the northeast qinghai-tibet plateau. Eur. J. Soil. Sci. 2018, 69, 232–244. [Google Scholar] [CrossRef]
- Zhang, Y.; Zhang, Z.; Liu, J. Burrowing rodents as ecosystem engineers: The ecology and management of plateau zokors Myospalax fontanierii in alpine meadow ecosystems on the Tibetan Plateau. Mamm. Rev. 2003, 33, 284–294. [Google Scholar] [CrossRef] [Green Version]
- Shi, H.; Yu, J. Influence of burrowing rodent density plots on the Alpine Kobresia meadows structure and soil water content. Chin. J. Grassl. 2010, 32, 109–112, (In Chinese with English abstract). [Google Scholar]
- Jia, T.; Mao, L.; Guo, Z. Effect of available burrow densities of plateau pika (Ochotona curzoniae) on plant niche of alpine meadow communities in the Qinghai-Tibet Plateau. Acta Ecol. Sin. 2014, 34, 869–877, (In Chinese with English abstract). [Google Scholar]
- Li, M.; Ma, Y.; Li, S.; Jing, M.; Wang, Y. Effect of controlling the Ochotona curzoniae on plants community characteristics in different degraded alpine meadow. J. Qinghai Univ. 2016, 34, 41–47, (In Chinese with English abstract). [Google Scholar]
- Liu, Y.; Fan, J.; Shi, Z.; Yang, X.; Harris, W. Relationships between plateau pika (Ochotona curzoniae) densitiesand biomass and biodiversity indices of alpine meadow steppe on the Qinghai-Tibet Plateau China. Ecol. Eng. 2017, 102, 509–518. [Google Scholar] [CrossRef]
- Hamer, K.; Hill, J. Scale-dependent effects of habitat disturbance on species richness in tropical forests. Conserv. Biol. 2000, 14, 1435–1440. [Google Scholar] [CrossRef]
- Olofsson, J.; Hulme, P.; Oksanen, L.; Suominen, O. Effects of mammalian herbivores on revegetation of disturbed areas in the forest-tundra ecotone in northern fennoscandia. Landsc. Ecol. 2005, 20, 351–359. [Google Scholar] [CrossRef]
- Arif, M.S.M.; Gülch, E.; Tuhtan, J.A.; Thumser, P.; Haas, C. An investigation of image processing techniques for substrate classification based on dominant grain size using RGB images from UAV. Int. J. Remote Sens. 2017, 38, 2639–2661. [Google Scholar] [CrossRef]
- Yi, S.; Chen, J.; Qin, Y.; Xu, G. The burying and grazing effects of plateau pika on alpine grassland are small: A pilot study in a semiarid basin on the Qinghai-Tibet Plateau. Biogeosciences 2016, 13, 6273–6284. [Google Scholar] [CrossRef] [Green Version]
- Pang, X.; Wang, Q.; Zhang, J.; Xu, H.; Zhang, W.; Wang, J.; Guo, Z. Responses of soil inorganic and organic carbon stocks of alpine meadows to the disturbance by plateau pikas. Eur. J. Soil. Sci. 2019, 13, 1–10. [Google Scholar] [CrossRef]
- Colomina, I.; Molina, P. Unmanned aerial systems for photogrammetry and remote sensing: A review. J. Photogramm. Remote Sens. 2014, 4, 1671–1692. [Google Scholar] [CrossRef] [Green Version]
- Rango, A.; Laliberte, A.; Herrick, J.; Winters, C.; Havstad, K.; Steele, C.; Browning, D. Unmanned aerial vehicle-based remote sensing for rangeland assessment, monitoring, and management. J. Appl. Remote Sens. 2009, 3, 11–15. [Google Scholar]
- Zweig, C.; Burgess, M.; Percival, H.; Kitchens, W. Use of unmanned aircraft systems to delineate fine-scale wetland vegetation communities. Wetlands 2015, 35, 303–309. [Google Scholar] [CrossRef]
- Cruzan, M.B.; Weinstein, B.G.; Grasty, M.R.; Kohrn, B.F.; Hendrickson, E.C.; Arredondo, T.M.; Thompson, P.G. Small unmanned aerial vehicles (micro-uavs, drones) in plant ecology. Appl. Plant Sci. 2016, 4, 1600041. [Google Scholar] [CrossRef] [PubMed]
- Hill, D.J.; Tarasoff, C.; Whitworth, G.E.; Baron, J.; Bradshaw, J.L.; Church, J.S. Utility of unmanned aerial vehicles for mapping invasive plant species: A case study on yellow flag iris (iris pseudacorus L.). Int. J. Remote Sen. 2017, 38, 2083–2105. [Google Scholar] [CrossRef]
- Qin, Y.; Yi, S.; Ding, Y.; Qin, Y.; Zhang, W.; Sun, Y.; Hou, X.; Yu, H.; Meng, B.; Zhang, H.; et al. Effects of plateau pikas’ foraging and burrowing activities on vegetation biomass and soil organic carbon of alpine grasslands. Plant Soil 2020. [Google Scholar] [CrossRef]
- Husson, E.; Hagner, O.; Ecke, F.; Schmidtlein, S. Unmanned aircraft systems help to map aquatic vegetation. Appl. Veg. Sci. 2014, 17, 567–577. [Google Scholar] [CrossRef]
- Sun, Y.; Yi, S.; Hou, F. Unmanned aerial vehicle methods makes species composition monitoring easier in grasslands. Ecol. Indic. 2018, 95, 825–830. [Google Scholar] [CrossRef]
- Baena, S.; Moat, J.; Whaley, O.; Boyd, D.S. Identifying species from the air: UAV and the very high resolution challenge for plant conservation. PLoS ONE 2017, 12, e0188714. [Google Scholar] [CrossRef] [PubMed] [Green Version]
- Lu, B.; He, Y. Species classification using Unmanned Aerial Vehicle (UAV)-acquired high spatial resolution imagery in a heterogeneous grassland. ISPRS J. Photogramm. Remote Sens. 2017, 128, 73–85. [Google Scholar] [CrossRef]
- Li, J. Study on Distribution Models of Permafrost and Zoning Characteristics of Ground Temperatures in Typical Watersheds in the Qilian Mountain. Ph.D. Thesis, Chinese Academy of Science, Beijing, China, 2010. [Google Scholar]
- Yi, S. FragMAP: A tool for long-term and cooperative monitoring and analysis of small-scale habitat fragmentation using an unmanned aerial vehicle. Int. J. Remote Sens. 2017, 38, 2686–2697. [Google Scholar] [CrossRef]
- Shannon, C.E.; Weaver, W. The Mathematical Theory of Communication; University of Illinois Press: Chicago, IL, USA, 1949. [Google Scholar]
- Corsaro, D.; Pages, G.S.; Catalan, V.; Loret, J.F.; Greub, G. Biodiversity of amoebae and amoeba-associated bacteria in water treatment plants. Int. J. Hyg. Environ. Heal. 2010, 213, 158–166. [Google Scholar] [CrossRef]
- Pielou, E.C. Ecological Diversity; Wiley: New York, NY, USA, 1975. [Google Scholar]
- Lepš, J.; Šmilauer, P. Multivariate Analysis of Ecological Data Using CANOCO; Cambridge University Press: Cambridge, UK, 2003. [Google Scholar]
- Ihaka, R.; Gentleman, R. R: A language for data analysis and graphics. J. Comput. Graph. Stat. 1996, 5, 299–314. [Google Scholar]
- Schad, D.J.; Vasishth, S.; Hohenstein, S.; Kliegl, R. How to capitalize on a priori contrasts in linear (mixed) models: A tutorial. J. Mem. Lang. 2018, 110, 104038. [Google Scholar] [CrossRef]
- Wang, W.; Wang, Q.; Li, S.; Wang, G. Distribution and species diversity of plant communities along transect on the northeastern tibetan plateau. Biodivers. Conserv. 2006, 15, 1811–1828. [Google Scholar] [CrossRef]
- Mandanici, E.; Girelli, V.A.; Luca, P. Metric accuracy of digital elevation models from worldview-3 stereo-pairs in urban areas. Remote Sens. 2019, 11, 878. [Google Scholar] [CrossRef] [Green Version]
- Bagchi, S.; Namgail, T.; Ritchie, M.E. Small mammalian herbivores as mediators of plant community dynamics in the high-altitude arid rangelands of trans-Himalaya. Biol. Conserv. 2006, 127, 438–442. [Google Scholar] [CrossRef]
- Klein, J.; Harte, J.; Zhao, X. Experimental warming causes large and rapid species loss, dampened by simulated grazing, on the Tibetan Plateau. Ecol. Lett. 2004, 7, 1170–1179. [Google Scholar] [CrossRef]
- Davidson, A.D.; Detling, J.K.; Brown, J.H. Ecological roles and conservation challenges of social, burrowing, herbivorous mammals in the world’s grasslands. Front. Ecol. Environ. 2012, 10, 477–486. [Google Scholar] [CrossRef] [Green Version]
- Kotlar, N.; Baker, B.; Whicker, A. A critical review of assumptions about the prairie dog as a keystone species. Environ. Manag. 1999, 24, 177–192. [Google Scholar] [CrossRef]
- Dmitriev, P.P. The relationship between some shrubs of the Mongolian steppes and colonies of mammals. Zh. Obshch. Biol. 1985, 46, 661–669. [Google Scholar]
- Sun, F.; Chen, W.; Liu, L.; Liu, W.; Lu, C.; Smith, P. The density of active burrows of plateau pika in relation to biomass allocation in the alpine meadow ecosystems of the Tibetan Plateau. Biochem. Syst. Ecol. 2015, 58, 257–264. [Google Scholar] [CrossRef]
- Brown, I.; Bunker, A.; Malvitz, L. Resource Limitation in Canopy Versus Understory Trees; Biological Station, University of Michigan (UMBS): Pellston, MI, USA, 1998. [Google Scholar]
- Yin, Y.; Chen, H. Numerical experiment of impacts of canopy interception on land surface water and energy balance. J. Meteorol. Sci. 2013, 33, 119–129, (In Chinese with English abstract). [Google Scholar]
- Knapp, B.; Wang, G.; Walker, J.; Hu, H. Using silvicultural practices to regulate competition, resource availability, and growing conditions for Pinus palustris seedlings underplanted in Pinus taeda forests. Can. J. For. Res. 2016, 46, 902–913. [Google Scholar] [CrossRef]
- Huang, G.; Zhao, H.; Li, Y. Litter decomposition in hyper-arid deserts: Photodegradation is still important. Sci. Total. Environ. 2017, 601, 784–792. [Google Scholar] [CrossRef] [PubMed]
- Foster, B.; Gross, K.L. Species richness in a successional grassland: Effects of nitrogen enrichment and plant litte. Ecology 1998, 79, 2593–2602. [Google Scholar] [CrossRef]
- Liu, W.; Zhang, Y.; Wang, X.; Zhao, J.; Zhou, L. The relationship of the harvesting behavior of plateau pikas with the plant community. Acta Theriol. 2009, 29, 40–49, (In Chinese with English abstract). [Google Scholar]
- Pang, X.; Guo, Z. Plateau pika disturbances alter plant productivity and soil nutrients in alpine meadows of the Qinghai-Tibetan Plateau, China. Rangel. J. 2017, 39, 133–144. [Google Scholar] [CrossRef]
- Guo, Z.; Li, X.; Liu, X.; Zhou, X. Response of alpine meadow communities to burrow density changes of plateau pika (Ochotona curzoniae) in the Qinghai-Tibet plateau. Acta Ecol. Sin. 2012, 32, 44–49. [Google Scholar] [CrossRef]
- Wilson, M.; Smith, A. The pika and the watershed: The impact of small mammal poisoning on the ecohydrology of the Qinghai-Tibetan Plateau. Ambio 2015, 44, 16–22. [Google Scholar] [CrossRef] [Green Version]
- Martin, B. The role of small ground-foraging mammals in topsoil health and biodiversity: Implications to management and restoration. Ecol. Manag. Restor. 2003, 4, 114–119. [Google Scholar] [CrossRef]
- Clark, J.; Hellgren, E.; Parsons, J.; Jorgensen, E.; Engle, D.; Leslie, D. Nitrogen outputs from fecal and urine deposition of small mammals: Implications for nitrogen cycling. Oecologia 2005, 144, 447–455. [Google Scholar] [CrossRef]
- Borer, E.; Seabloom, E.; Gruner, D.; Harpole, W. Herbivores and nutrients control grassland plant diversity via light limitation. Nature 2014, 508, 517–520. [Google Scholar] [CrossRef]
- Zhang, W.; Wang, Q.; Zhang, J.; Pang, X.; Wang, J.; Guo, Z. Clipping by plateau pikas and impacts to plant community. Rangel. Ecol. Manag. 2020. [Google Scholar] [CrossRef]
- Tilman, D.; Downing, J. Biodiversity and stability in grasslands. Nature 1994, 367, 363–365. [Google Scholar] [CrossRef]
- Balvanera, P.; Pfisterer, A.; Buchmann, N.; He, J.; Nakashizuka, T.; Raffaelli, D.; Schmid, B. Quantifying the evidence for biodiversity effects on ecosystem functioning and services. Ecol. Lett. 2006, 9, 1146–1156. [Google Scholar] [CrossRef] [PubMed] [Green Version]
- Perkins, D.; Bailey, R.; Dossena, M.; Gamfeldt, L.; Reiss, J.; Trimmer, M.; Woodward, G. Higher biodiversity is required to sustain multiple ecosystem processes across temperature regimes. Glob. Chang. Biol. 2015, 21, 396–406. [Google Scholar] [CrossRef] [Green Version]
- Huston, M.A. A general hypothesis of species diversity. Am. Nat. 1979, 113, 81–101. [Google Scholar] [CrossRef]
- Wu, R.; Chai, Q.; Zhang, J.; Zhong, M.; Liu, Y.; Wei, X.; Pan, D.; Shao, X. Impacts of burrows and mounds formed by plateau rodents on plant species diversity on the Qinghai-Tibetan Plateau. Rangel. J. 2015, 37, 117–123. [Google Scholar] [CrossRef]
- Yan, H.; Zhang, Y.; Zhang, J.; Xu, Q.; Li, L.; Liu, W. Effects of plateau pika (Ochotona curzoniae) on plant community biomass in alpine meadow. Acta Theriol. Sin. 2013, 33, 333–343, (In Chinese with English abstract). [Google Scholar]
- Sun, F.; Lon, R.; Lu, C. Effects of plateau pikas (Ochotona curzoniae) burrow densities on plant community composition and population diversity in alpine meadow. J. Arid. Land. Resour. Environ. 2010, 24, 181–186, (In Chinese with English abstract). [Google Scholar]
- Qin, Y.; Yi, S.; Ding, Y.; Zhang, W.; Qin, Y.; Chen, J.; Wang, Z. Effect of plateau pika disturbance and patchiness on ecosystem carbon emissions in alpine meadow in the northeastern part of Qinghai-Tibetan Plateau. Biogeosciences 2019, 16, 1097–1109. [Google Scholar] [CrossRef] [Green Version]
- Wright, J.; Naeem, S.; Hector, A.; Lehman, C.; Reich, P.; Schmid, B.; Tilman, D. Conventional functional classification schemes underestimate the relationship with ecosystem functioning. Ecol. Lett. 2006, 9, 111–120. [Google Scholar] [CrossRef] [Green Version]
- Hagenah, N.; Bennett, N.C. Mole-rats act as ecosystem engineers within a biodiversity hotspot, the Cape Fynbos. J. Zool. 2013, 289, 19–26. [Google Scholar] [CrossRef] [Green Version]
- Liu, H.; Chen, Y.; Zhou, L.; Jin, Z. The effects of management on population dynamics of plateau pika. Math. Comp. Model. 2013, 57, 525–535. [Google Scholar] [CrossRef]


| Permafrost Types | Average Annual Ground Temperature (°C) | Area (Km2) | Percentage (%) |
|---|---|---|---|
| Extreme stable permafrost | <−5.0 | 2028 | 18 |
| Stable permafrost | −3.0~−5.0 | 1805 | 16 |
| Sub-stable permafrost | −1.5~−3.0 | 2002 | 18 |
| Transition permafrost | −0.5~−1.5 | 1481 | 13 |
| Unstable permafrost | 0.5~−0.5 | 1129 | 10 |
| Seasonal frost | >0.5 | 2847 | 25 |
| Variables | df | λ2 | F | p |
|---|---|---|---|---|
| Species richness | 54 | - | 1.624 | 0.195 ns |
| Shannon index | 54 | 5.799 | - | 0.122 ns |
| Simpson index | 54 | - | 2.229 | 0.096 ns |
| Pielou’s J index | 54 | 4.026 | - | 0.259 ns |
| Total pika burrows ha−1 | 54 | - | 3.170 | 0.032 * |
| Active pika burrows ha−1 | 54 | 1.087 | - | 0.780 ns |
| Pika density ha−1 | 54 | 3.070 | - | 0.381 ns |
| Fractional vegetation cover (%) | 54 | - | 2.495 | 0.070 ns |
| Bare patch area fraction (%) | 54 | - | 2.735 | 0.053 ns |
| Grassland Types | df | λ2 | F | p | |
|---|---|---|---|---|---|
| Alpine swamp meadow | 3 | 3.563 | - | 0.313 ns | |
| Alpine meadow | 3 | 3.705 | - | 0.295 ns | |
| Alpine steppe meadow | 3 | - | 18.956 | <0.001 ** | |
| Alpine steppe | 3 | 11.905 | - | 0.008 * |
| Variables | Simple Effects | Conditional Effects | ||||
|---|---|---|---|---|---|---|
| Explains (%) | pseudo-F | p | Explains (%) | pseudo-F | p | |
| Pika density ha−1 | 13.0 | 7.9 | 0.008 ** | 13.0 | 7.9 | 0.008 * |
| Total pika burrows ha−1 | 12.9 | 7.8 | 0.024 * | 5.9 | 3.8 | 0.084 ns |
| Active pika burrows ha−1 | 11.3 | 6.7 | 0.022 * | 1.6 | 1.2 | 0.464 ns |
© 2020 by the authors. Licensee MDPI, Basel, Switzerland. This article is an open access article distributed under the terms and conditions of the Creative Commons Attribution (CC BY) license (http://creativecommons.org/licenses/by/4.0/).
Share and Cite
Qin, Y.; Sun, Y.; Zhang, W.; Qin, Y.; Chen, J.; Wang, Z.; Zhou, Z. Species Monitoring Using Unmanned Aerial Vehicle to Reveal the Ecological Role of Plateau Pika in Maintaining Vegetation Diversity on the Northeastern Qinghai-Tibetan Plateau. Remote Sens. 2020, 12, 2480. https://doi.org/10.3390/rs12152480
Qin Y, Sun Y, Zhang W, Qin Y, Chen J, Wang Z, Zhou Z. Species Monitoring Using Unmanned Aerial Vehicle to Reveal the Ecological Role of Plateau Pika in Maintaining Vegetation Diversity on the Northeastern Qinghai-Tibetan Plateau. Remote Sensing. 2020; 12(15):2480. https://doi.org/10.3390/rs12152480
Chicago/Turabian StyleQin, Yu, Yi Sun, Wei Zhang, Yan Qin, Jianjun Chen, Zhiwei Wang, and Zhaoye Zhou. 2020. "Species Monitoring Using Unmanned Aerial Vehicle to Reveal the Ecological Role of Plateau Pika in Maintaining Vegetation Diversity on the Northeastern Qinghai-Tibetan Plateau" Remote Sensing 12, no. 15: 2480. https://doi.org/10.3390/rs12152480