
Productivity, Morphology and Chemical Composition of Brachiaria spp. Ecotypes, under Two Solar Illumination Intensities, in Yucatan, Mexico
 , , ,
, , , 
Abstract
:1. Introduction
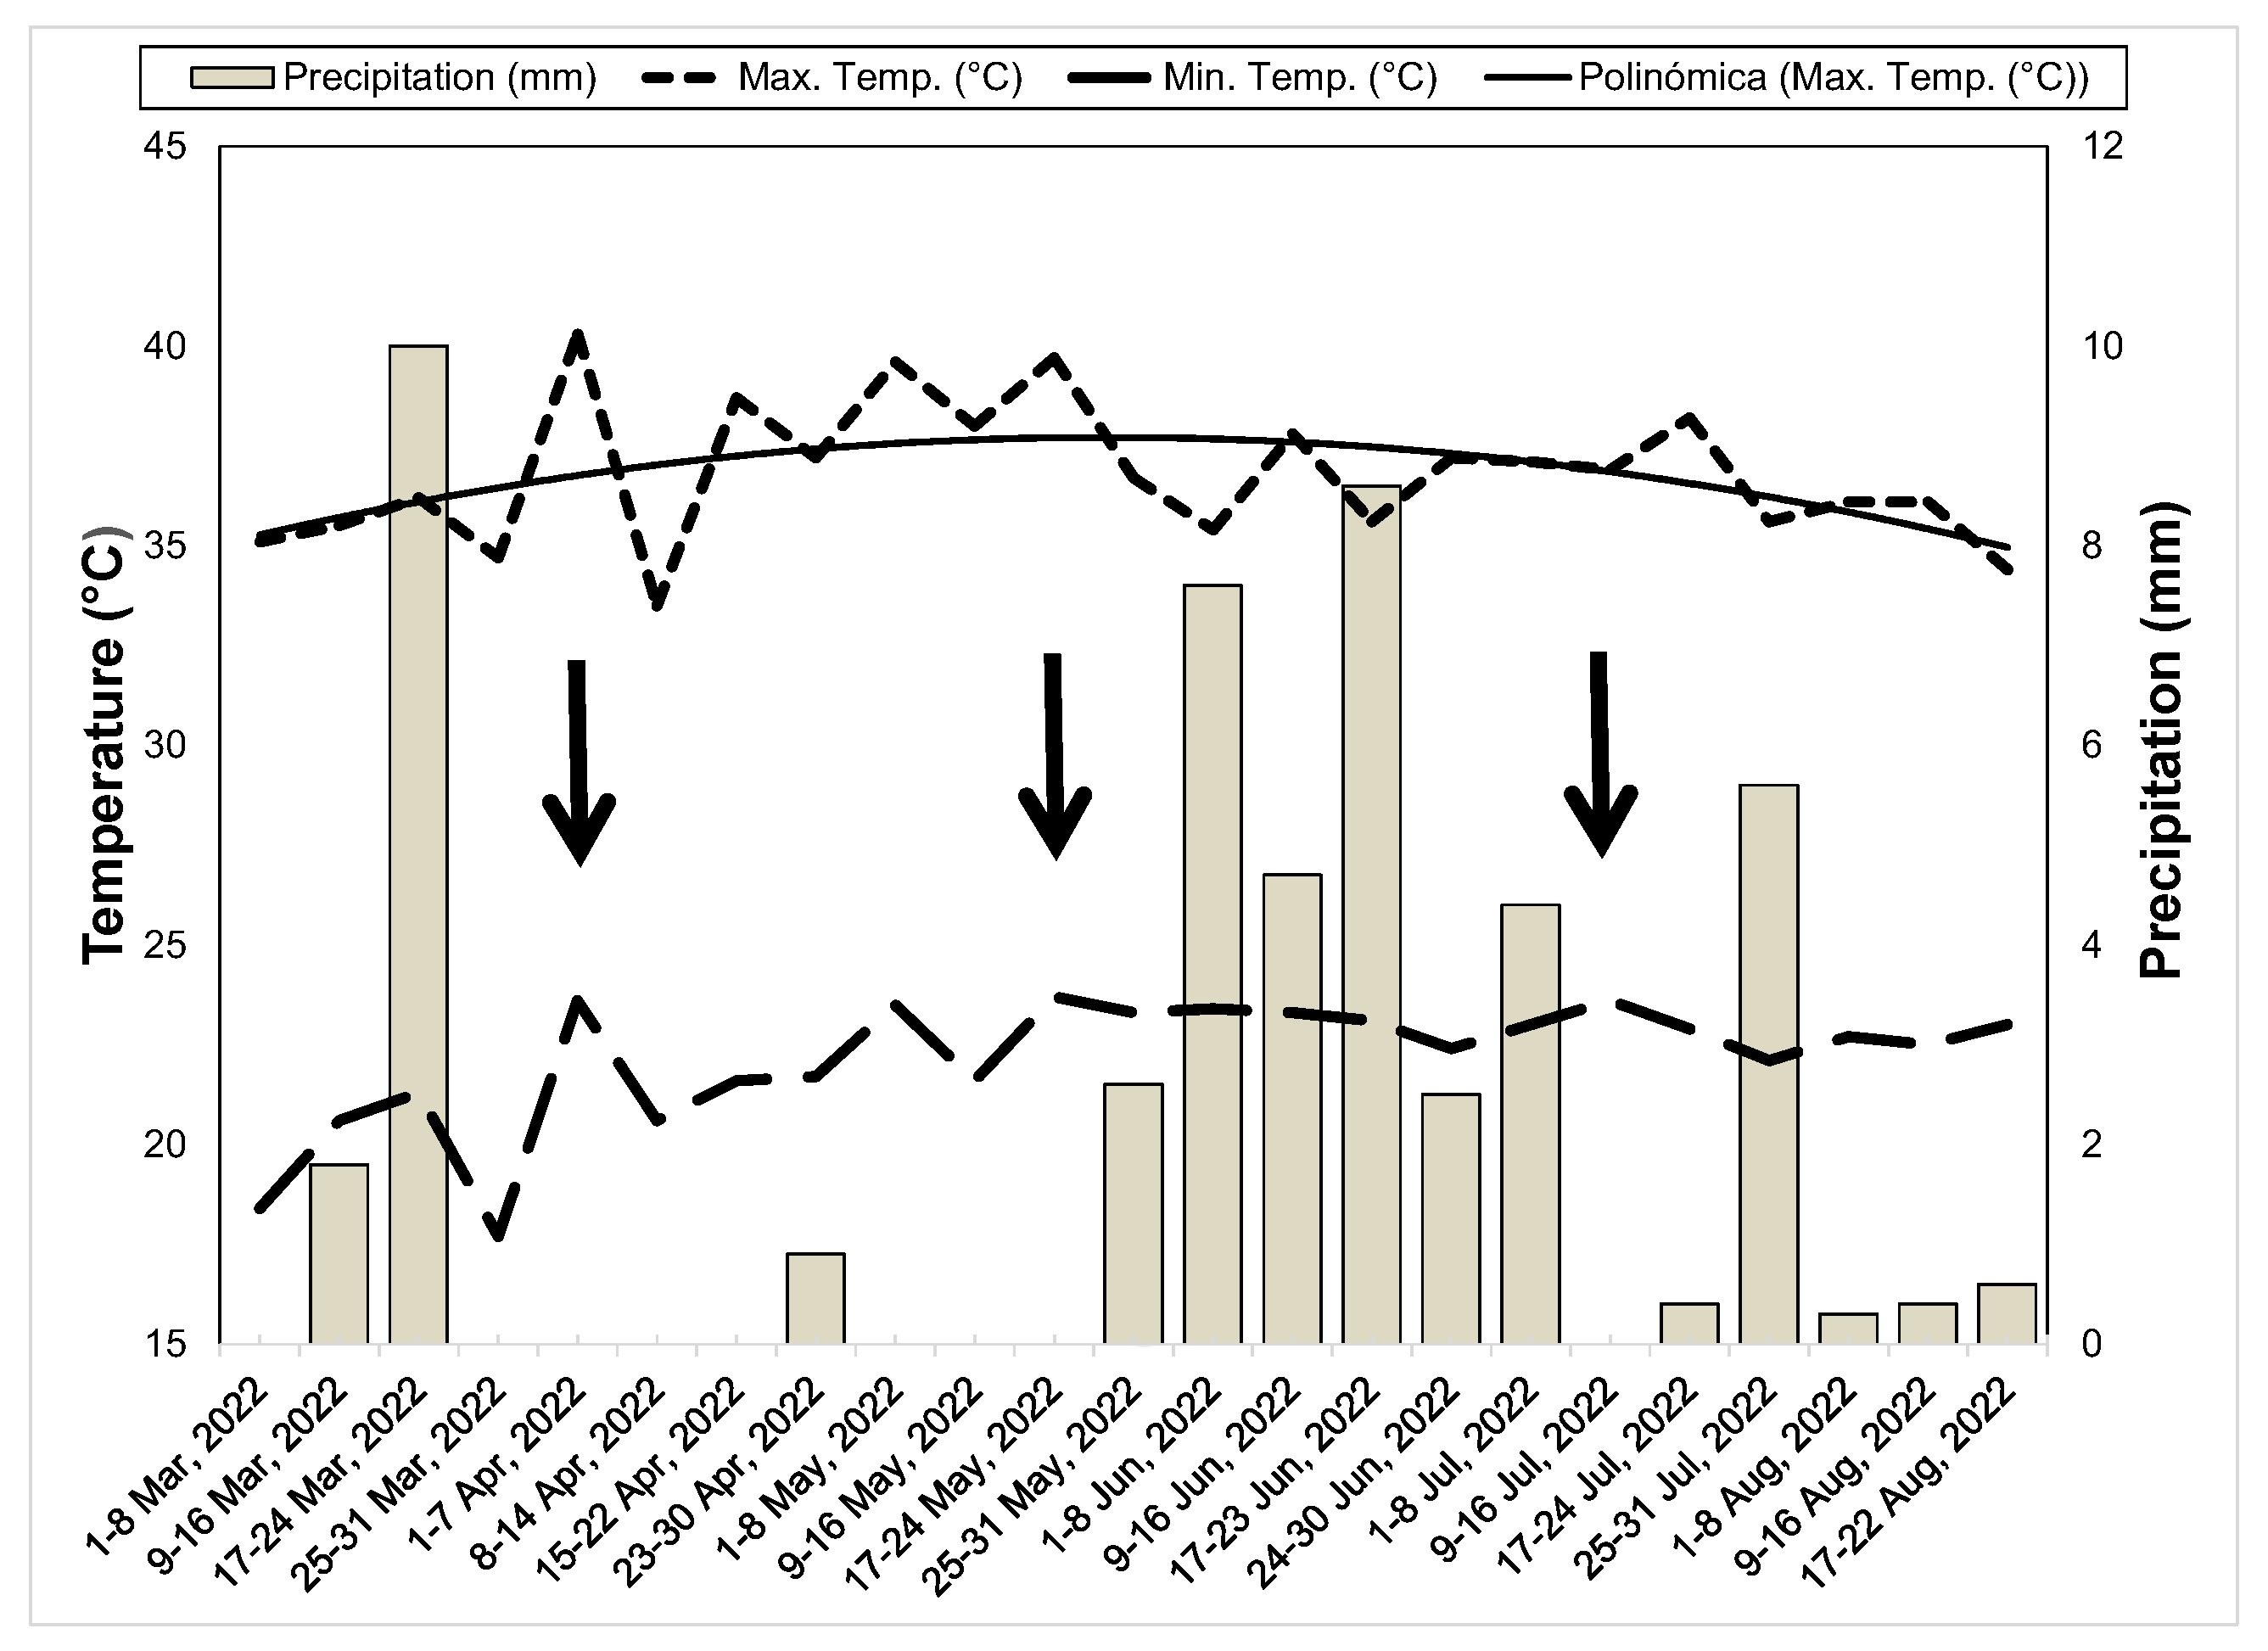
2. Materials and Methods
3. Results
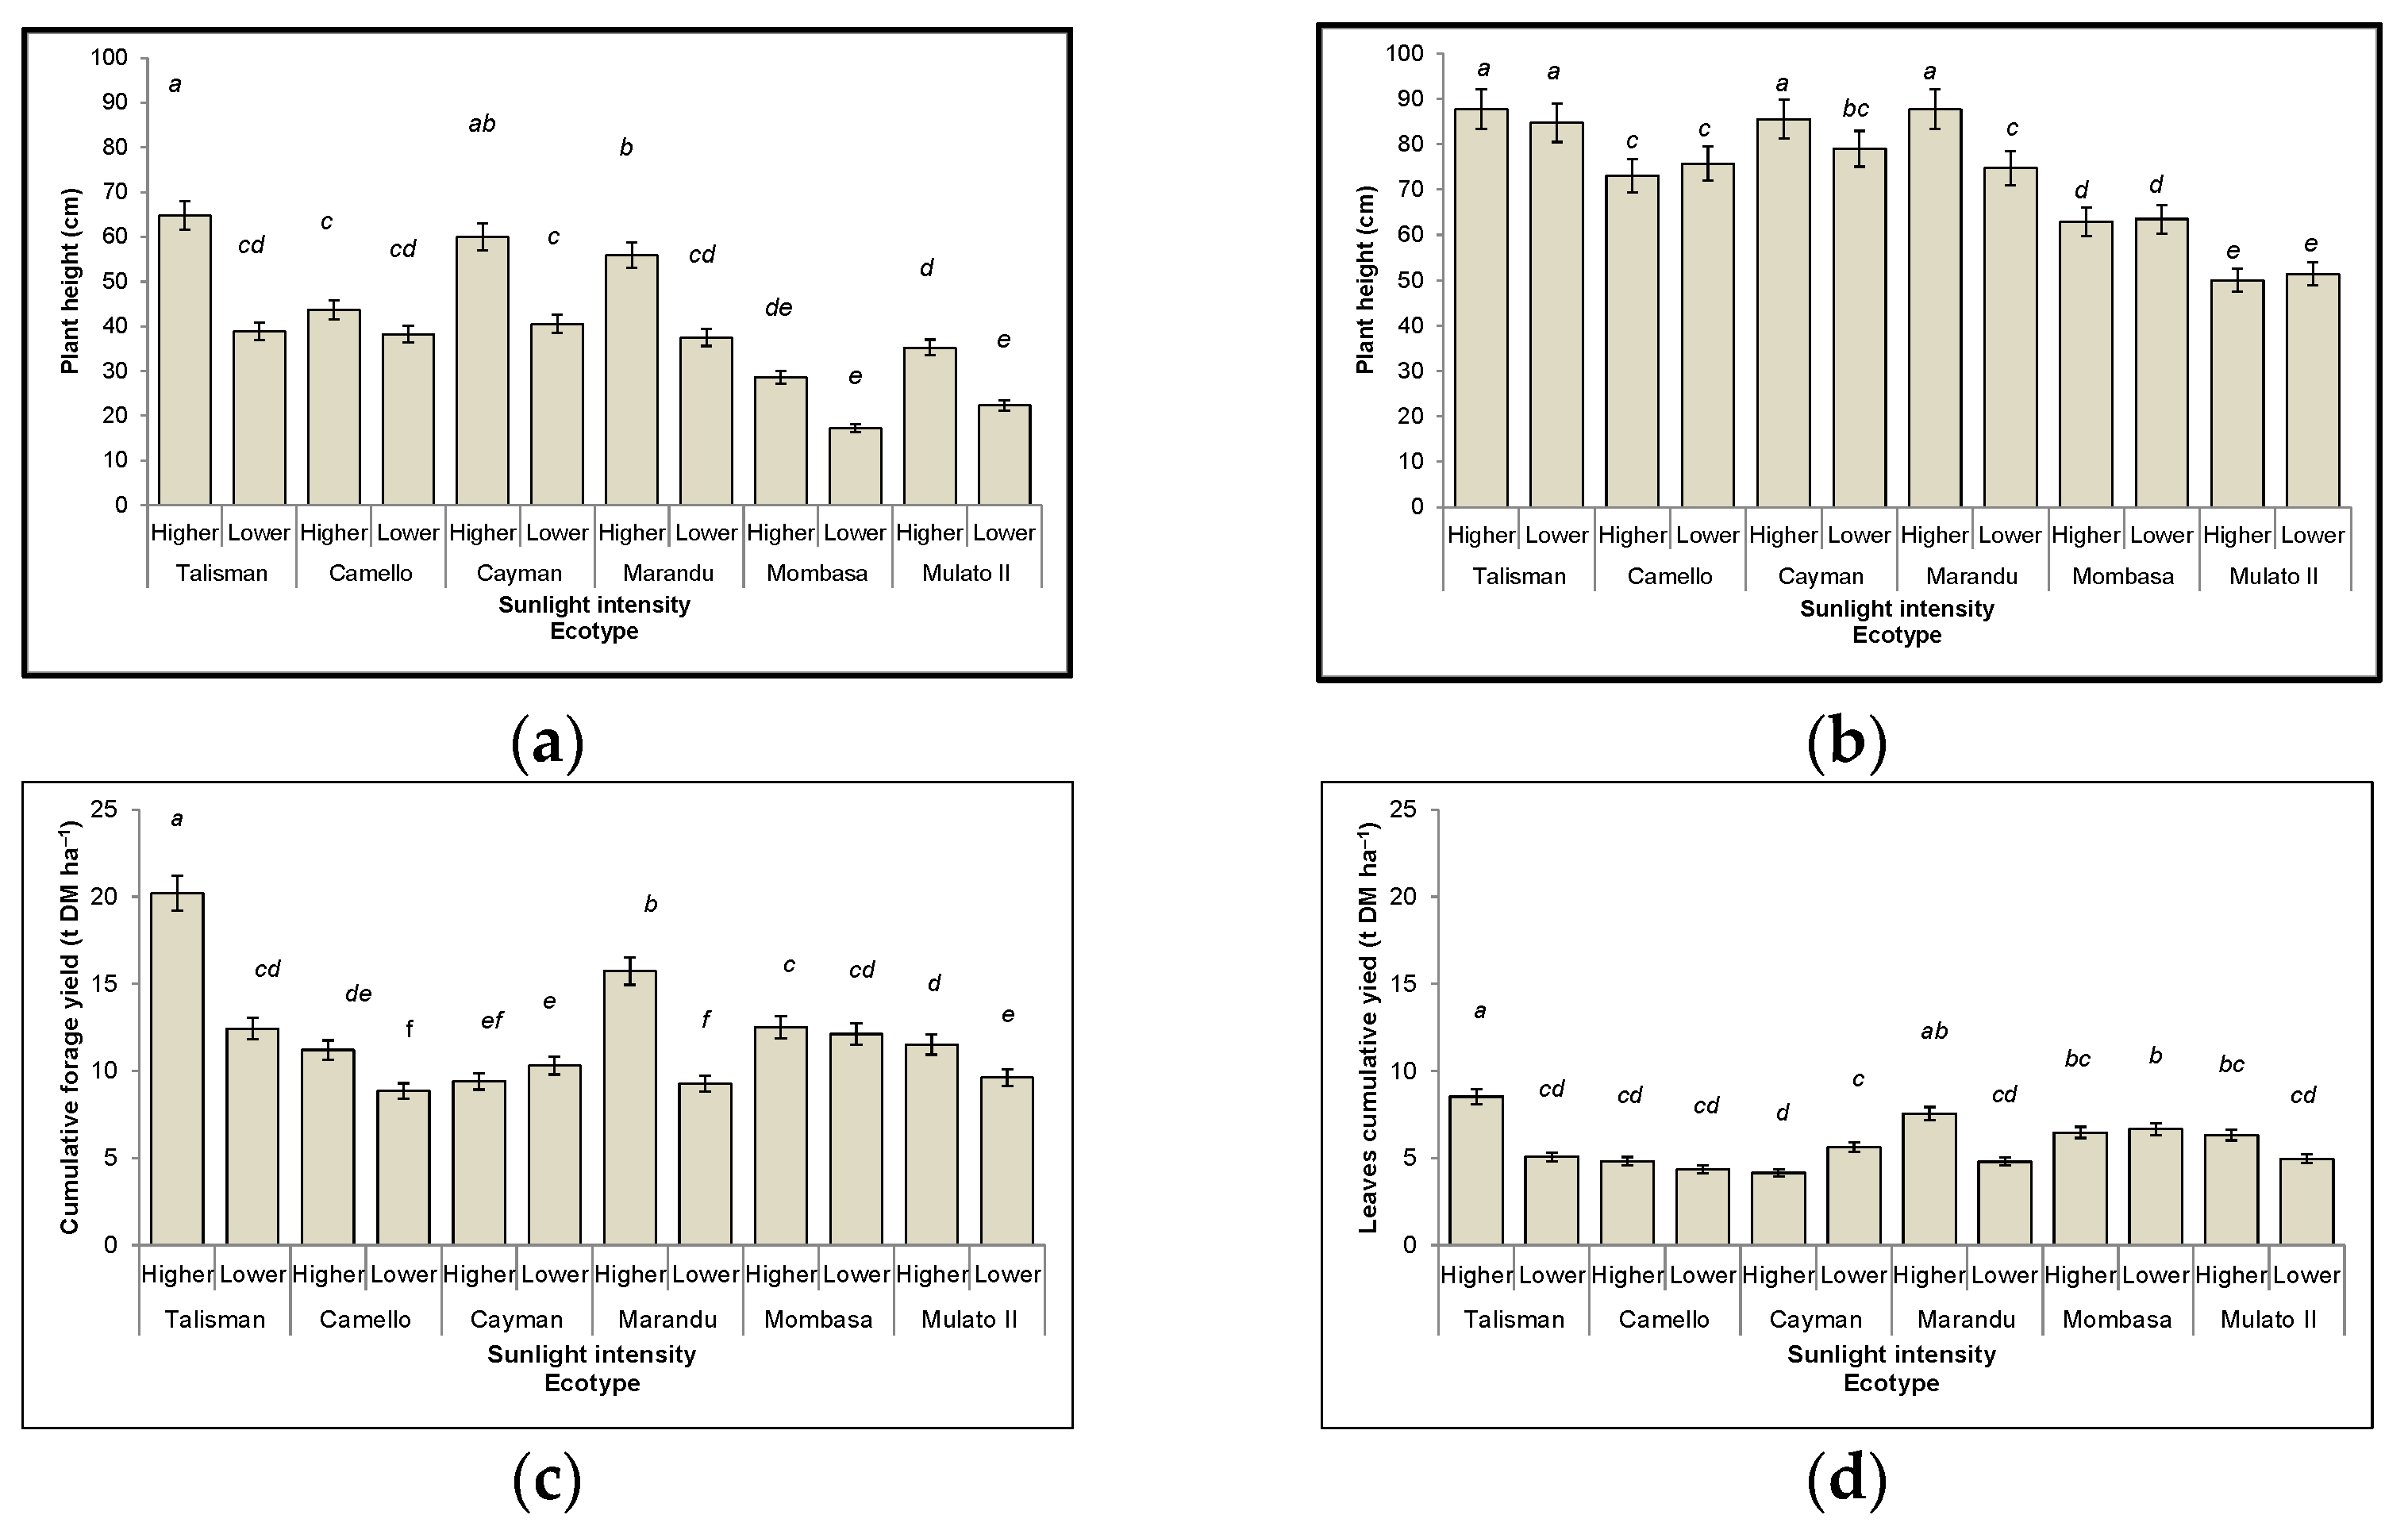
3.1. Plant Height
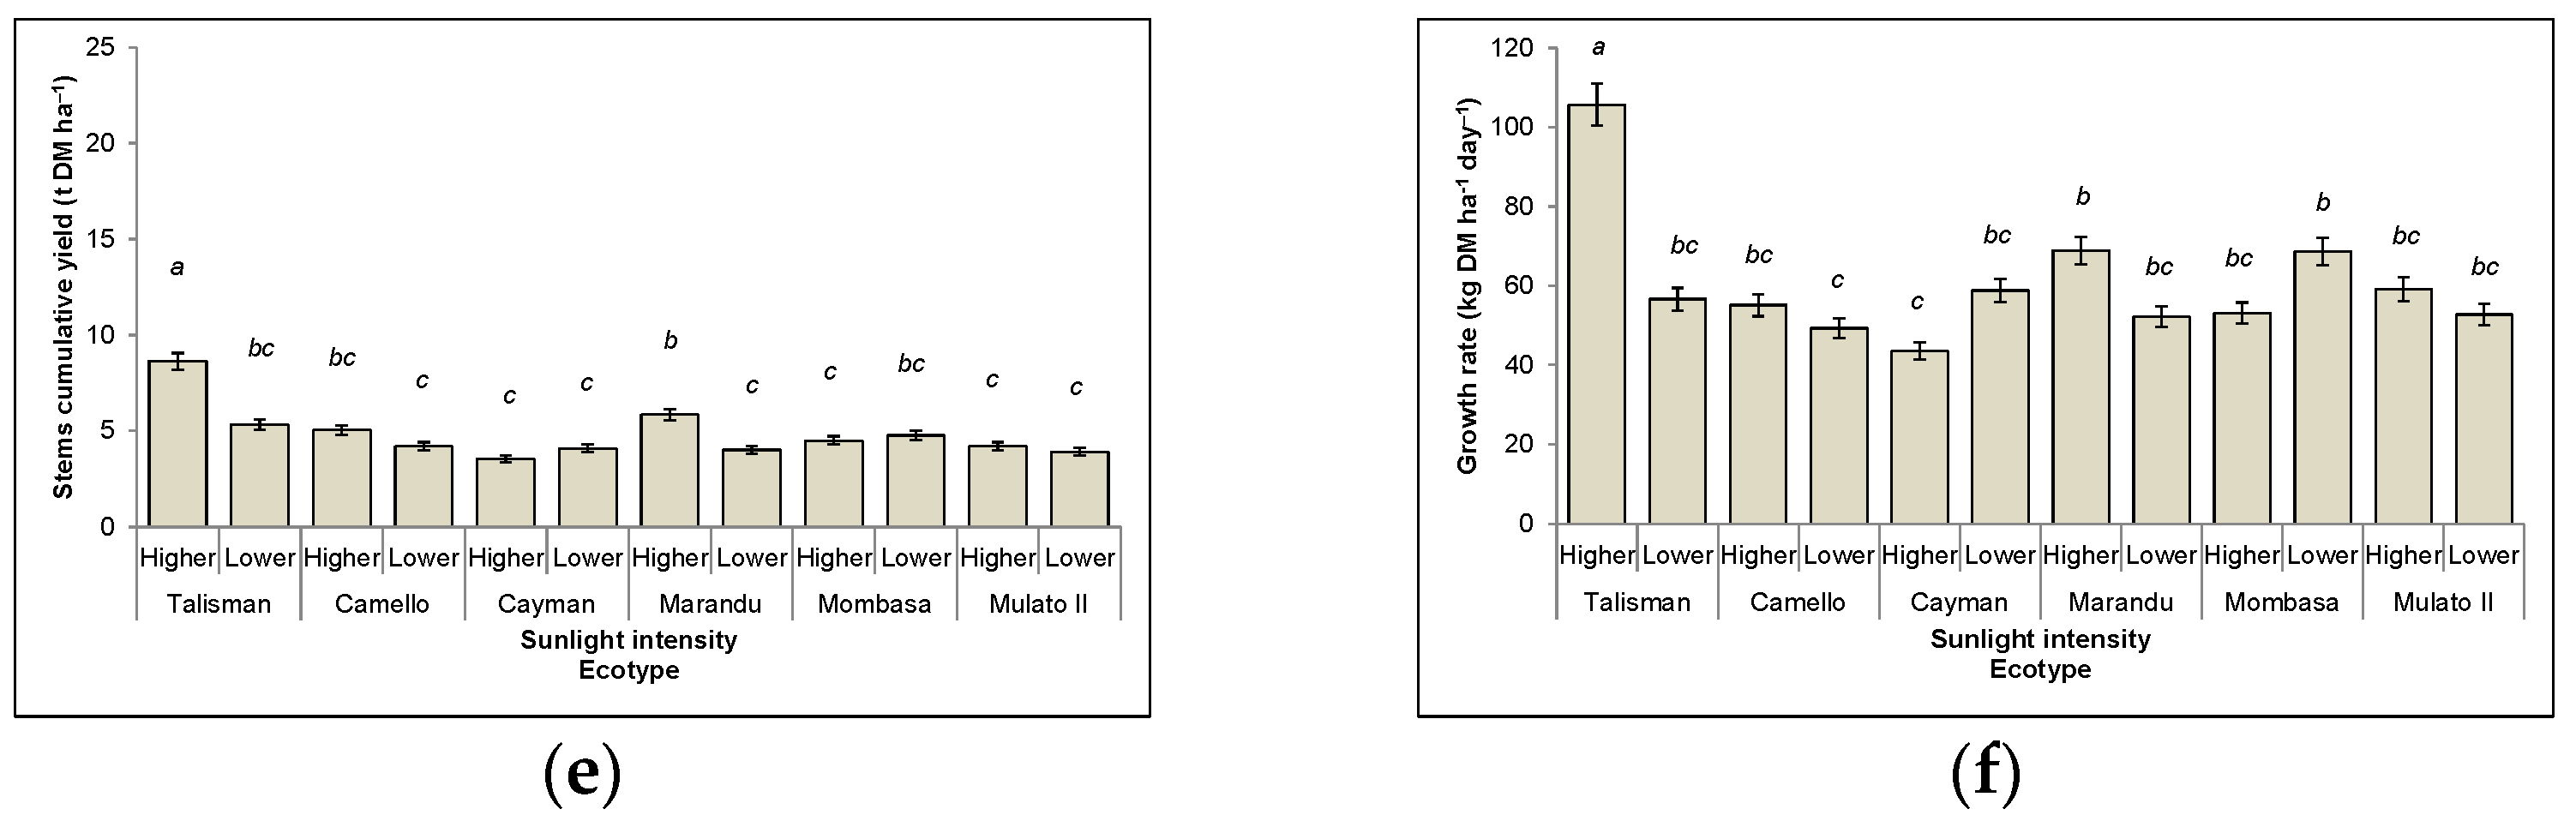
3.2. Cumulative Forage Yield
3.3. Morphologic Components
3.3.1. Leaf
3.3.2. Stems
3.3.3. Leaf:Stem Ratio
3.3.4. Dead Material
3.4. Plant Canopy Cover
3.5. Plant Maturity
3.6. Growth Rate
3.7. Forage Chemical Composition
4. Discussion
4.1. Forage Yields and Chemical Composition
4.2. Leaves, Stems and Dead Material Production
4.3. Particularities of Ecotypes
4.4. Ecotype X Sunlight Intensity Interaction
4.5. Limitations of Our Study
5. Conclusions
Author Contributions
Funding
Data Availability Statement
Acknowledgments
Conflicts of Interest
Appendix A


References
- OECD-FAO. OECD-FAO Agricultural Outlook 2022–2031; FAO: Rome, Italy; OECD: Paris, France, 2022. [Google Scholar]
- Cuartas Cardona, C.A.; Naranjo Ramírez, J.F.; Tarazona Morales, A.M.; Murgueitio Restrepo, E.; Chará Orozco, J.D.; Ku Vera, J.; Solorio Sánchez, F.J.; Flores Estrada, M.X.; Solorio Sánchez, B.; Barahona Rosales, R. Contribution of Intensive Silvopastoral Systems to Animal Performance and to Adaptation and Mitigation of Climate Change. Rev. Colomb. Cienc. Pecu. 2014, 27, 76–94. [Google Scholar]
- Lemes, A.P.; Garcia, A.R.; Pezzopane, J.R.M.; Brandão, F.Z.; Watanabe, Y.F.; Cooke, R.F.; Sponchiado, M.; de Paz, C.C.P.; Camplesi, A.C.; Binelli, M. Silvopastoral System Is an Alternative to Improve Animal Welfare and Productive Performance in Meat Production Systems. Sci. Rep. 2021, 11, 14092. [Google Scholar] [CrossRef] [PubMed]
- Bene, J.; Beall, H.; Côté, A. Trees, Food and People: Land Management in the Tropics; IDRC: Ottawa, ON, Canada, 1977; ISBN 0-88936-121-5. [Google Scholar]
- Sharrow, S.; Brauer, D.; Clason, T. Silvopastoral Practices. In North American agroforestry: An integrated Science and Practice; Gold, M.A., Garrett, H.E., Eds.; John Wiley & Sons: Hoboken, NJ, USA, 2009; pp. 105–131. [Google Scholar]
- Chen, C. Management of Forage for Animal Production under Tree Crops. In Integrated Tree Cropping and Small Ruminant Production Systems; Iniques, L.C., Sanchez, M.D., Eds.; SR-CRSP; University California Davis: Davis, CA, USA, 1990; Volume 1, pp. 10–23. [Google Scholar]
- Belsky, A.J. Influences of Trees on Savanna Productivity: Tests of Shade, Nutrients, and Tree-grass Competition. Ecology 1994, 75, 922–932. [Google Scholar] [CrossRef]
- Paciullo, D.; Pires, M.; Aroeira, L.; Morenz, M.; Maurício, R.; Gomide, C.; Silveira, S. Sward Characteristics and Performance of Dairy Cows in Organic Grass–Legume Pastures Shaded by Tropical Trees. Animal 2014, 8, 1264–1271. [Google Scholar] [CrossRef] [PubMed] [Green Version]
- Lana, R.M.Q.; Lana, Â.M.Q.; Reis, G.L.; Lemes, E.M. Productivity and Nutritive Value of Brachiaria Forage Intercropping with Eucalyptus in a Silvopastoral System in the Brazilian Cerrado Biome. Aust. J. Crop Sci. 2016, 10, 654–659. [Google Scholar] [CrossRef]
- Lima, M.A.; Paciullo, D.S.; Morenz, M.J.; Gomide, C.A.; Rodrigues, R.A.; Chizzotti, F.H. Productivity and Nutritive Value of Brachiaria decumbens and Performance of Dairy Heifers in a Long-term Silvopastoral System. Grass Forage Sci. 2019, 74, 160–170. [Google Scholar] [CrossRef] [Green Version]
- Paciullo, D.S.C.; de Castro, C.R.T.; Gomide, C.A.D.M.; Fernandes, P.B.; da Rocha, W.S.D.; Müller, M.D.; Rossiello, R.O.P. Soil Bulk Density and Biomass Partitioning of Brachiaria decumbens in a Silvopastoral System. Sci. Agric. 2010, 67, 598–603. [Google Scholar] [CrossRef] [Green Version]
- Deinum, B.; Sulastri, R.; Zeinab, M.; Maassen, A. Effects of Light Intensity on Growth, Anatomy and Forage Quality of Two Tropical Grasses (Brachiaria brizantha and Panicum maximum var. Trichoglume). Neth. J. Agri. Sci. 1996, 44, 111–124. [Google Scholar] [CrossRef]
- Dias-Filho, M.B. Photosynthetic Light Response of the C4 Grasses Brachiaria brizantha and B. Humidicola under Shade. Sci. Agric. 2002, 59, 65–68. [Google Scholar] [CrossRef] [Green Version]
- Guenni, O.; Seiter, S.; Figueroa, R. Growth Responses of Three Brachiaria Species to Light Intensity and Nitrogen Supply. Trop. Grassl. Forrajes Trop. 2008, 42, 75. [Google Scholar]
- De Oliveira, C.C.; Villela, S.D.J.; de Almeida, R.G.; Alves, F.V.; Behling-Neto, A.; Martins, P.G.M.D.A. Performance of Nellore Heifers, Forage Mass, and Structural and Nutritional Characteristics of Brachiaria brizantha Grass in Integrated Production Systems. Trop. Anim. Health Prod. 2014, 46, 167–172. [Google Scholar] [CrossRef] [PubMed]
- Améndola, L.; Solorio, F.; Ku-Vera, J.; Améndola-Massiotti, R.; Zarza, H.; Galindo, F. Social Behaviour of Cattle in Tropical Silvopastoral and Monoculture Systems. Animal 2016, 10, 863–867. [Google Scholar] [CrossRef] [PubMed]
- Ku-Vera, J.C.; Valencia-Salazar, S.S.; Piñeiro-Vázquez, A.T.; Molina-Botero, I.C.; Arroyave-Jaramillo, J.; Montoya-Flores, M.D.; Lazos-Balbuena, F.J.; Canul-Solís, J.R.; Arceo-Castillo, J.I.; Ramírez-Cancino, L. Determination of Methane Yield in Cattle Fed Tropical Grasses as Measured in Open-Circuit Respiration Chambers. Agric Meteorol. 2018, 258, 3–7. [Google Scholar] [CrossRef]
- Hernández Hernández, M.; López Ortiz, S.; Jarillo Rodríguez, J.; Ortega Jiménez, E.; Pérez Elizalde, S.; Díaz Rivera, P.; Crosby Galván, M.M. Rendimiento y Calidad Nutritiva Del Forraje En Un Sistema Silvopastoril Intensivo Con Leucaena Leucocephala y Megathyrsus Maximus Cv. Tanzania. Rev. Mex. Cienc. Pecu. 2020, 11, 53–69. [Google Scholar] [CrossRef]
- Njarui, D.; Gatheru, M.; Ghimire, S.R. Brachiaria Grass for Climate Resilient and Sustainable Livestock Production in Kenya. In African Handbook of Climate Change Adaptation; Springer: Cham, Switzerland, 2020; pp. 1–22. [Google Scholar] [CrossRef]
- Cruz, P.; Sierra, J.; Wilson, J.R.; Dulormne, M.; Tournebize, R. Effects of Shade on the Growth and Mineral Nutrition of Tropical Grasses in Silvopastoral Systems. Ann. Arid Zone 1999, 38, 335–361. [Google Scholar]
- Murgueitio, E. Silvopastoral Systems in the Neotropics. In Silvopastoralism and Sustainable Land Management, Proceedings of an International Congress on Silvopastoralism and Sustainable Management, April 2004; CABI Publishing: Wallingford, UK, 2005; pp. 24–29. [Google Scholar]
- Chará, J.; Rivera, J.; Barahona, R.; Murgueitio, R.E.; Deblitz, C.; Reyes, E.; Mauricio, R.M.; Molina, J.J.; Flores, M.; Zuluaga, A. Intensive Silvopastoral Systems: Economics and Contribution to Climate Change Mitigation and Public Policies. In Integrating Landscapes: Agroforestry for Biodiversity Conservation and Food Sovereignty; Springer: Berlin/Heidelberg, Germany, 2017; pp. 395–416. [Google Scholar]
- Duch, G. La Conformación Territorial Del Estado de Yucatán, Los Componentes Del Medio Físico; Universidad Autonoma Chapingo, Centro Regional de la Península de Yucatán: Texcoco, Mexico, 1988. [Google Scholar]
- García, E. Modificaciones al Sistema de Clasificación Climática de Köppen; Universidad Nacional Autónoma de Mexico: Mexico City, Mexico, 2004; ISBN 970-32-1010-4. [Google Scholar]
- Tang, Y.; Washitani, I.; Tsuchiya, T.; Iwaki, H. Fluctuation of Photosynthetic Photon Flux Density within a Miscanthus Sinensis Canopy. Ecol. Res. 1988, 3, 253–266. [Google Scholar] [CrossRef]
- Ibelings, B.W.; Kroon, B.M.; Mur, L.R. Acclimation of Photosystem II in a Cyanobacterium and a Eukaryotic Green Alga to High and Fluctuating Photosynthetic Photon Flux Densities, Simulating Light Regimes Induced by Mixing in Lakes. New Phytol. 1994, 128, 407–424. [Google Scholar] [CrossRef] [PubMed]
- Irmak, S.; Mutiibwa, D.; Irmak, A.; Arkebauer, T.; Weiss, A.; Martin, D.; Eisenhauer, D. On the Scaling up Leaf Stomatal Resistance to Canopy Resistance Using Photosynthetic Photon Flux Density. Agric. For. Meteorol. 2008, 148, 1034–1044. [Google Scholar] [CrossRef]
- Machado, J.-L.; Reich, P.B. Evaluation of Several Measures of Canopy Openness as Predictors of Photosynthetic Photon Flux Density in Deeply Shaded Conifer-Dominated Forest Understory. Can. J. For. Res. 1999, 29, 1438–1444. [Google Scholar] [CrossRef]
- Peri, P.; Lucas, R.; Moot, D. Dry Matter Production, Morphology and Nutritive Value of Dactylis Glomerata Growing under Different Light Regimes. Agrofor. Syst. 2007, 70, 63–79. [Google Scholar] [CrossRef]
- Devkota, N.R.; Kemp, P.D.; Hodgson, J.; Valentine, I.; Jaya, I.K.D. Relationship between Tree Canopy Height and the Production of Pasture Species in a Silvopastoral System Based on Alder Trees. Agrofor. Syst. 2009, 76, 363–374. [Google Scholar] [CrossRef]
- Moore, K.; Moser, L.E.; Vogel, K.P.; Waller, S.S.; Johnson, B.; Pedersen, J.F. Describing and Quantifying Growth Stages of Perennial Forage Grasses. Agron. J. 1991, 83, 1073–1077. [Google Scholar] [CrossRef]
- Moore, K.J.; Moser, L.E. Quantifying Developmental Morphology of Perennial Grasses. Crop Sci. 1995, 35, 37–43. [Google Scholar] [CrossRef]
- Murphy, S.; Lodge, G. Ground Cover in Temperate Native Perennial Grass Pastures. I. A Comparison of Four Estimation Methods. Rangel. J. 2002, 24, 288–300. [Google Scholar] [CrossRef]
- Seefeldt, S.S.; Booth, D.T. Measuring Plant Cover in Sagebrush Steppe Rangelands: A Comparison of Methods. Environ. Manag. 2006, 37, 703–711. [Google Scholar] [CrossRef] [PubMed]
- AOAC. Official Methods of Analysis of AOAC International; George, W.L., Jr., Ed.; AOAC International: Rockville, MD, USA, 2016. [Google Scholar]
- Kass, M.; Rodriguez, G. Evaluacion Nutricional de Alimentos; CATIE: Turrialba, Costa Rica, 1993. [Google Scholar]
- Goering, H.; Van Soest, P.J. Forage Fiber Analysis. Agricultural Handbook No. 379; US Department of Agriculture: Washington, DC, USA, 1970; pp. 1–20.
- SAS Institute Inc. Help and Documentation 2002–2004; SAS Institute Inc.: Cary, NC, USA, 2002. [Google Scholar]
- Ndikumana, J.; de Leeuw, P. Regional Experience with Brachiaria: Sub-Saharan Africa. In Brachiaria: Biology, Agronomy, and Improvement; CIAT: Cali, Colombia, 1996; Volume 1, pp. 247–257. [Google Scholar]
- Cruz Hernández, A.; Hernández Garay, A.; Enríquez Quiroz, J.F.; Gómez Vázquez, A.; Ortega Jiménez, E.; Maldonado García, N.M. Producción de Forraje y Composición Morfológica Del Pasto Mulato (Brachiaria Híbrido 36061) Sometido a Diferentes Regímenes de Pastoreo. Rev. Mex. Cienc. Pecu. 2011, 2, 429–443. [Google Scholar]
- Vendramini, J.M.; Sollenberger, L.E.; Soares, A.B.; Da Silva, W.L.; Sanchez, J.M.; Valente, A.L.; Aguiar, A.D.; Mullenix, M.K. Harvest Frequency Affects Herbage Accumulation and Nutritive Value of Brachiaria Grass Hybrids in Florida. Trop. Grassl. Forrajes Trop. 2014, 2, 197–206. [Google Scholar] [CrossRef] [Green Version]
- Pedreira, C.G.; Braga, G.J.; Portela, J.N. Herbage Accumulation, Plant-Part Composition and Nutritive Value on Grazed Signal Grass (Brachiaria decumbens) Pastures in Response to Stubble Height and Rest Period Based on Canopy Light Interception. Crop Pasture Sci. 2017, 68, 62–73. [Google Scholar] [CrossRef]
- Pizarro, E.A.; Hare, M.D.; Mutimura, M.; Bai, C. Brachiaria Hybrids: Potential, Forage Use and Seed Yield. Trop. Grassl. Forrajes Trop. 2013, 1, 31–35. [Google Scholar] [CrossRef]
- Rodrigues, R.C.; Sousa, T.V.; Melo, M.A.; Araújo, J.S.; Lana, R.P.; Costa, C.S.; Oliveira, M.E.; Parente, M.O.; Sampaio, I.B. Agronomic, Morphogenic and Structural Characteristics of Tropical Forage Grasses in Northeast Brazil. Trop. Grassl. Forrajes Trop. 2014, 2, 214–222. [Google Scholar] [CrossRef] [Green Version]
- De Góis Fontes, J.G.; Fagundes, J.L.; Backes, A.A.; Barbosa, L.T.; Cerqueira, E.S.A.; da Silva, L.M.; da Silva Morais, J.A.; Vieira, J.S. Herbage Accumulation in Brachiaria brizantha Cultivars Submitted to Defoliation Intensities. Semin. Cienc. Agrar. 2014, 35, 1425–14838. [Google Scholar]
- Faria, B.M.; Morenz, M.J.F.; Paciullo, D.S.C.; Lopes, F.C.F.; Gomide, C.A.D.M. Growth and Bromatological Characteristics of Brachiaria decumbens and Brachiaria Ruziziensis under Shading and Nitrogen. Rev. Cienc. Agron. 2018, 49, 529–536. [Google Scholar] [CrossRef]
- Machado, V.D.; da Fonseca, D.M.; Lima, M.A.; Martuscello, J.A.; Paciullo, D.S.; Chizzotti, F.H. Grazing Management Strategies for Urochloa Decumbens (Stapf) R. Webster in a Silvopastoral System under Rotational Stocking. Grass Forage Sci. 2020, 75, 266–278. [Google Scholar] [CrossRef]
- Paciullo, D.S.; Fernandes, P.B.; Carvalho, C.A.; Morenz, M.J.; Lima, M.A.; Mauricio, R.M.; Gomide, C.A. Pasture and Animal Production in Silvopastoral and Open Pasture Systems Managed with Crossbred Dairy Heifers. Livest. Sci. 2021, 245, 104426. [Google Scholar] [CrossRef]
- Lemaire, G.; Gastal, F.N. Uptake and Distribution in Plant Canopies. In Diagnosis of the Nitrogen Status in Crops; Springer: Berlin/Heidelberg, Germany, 1997; pp. 3–43. [Google Scholar]
- Grant, K.; Kreyling, J.; Dienstbach, L.F.; Beierkuhnlein, C.; Jentsch, A. Water Stress Due to Increased Intra-Annual Precipitation Variability Reduced Forage Yield but Raised Forage Quality of a Temperate Grassland. Agric. Ecosyst. Environ. 2014, 186, 11–22. [Google Scholar] [CrossRef]
- Wangchuk, K.; Darabant, A.; Gratzer, G.; Wurzinger, M.; Zollitsch, W. Forage Yield and Cattle Carrying Capacity Differ by Understory Type in Conifer Forest Gaps. Livest. Sci. 2015, 180, 226–232. [Google Scholar] [CrossRef]
- Ali, W.; Nadeem, M.; Ashiq, W.; Zaeem, M.; Thomas, R.; Kavanagh, V.; Cheema, M. Forage Yield and Quality Indices of Silage-Corn Following Organic and Inorganic Phosphorus Amendments in Podzol Soil under Boreal Climate. Agronomy 2019, 9, 489. [Google Scholar] [CrossRef] [Green Version]
- De Castro Santos, D.; Júnior, R.G.; Vilela, L.; Maciel, G.A.; de Souza França, A.F. Implementation of Silvopastoral Systems in Brazil with Eucalyptus Urograndis and Brachiaria brizantha: Productivity of Forage and an Exploratory Test of the Animal Response. Agric. Ecosyst. Environ. 2018, 266, 174–180. [Google Scholar] [CrossRef]
- Moore, K.J.; Boote, K.J.; Sanderson, M.A. Physiology and Developmental Morphology. Warm Seas. Grasses 2004, 45, 179–216. [Google Scholar]
- Mitchell, R.B.; Redfearn, D.; Moore, K.J. Growth and Development. In Forages: The Science of Grassland Agriculture; John Wiley & Sons Ltd.: Hoboken, NJ, USA, 2020; Volume II. [Google Scholar]
- Hanson, J.; Schultze-Kraft, R.; Peters, M.; Wenzl, P.; Amri, A.; Shehadeh, A.; Yazbek, M. Forage Diversity, Conservation and Use. In The Impact of the International Livestock Research Institute; McIntire, J., Grace, D., Eds.; ILRI: Nairobi, Kenya; Wallingford, UK, 2020; pp. 423–449. [Google Scholar]
- Pasto híbrido Camello®. Available online: http://grupopapalotla.com/producto-camello.html (accessed on 25 October 2022).
- Peralta Chavarria, E.; Ruiz Altamirano, H.J. Potencial Forrajero y Nutritivo de Los Pastos Hibridos: Brachiaria Hibrido CIAT BRO2/1752 Cv. Cayman, Brachiaria Hibrido CIAT BRO2/1794 Cv. Cobra y Brachiaria Hibrido GP 3025 Cv. Camello, Periodo Lluvioso, Finca Santa Rosa Managua 2019. Ph.D. Thesis, Universidad Nacional Agraria, Managua, Nicaragua, 2020. [Google Scholar]
- Menendez, C.A.; Miranda, E.J. Establecimiento y Caracterización Del Pasto Camello (Brachiaria Híbrido GP 3025) En Zamorano, Honduras. Bachelor’s Thesis, Escuela Agrícola Panamericana, Zamorano, Honduras, 2021. [Google Scholar]
- Uuh-Sonda, J.M.; Gutiérrez-Jurado, H.A.; Figueroa-Espinoza, B.; Méndez-Barroso, L.A. On the Ecohydrology of the Yucatan Peninsula: Evapotranspiration and Carbon Intake Dynamics across an Eco-climatic Gradient. Hydrol Process. 2018, 32, 2806–2828. [Google Scholar] [CrossRef]
- Uuh-Sonda, J.M.; Figueroa-Espinoza, B.; Gutiérrez-Jurado, H.A.; Méndez-Barroso, L.A. Ecosystem Productivity and Evapotranspiration Dynamics of a Seasonally Dry Tropical Forest of the Yucatan Peninsula. J. Geophys. Res. Biogeosci. 2022, 127, e2019JG005629. [Google Scholar] [CrossRef]
- Feldhake, C.M. Forage Evapotranspiration and Photosynthetically Active Radiation Interception in Proximity to Deciduous Trees. Agric. Water Manag. 2009, 96, 1170–1174. [Google Scholar] [CrossRef]
- Yu, Q.; Shah, K.; Wang, D.; Ma, Y.; Wang, Z. Model Based Study of Crop Evapotranspiration under Canopy Shading. Agronomy 2019, 9, 334. [Google Scholar] [CrossRef] [Green Version]
- Bosi, C.; Pezzopane, J.R.M.; Sentelhas, P.C. Silvopastoral System with Eucalyptus as a Strategy for Mitigating the Effects of Climate Change on Brazilian Pasturelands. Anais Acad. Brasil. Cienc. 2020, 92, e20180425. [Google Scholar] [CrossRef] [PubMed] [Green Version]
- Bosi, C.; Pezzopane, J.R.M.; Sentelhas, P.C. Soil Water Availability in a Full Sun Pasture and in a Silvopastoral System with Eucalyptus. Agrofor. Syst. 2020, 94, 429–440. [Google Scholar] [CrossRef]
- Coble, A.P.; Contosta, A.R.; Smith, R.G.; Siegert, N.W.; Vadeboncoeur, M.; Jennings, K.A.; Stewart, A.J.; Asbjornsen, H. Influence of Forest-to-Silvopasture Conversion and Drought on Components of Evapotranspiration. Agric. Ecosyst. Environ. 2020, 295, 106916. [Google Scholar] [CrossRef]
- Benegas, L.; Hasselquist, N.; Bargues Tobella, A.; Malmer, A.; Ilstedt, U. Positive Effects of Scattered Trees on Soil Water Dynamics in a Pasture Landscape in the Tropics. Front. Water 2021, 3, 736824. [Google Scholar] [CrossRef]
- González, A.; Martín, I.; Ayerbe, L. Barley Yield in Water-Stress Conditions: The Influence of Precocity, Osmotic Adjustment and Stomatal Conductance. Field Crops Res. 1999, 62, 23–34. [Google Scholar] [CrossRef]
- González, A.; Martin, I.; Ayerbe, L. Yield and Osmotic Adjustment Capacity of Barley under Terminal Water-stress Conditions. J. Agron. Crop Sci. 2008, 194, 81–91. [Google Scholar] [CrossRef]
- Gobbi, K.F.; Garcia, R.; Garcez Neto, A.F.; Pereira, O.G.; Ventrella, M.C.; Rocha, G.C. Morphological and Structural Characteristics and Productivity of Brachiaria Grass and Forage Peanut Submitted to Shading. Rev. Bras. Zootec. 2009, 38, 1645–1654. [Google Scholar] [CrossRef] [Green Version]
- Xavier, D.F.; da Silva Lédo, F.J.; Paciullo, D.S.; Urquiaga, S.; Alves, B.J.; Boddey, R.M. Nitrogen Cycling in a Brachiaria-Based Silvopastoral System in the Atlantic Forest Region of Minas Gerais, Brazil. Nutr. Cycling Agroecosyst. 2014, 99, 45–62. [Google Scholar] [CrossRef]
- Martuscello, J.A.; Jank, L.; Gontijo Neto, M.M.; Laura, V.A.; da Cunha, D.D.N.F.V. Genus Brachiaria Grass Yields under Different Shade Levels. Rev. Bras. Zootec. 2009, 38, 1183–1190. [Google Scholar] [CrossRef] [Green Version]
- Paciullo, D.S.C.; Fernandes, P.B.; de Gomide, C.A.M.; de Castro, C.R.T.; de Sobrinho, F.S.; de Carvalho, C.A.B. The Growth Dynamics in Brachiaria Species According to Nitrogen Dose and Shade. Rev. Bras. Zootec. 2011, 40, 270–276. [Google Scholar] [CrossRef]


| Block Number | Family | Scientific Name | Mayan Common Name | Number of Trees ha−1 |
|---|---|---|---|---|
| 1 | Fabaceae | Caesalpinia gaumeri (Greenm.) | Kitinché, Kitanché | 720 |
| Boraginaceae | Bourreria pulchra (Millsp.) | Bakal che’ | 80 | |
| 2 | Fabaceae | Piscidia piscipula (L.) Sarg. | Habín | 140 |
| Fabaceae | Caesalpinia gaumeri (Greenm.) | Kitinché, Kitanché | 90 | |
| 3 | Fabaceae | Caesalpinia gaumeri (Greenm.) | Kitinché, Kitanché | 100 |
| Fabaceae | Piscidia piscipula (L.) Sarg. | Habín | 70 | |
| 4 | Fabaceae | Caesalpinia gaumeri (Greenm.) | Kitinché, Kitanché | 100 |
| Fabaceae | Piscidia piscipula (L.) Sarg. | Habín | 70 | |
| 5 | Fabaceae | Piscidia piscipula (L.) Sarg. | Habín | 100 |
| Burseraceae | Bursera simaruba (L.) Rose | Chaká | 25 | |
| Fabaceae | Havardia albicans (Kunth.) Britton et Rose | Chukum | 50 | |
| Rhamnaceae | Karwinskia humboldtiana (Willd. ex Schult.) Zucc. | Lu’um chakte’ | 50 | |
| 6 | Fabaceae | Piscidia piscipula (L.) Sarg. | Habín | 30 |
| n | Variable | Mean | S.E. | n | Variable | Mean | S.E. |
|---|---|---|---|---|---|---|---|
| Higher Sunlight Intensity | Lower Sunlight Intensity | ||||||
| Talisman | |||||||
| 3 | DM | 27 | 4.0 | 3 | DM | 20 | 0.7 |
| CP | 11 | 0.3 | CP | 12 | 2.6 | ||
| NDF | 61 | 0.5 | NDF | 59 | 2.6 | ||
| ADF | 35 | 1.1 | ADF | 34 | 2.7 | ||
| Camello | |||||||
| 3 | DM | 25 | 1.3 | 3 | DM | 23 | 1.9 |
| CP | 12 | 2.2 | CP | 9 | 1.8 | ||
| NDF | 65 | 2.7 | NDF | 67 | 2.7 | ||
| ADF | 37 | 2.8 | ADF | 40 | 2.2 | ||
| Cayman | |||||||
| 3 | DM | 23 | 3.6 | 3 | DM | 17 | 1.1 |
| CP | 12 | 1.5 | CP | 10 | 2.9 | ||
| NDF | 60 | 2.9 | NDF | 61 | 2.9 | ||
| ADF | 35 | 2.2 | ADF | 36 | 2.9 | ||
| Marandu | |||||||
| 3 | DM | 23 | 2.3 | 3 | DM | 19 | 1.6 |
| CP | 10 | 2.5 | CP | 11 | 2.3 | ||
| NDF | 63 | 3.9 | NDF | 62 | 3.3 | ||
| ADF | 38 | 4.1 | ADF | 37 | 2.7 | ||
| Mombasa | |||||||
| 3 | DM | 21 | 0.4 | 3 | DM | 21 | 1.2 |
| CP | 12 | 1.1 | CP | 9 | 2.9 | ||
| NDF | 66 | 1.8 | NDF | 67 | 2.4 | ||
| ADF | 39 | 2.7 | ADF | 40 | 2.7 | ||
| Mulato II | |||||||
| 3 | DM | 22 | 0.8 | 3 | DM | 20 | 1.5 |
| CP | 15 | 0.8 | CP | 11 | 2.1 | ||
| NDF | 57 | 1.5 | NDF | 63 | 2.1 | ||
| ADF | 32 | 0.6 | ADF | 38 | 2.4 | ||
Publisher’s Note: MDPI stays neutral with regard to jurisdictional claims in published maps and institutional affiliations. |
© 2022 by the authors. Licensee MDPI, Basel, Switzerland. This article is an open access article distributed under the terms and conditions of the Creative Commons Attribution (CC BY) license (https://creativecommons.org/licenses/by/4.0/).
Share and Cite
Torres-Lugo, R.B.; Solorio-Sánchez, F.J.; Ramírez y Avilés, L.; Ku-Vera, J.C.; Aguilar-Pérez, C.F.; Santillano-Cázares, J. Productivity, Morphology and Chemical Composition of Brachiaria spp. Ecotypes, under Two Solar Illumination Intensities, in Yucatan, Mexico. Agronomy 2022, 12, 2634. https://doi.org/10.3390/agronomy12112634
Torres-Lugo RB, Solorio-Sánchez FJ, Ramírez y Avilés L, Ku-Vera JC, Aguilar-Pérez CF, Santillano-Cázares J. Productivity, Morphology and Chemical Composition of Brachiaria spp. Ecotypes, under Two Solar Illumination Intensities, in Yucatan, Mexico. Agronomy. 2022; 12(11):2634. https://doi.org/10.3390/agronomy12112634
Chicago/Turabian StyleTorres-Lugo, Reyes B., Francisco Javier Solorio-Sánchez, Luis Ramírez y Avilés, Juan Carlos Ku-Vera, Carlos Fernando Aguilar-Pérez, and Jesús Santillano-Cázares. 2022. "Productivity, Morphology and Chemical Composition of Brachiaria spp. Ecotypes, under Two Solar Illumination Intensities, in Yucatan, Mexico" Agronomy 12, no. 11: 2634. https://doi.org/10.3390/agronomy12112634