

Drought Stress Affects the Reproductive Biology of Avena sterilis ssp. ludoviciana
by
 , , , and
Mohammad Ali
1,2,*,
Alwyn Williams
1,
Michael Widderick
3,
Mohammad Anamul Haque
4 and
Steve Adkins
1 1
School of Agriculture and Food Sustainability, The University of Queensland, Gatton, QLD 4343, Australia
2
Queensland Department of Agriculture and Fisheries, Emerald, QLD 4720, Australia
3
Queensland Department of Agriculture and Fisheries, Toowoomba, QLD 4350, Australia
4
Department of Statistics, Shahjalal University of Science and Technology, Sylhet 3114, Bangladesh
*
Author to whom correspondence should be addressed.
Land 2023, 12(9), 1745; https://doi.org/10.3390/land12091745
Submission received: 12 June 2023
/
Revised: 25 August 2023
/
Accepted: 4 September 2023
/
Published: 8 September 2023
(This article belongs to the Special Issue Sustainable Land Management, Climate Change and Food Security)
Abstract
:Avena sterilis ssp. ludoviciana (hereafter, A. ludoviciana) is considered the most difficult-to-control winter weed in the Northern Grains Region (NGR) of Australia. The abundance of this weed has increased after the adoption of the no-tillage conservation agriculture (NTCA) approach, which does not bury seeds deep in the soil profile. In addition, the increasing frequency and intensity of drought stress events during the late winter to early spring period in the NGR may modify this weed’s persistence mechanisms, which may further impact crop production. The present study focused on plant maturity time and seed production, dormancy, and longevity of four NGR A. ludoviciana biotypes in relation to the severity of drought stress over 2 consecutive years. Plants of all four A. ludoviciana biotypes were grown under 100% plant available water capacity (PAWC) until panicle initiation. At panicle initiation, very mild (80% PAWC), mild (60% PAWC), moderate (40% PAWC), and severe (20% PAWC) drought stresses were imposed on plants and continued through to maturity; an additional subset of plants were maintained at 100% PAWC through to maturity (control). Plants exposed to severe drought stress matured 24 days earlier than control plants, and produced 34% fewer filled seeds, with seeds having a 42% lower mass, 70% less dormancy, and shorter predicted longevity of at least 2 years compared to the seeds produced on control plants. All reproductive traits were less affected when the severity of the drought stress was decreased. The increasing frequency of drought stress in combination with the widely adopted practice of NTCA favours seeds of A. ludoviciana to undergo rapid germination in the following autumn/winter NGR planting season. However, effective control of A. ludoviciana remains a challenge in the NGR due to this weed’s genetic variability with respect to its response toward the seasonal variability of the NGR.
1. Introduction
Most crop production in the Northern Grains Region (NGR; comprising parts of Queensland and the whole of New South Wales) of Australia is conducted under dryland or rainfed conditions [1]. Farmers of the NGR usually fallow their land during the summer season to conserve soil water to grow crops through the drier winter months [2]. To maximise the conservation of soil water, farmers commonly adopt a no-tillage conservation agriculture (NTCA) approach. The NTCA approach is implemented in 90% of the cropped area of the NGR [3]. However, drought events, which are natural and periodically recurring features of the NGR environment, are growing in frequency and intensity due to climate change [4]. The combined effect of NTCA and climate change has contributed to the increased abundance of weeds [5,6], like wild oats (Avena spp.; the major winter weeds in the NGR), and the severity of their infestation within crops.
The impact of drought stress on plant survival can vary. However, both weeds and crops generally follow the same physiological mechanisms for survival against drought. When the amount of soil water is moderately or severely limited, the first response of plants is to reduce their transpirational water loss [7,8], which results in a decrease in photosynthesis [8,9,10]. Such stress responses disrupt carbohydrate metabolism, which ultimately reduces the export rate of assimilates from source (leaves) to sink (seeds) [11,12]. Conversely, water-stressed plants translocate relatively more assimilates to their roots to improve water uptake; however, due to a lack of photosynthesis, the absolute transfer rate to the roots is still less than under optimum conditions [13,14,15,16]. The reduced availability of assimilates to above-ground tissues under drought stress can therefore result in plants producing seed prematurely with low seed fill rates [17]. A drought stress event during the seed development stage may therefore reduce the time to plant maturity, seed production, and seed mass, which will have a negative impact on plant reproductive biology. However, the magnitude of these changes will largely depend on the severity of drought stress.
Reductions in soil water availability were reported to adversely affect aspects of vegetative growth and the seed production rate from wild oat (Avena fatua L.) plants [18]. On the other hand, drought stress during vegetative development is known to speed up the shedding of A. fatua seeds and produce seeds with reduced dormancy [19,20]. Such an effect of drought is even seen when drought stress occurs at the time of anthesis, with both timings of stress (either at the vegetative or reproductive phase) promoting mass seedling emergence at the beginning of the next cropping season [19,20,21]. However, the effect of drought stress on the most dominant wild oat species (A. sterilis (L.) ssp. ludoviciana (Durieu) Nyman; hereafter, A. ludoviciana) in the NGR is unknown. This information is important for the management of this weed under the present climate scenario, where the intensity and frequency of drought stress periods are increasing in the NGR [22], particularly during the late winter/early spring period when A. ludoviciana seeds are formed and undergo fill. In addition, earlier studies on A. fatua used only a single intense soil water stress treatment. Therefore, the existing knowledge of A. fatua is not comprehensive enough to predict the effect of a range of soil water stresses on A. ludoviciana’s survival mechanism(s). Moreover, aspects of the seed biology of these two Avena species are different, with the primary and secondary seeds of A. ludoviciana shedding together as a single unit, while in A. fatua, they shed individually. This variation in the seed shedding mechanism, coupled with the known differences in the dormancy behaviour of primary and secondary seeds, may impact upon the management strategy developed for these two species [23].
Our previous study [24] reported how elevated temperature affects the reproductive biology (plant maturity time and seed production, dormancy, and longevity) of four NGR A. ludoviciana biotypes. In the present study, we used the same biotypes to understand the impact of drought stress severity on A. ludoviciana reproductive biology. Our goals in this study were twofold: (1) to determine the differences in plant maturity time of A. ludoviciana biotypes when different levels of soil water stress were applied during their seed development; and (2) to determine seed production, mass, dormancy, and longevity in relation to the severity of the soil water stress treatment. This knowledge is critical for understanding the A. ludoviciana ecological response and persistence mechanisms within the NGR under the growing frequency and intensity of drought stress events. This knowledge will aid in the development of effective management strategies for this weed under a NTCA system.
2. Materials and Methods
2.1. Biotypes Used
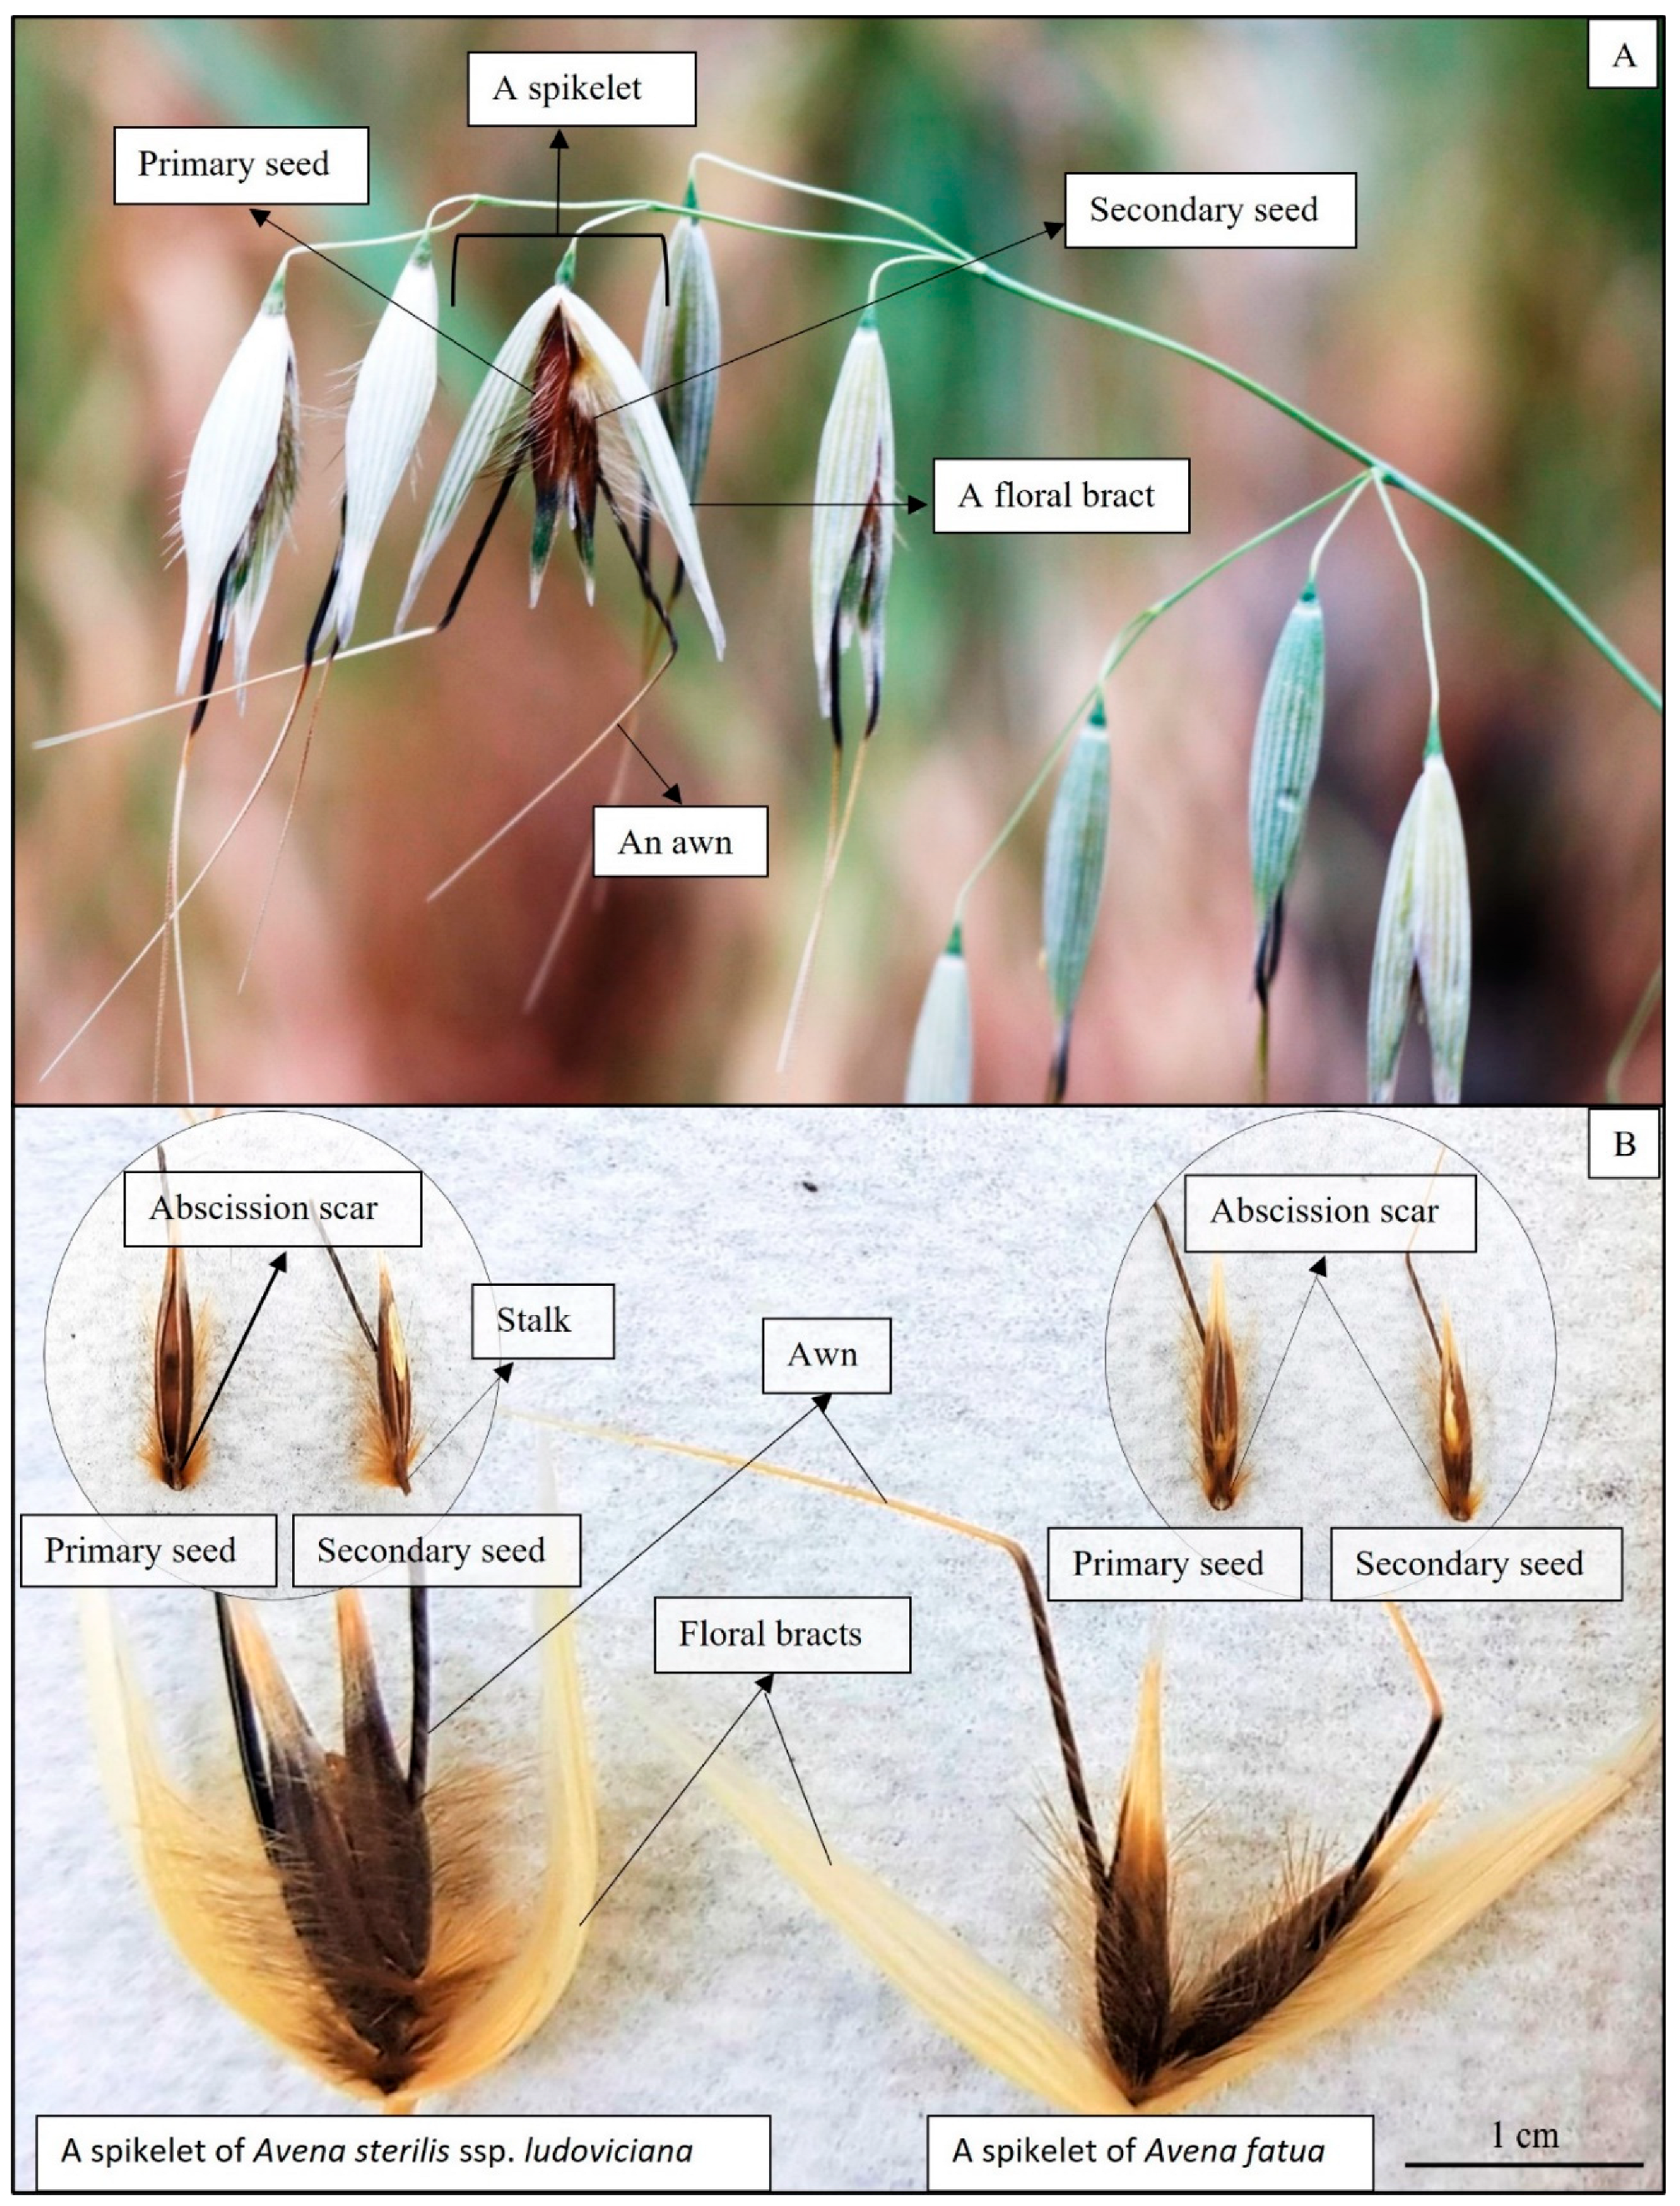
Avena ludoviciana spikelets were collected from four locations within the NGR, where wheat (Triticum aestivum L.) crops have been cultivated for >30 years following the NTCA approach. Among the sites selected, two were from northern locations: Biloela 1 (−24.3547, 150.4977) and Biloela 2 (−24.3504, 150.4977); and two were from southern locations: Toobeah (−28.3679, 149.5219) and Jandowae (−26.6672, 151.0246). During the seed development stage (August to October, 2015 to 2017), the biotypes grown in the northern and southern locations received an average rainfall of 34 and 47 mm, respectively (Table 1). The definition of spikelet, and primary and secondary seed/caryopsis, are described by Ali et al. [25]. In this present study, a seed of Avena spp. is defined as a caryopsis surrounded by a palea and a lemma. Generally, Avena spp. produces two types of seed (a larger one referred to as the primary seed, and a smaller one referred to as the secondary seed) in the same spikelet (Figure 1). From each site, spikelets were collected in November 2017 from A. ludoviciana plants at their senescence phenophase. Site sampling used a W-shaped transect. The sampling point started 10 m from the paddock edge and terminated at a depth of 50 m into the paddock. Along the transect, 1000 spikelets were collected, then air dried for 3 to 4 days at a shaded place, before being stored in paper bags at 15 ± 2 °C temperature and 15 ± 5% relative humidity (RH) under dark conditions. The spikelets were stored for 6 months before they were used in the first trial and for 18 months before being used in the second trial.
2.2. Experimental Design and Treatment Setup of Pot Trial
The experiment was conducted at The University of Queensland, Gatton campus (−27.5540, 152.3390), Australia. The pot trial was carried out in a completely randomised design, with six replications between June to October 2018 and again between the same months the following year. Before starting the experiment, the plant available water capacity (PAWC) of the black Vertosol soil (50% clay, pH 7.3; obtained from the UQ Gatton Research Farm) was determined using the pressure-plate extraction method [26]. From the seed lots, 100 spikelets were randomly taken from each biotype. The primary seed was then isolated from each spikelet and dehulled (removal of palea and lemma) to undergo germination in an incubator that was set at 15/5 °C, 47 ± 2% RH, and a photoperiod of 12/12 h light/dark. Subsequently, three healthy seedlings were transplanted into a 20 cm diameter × 19 cm height plastic pot that contained 4.5 kg of Vertosol soil. Each biotype received a total of 30 pots.
Plants were grown to maturity in a greenhouse under ambient conditions of 23/12 ± 2 °C thermoperiod under a natural day/night photoperiod, and 60 ± 5% RH, determined by TGP-4520 Tinytag Plus 2 logger (Gemini Data Loggers Ltd., Chichester, UK). The soil water content of the pots was maintained at a gravimetric 100% PAWC until panicle initiation (for Biloela 1 and Biloela 2, the panicle emergence took place 58 days after planting; for Toobeah it was 63 days; and for Jandowae it was 65 days). At this time, the various soil water stress treatments (Table 2; six pots were used per biotype per treatment) were imposed and continued until harvest. After panicle initiation, it took approximately 4, 3, 2, and 1 days for 20, 40, 60, and 80% PAWC treatments, respectively, to dry down to their target soil water levels. The soil water content of the pot was determined by weighing each pot every 2 days. To account for the weight of the growing plants, extra plants were grown under each treatment and sacrificed at panicle initiation, and thereafter at 10-day intervals until maturity, to determine an above-ground plant weight. The soil water content of the pots was maintained according to the weight of the pot and considering the weight of the plant.
2.3. Data Collection and Spikelet Storage
The time to physiological maturity was recorded for all plants of each biotype. Physiological maturity was defined as the time when 50% of the spikelets on each plant were at the point of shedding. Physiologically mature spikelets were collected manually from each plant and their number was counted. The collected spikelets were then stored as described above (Section 2.1). The total number of filled or empty, primary or secondary seeds per plant, as well as the 1000 primary or secondary seed weight, was determined by the methods previously described by Ali et al. [25].
2.4. Dormancy Tests
Two germination studies were undertaken simultaneously 25 days after the first lot of spikelet collection to determine the dormancy status of the filled primary and secondary seeds and caryopses. For study one, a thermogradient bar (T-bar; Lindner and May Industries, Brisbane, Australia) was used to determine the degree of hull (palea and lemma)-imposed dormancy present in the fresh seeds, whereas the second study was conducted in an incubator (TRIL-750 Illuminated Refrigerator Incubator, Thermoline, Wetherill Park, Australia) to determine the degree of embryo dormancy present in the fresh caryopses. For both studies, spikelets were randomly collected from the seed lots, primary and secondary seeds were separated, and hull removal was performed manually to obtain the caryopses. Surface sterilisation of seeds and caryopses, and the setting up of germination studies, was previously described by Ali et al. [25].
Dormancy test of seeds in the T-bar: Three replicates of seeds (per soil water stress treatment) were used for this test. Each replicate contained 20 primary or secondary seeds. Seeds were imbibed under a constant temperature of 4, 6, 9, 12, or 15 ± 1 °C using a 12/12 h light/dark photoperiod. An overhead cool white, fluorescent light was used to produce the daytime photosynthetic photon flux density of approximately 100 μmol m−2 s−1 to illuminate the Petri dishes. Seed germination was counted at 2-day intervals for a total of 42 days. Seed germination was defined as the protrusion of the coleorhiza through the husk, and caryopsis germination was defined as the protrusion of the coleorhiza through the pericarp. After each counting session, any germinated seeds were removed from the Petri dishes. At the end of the 42-day study, all non-germinated seeds were tested for viability [25]. Any seeds that germinated in this test were considered to have been dormant. From both years of study, all seeds were found to be viable.
Dormancy test of caryopses in the germination incubator: All experimental procedures for this test were similar as described above, except caryopses (that came from 20, 60, and 100% PAWC treatments) were used instead of seeds. At the end of this study, all caryopses used were found to be viable in both years.
2.5. Seed Longevity Determined by Controlled Ageing Test
A laboratory-based controlled ageing test (CAT) was conducted to determine the potential seedbank longevity of primary and secondary seeds coming from 20, 60, and 100% PAWC treatments. For this purpose, 12 replicates (Petri dishes) of 20 primary and 20 secondary caryopses coming from 20, 60, and 100% PAWC treatments of all four biotypes were used in both years. The CAT was conducted according to the method described by Long et al. [27] but with the following modifications: (a) 20 primary or secondary fresh caryopses were placed into each glass vial; (b) instead of an oven, an incubator (Model: Polar 1000, Contherm Scientific Ltd., Hutt City, New Zealand) was used for the pre-equilibrium phase (7 ± 2 °C and 47 ± 2% RH for 21 days), as well as for the ageing phase (48 ± 2 °C and 60 ± 3% RH); (c) caryopses were kept in darkness in both phases; (d) Tinytag Plus 2 data loggers were used to monitor temperature and RH conditions inside the sealed boxes; and (e) during the ageing phase, glass vials were removed at 0, 5, 16, 30 39, 55, 70, 85, 100, and 118 days to examine their viability by incubating caryopses for 21 days under 15/5 ± 1 °C, light/dark (12/12 h) photoperiod, and with an addition of 10 μM of gibberellic acid (GA3; Sigma-Aldrich Pty. Ltd., Macquarie Park, NSW, Australia) at a rate of 5 mL per Petri dish to overcome dormancy issues. The germinated caryopses were counted as viable and non-germinated caryopses were considered dead. The number of viable caryopses was plotted against time to determine their P50 value (predicted time for seed lot viability to fall to 50%).
2.6. Thermal Time Calculation
To understand the impact of drought stress on plant maturation, thermal time (degree-days) was calculated using the following equation [28]:
Thermal time (degree-days) = [(Maximum temperature + Minimum temperature)/2] – Base temperature
The base temperature was set as 0 °C [29]. Thermal time calculations began when the germinated seedlings were transplanted to the pots and continued until maturity. Thermal time data calculation considered the greenhouse temperature data. The experiment ran for 2 years and therefore thermal time was calculated for 2 years, and their average was determined to interpret experimental results.
2.7. Statistical Analysis
Pot trial: The data from the two repeats of the pot trial were pooled before analysis as the effect of the repeat trial was non-significant (p ≥ 0.05; Table S1) for all parameters measured. An analysis of variance (ANOVA) was performed to examine the responses to the soil water stress treatments using Minitab software version 18. Mean values of the different parameters were separated using Fisher’s protected least significant difference (LSD) test at p ≤ 0.05. The relationship between % PAWC and the time to plant maturity, as well as seed weight and time of plant maturation, were determined by fitting a linear regression model using SigmaPlot software version 14. The coefficient of determination (R2) value was used to determine the goodness of fit of the linear regression model.
Dormancy tests: The data from the two repeats of the T-bar or germination incubator tests were pooled before analysis as the effect of the repeat experiment was non-significant (p ≥ 0.05; Tables S2 and S3) for both tests. For the T-bar test, the data were analysed against an individual germination temperature either for the primary or secondary seeds. Data for both tests (T-bar and germination incubator) were expressed as cumulative germination percentages. Data were analysed using ANOVA performed on Minitab software. Means were separated using Fisher’s protected LSD test at p ≤ 0.05.
Seed longevity tests: The average data from the two repeats of this study were pooled as the effect of the repeat experiment was non-significant (p ≥ 0.05; Table S4). Caryopsis viability (expressed as a percentage of germination) was plotted against time (days) in ageing conditions. A non-linear regression analysis was carried out using SigmaPlot to estimate the P50 value through fitting sigmoid, three-parameter curves to the data using the following equation [24,27]:
where a is the fitted initial viability (percentage), b is the rate of viability loss in the rapidly declining section of the curve, x is the accumulated time in the CAT (in days), and x0 is the P50 value.
3. Results
3.1. Time to Plant Maturity
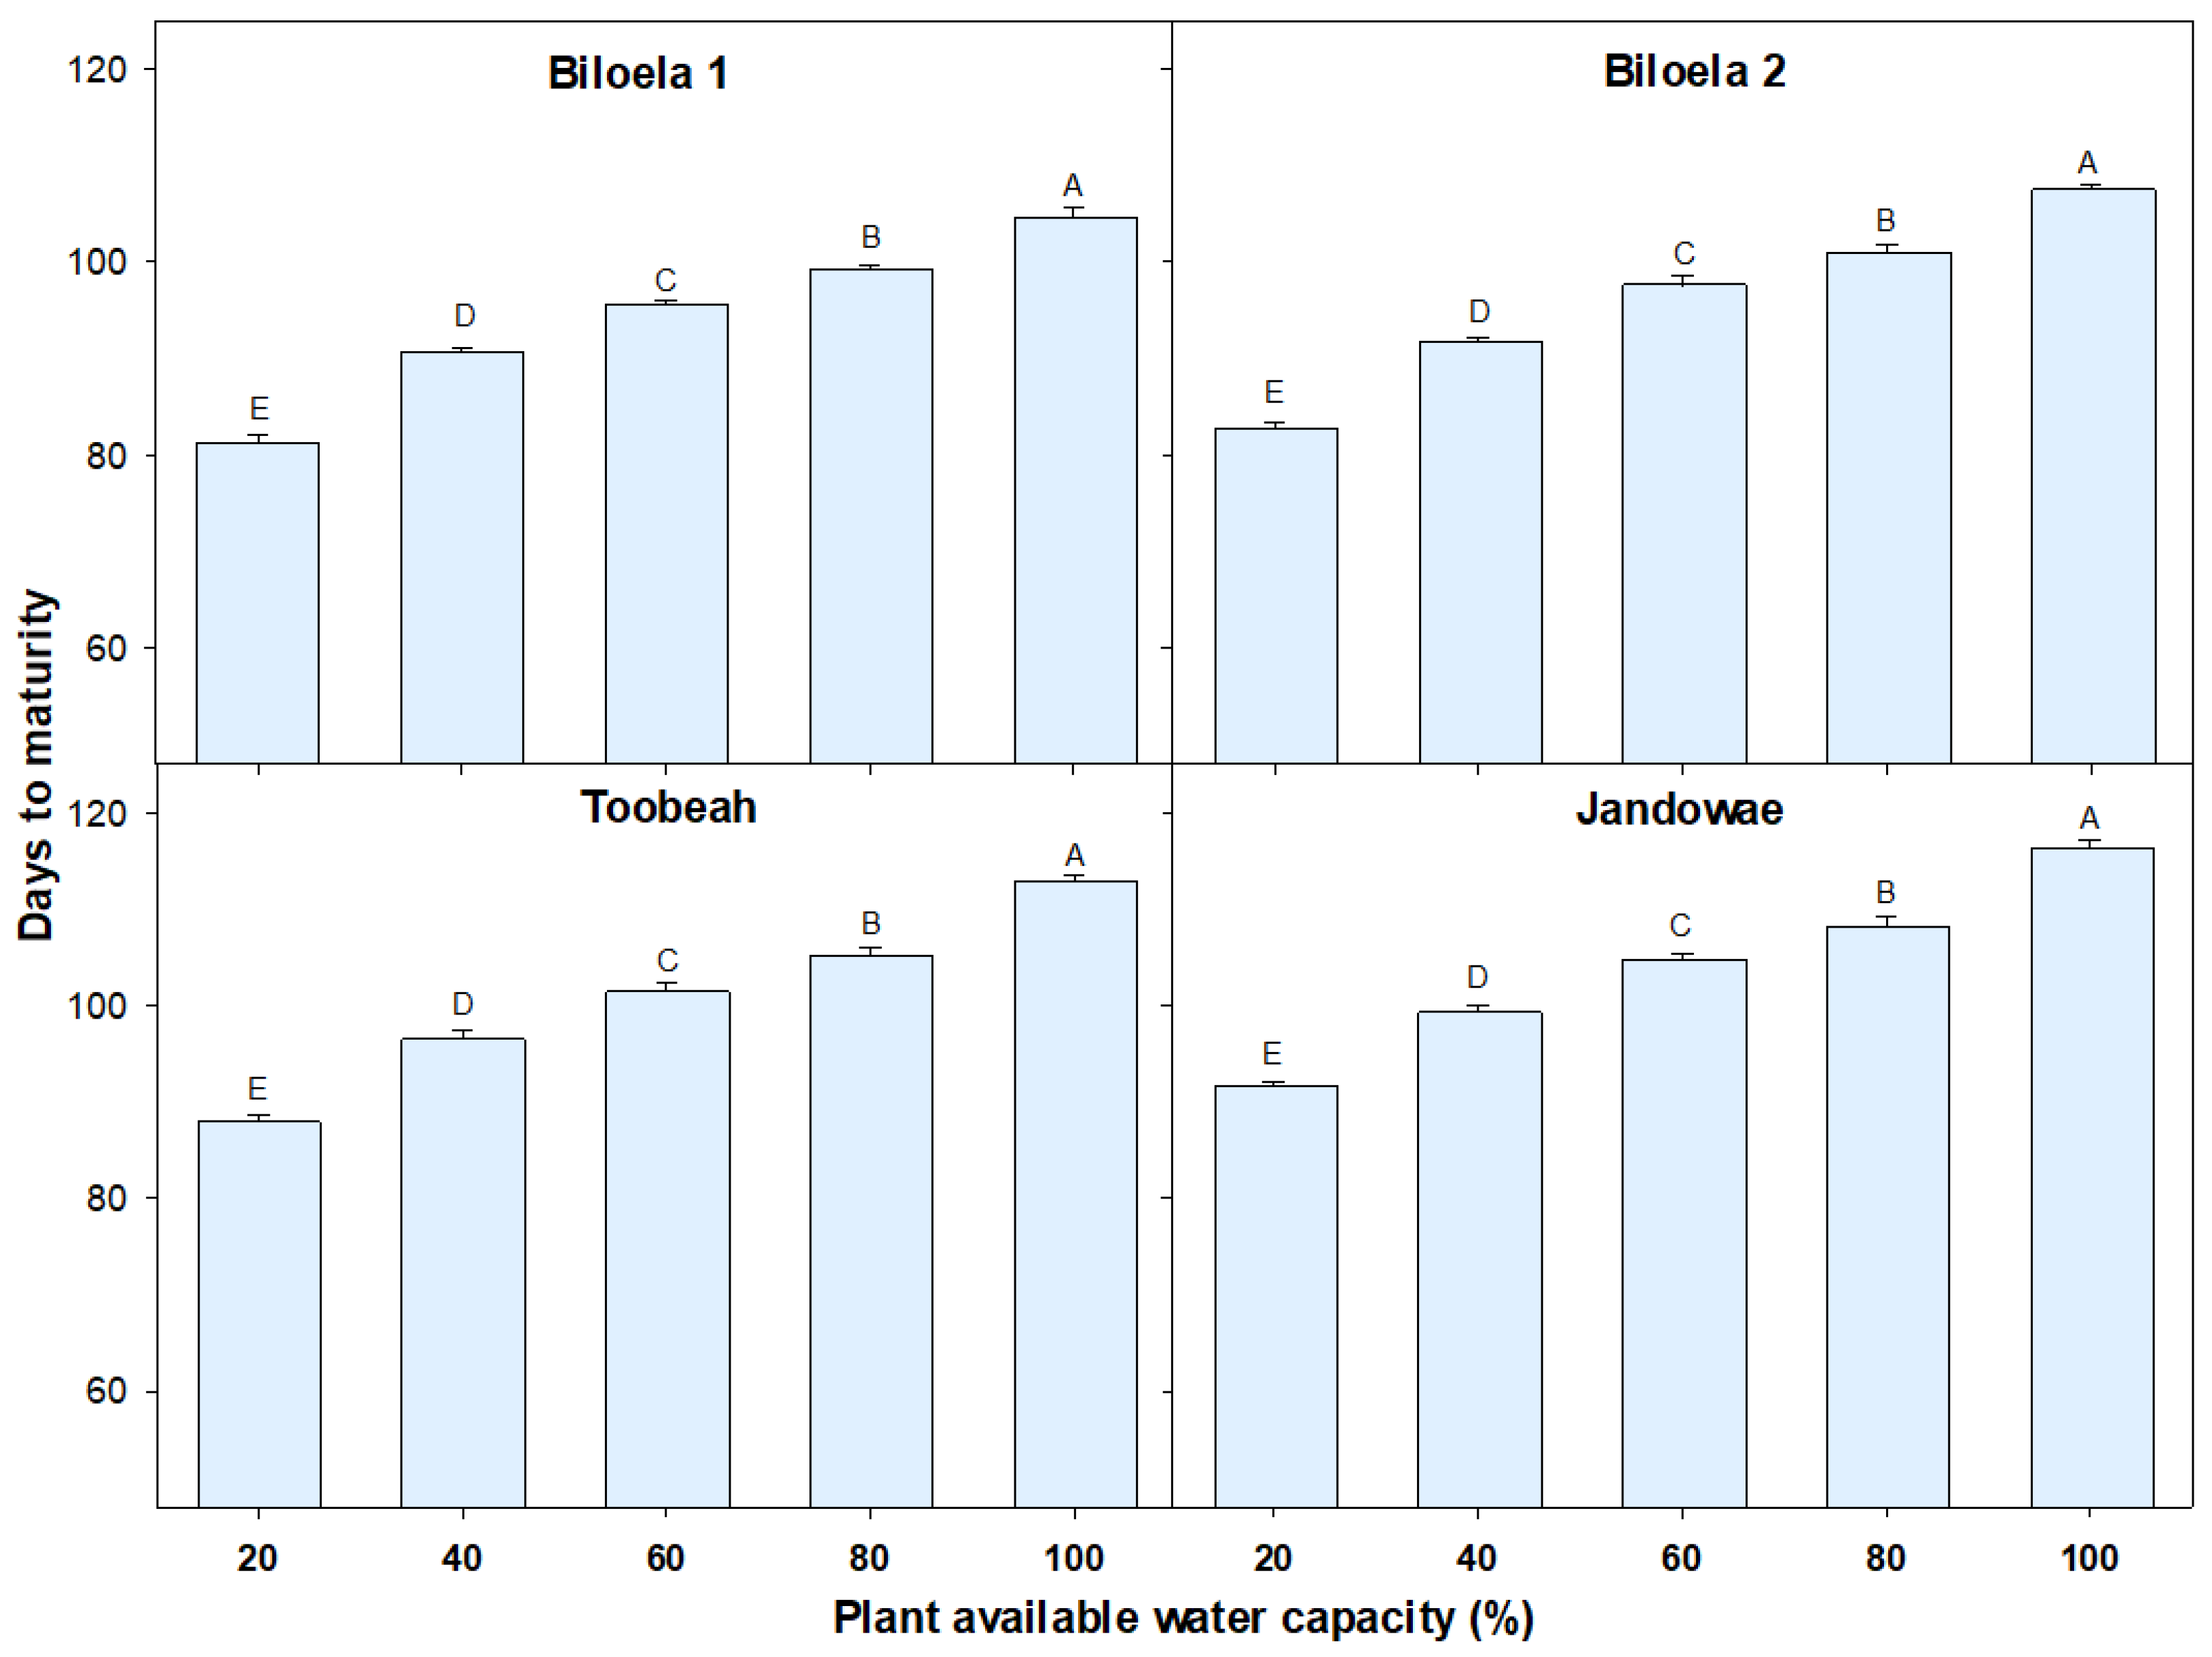
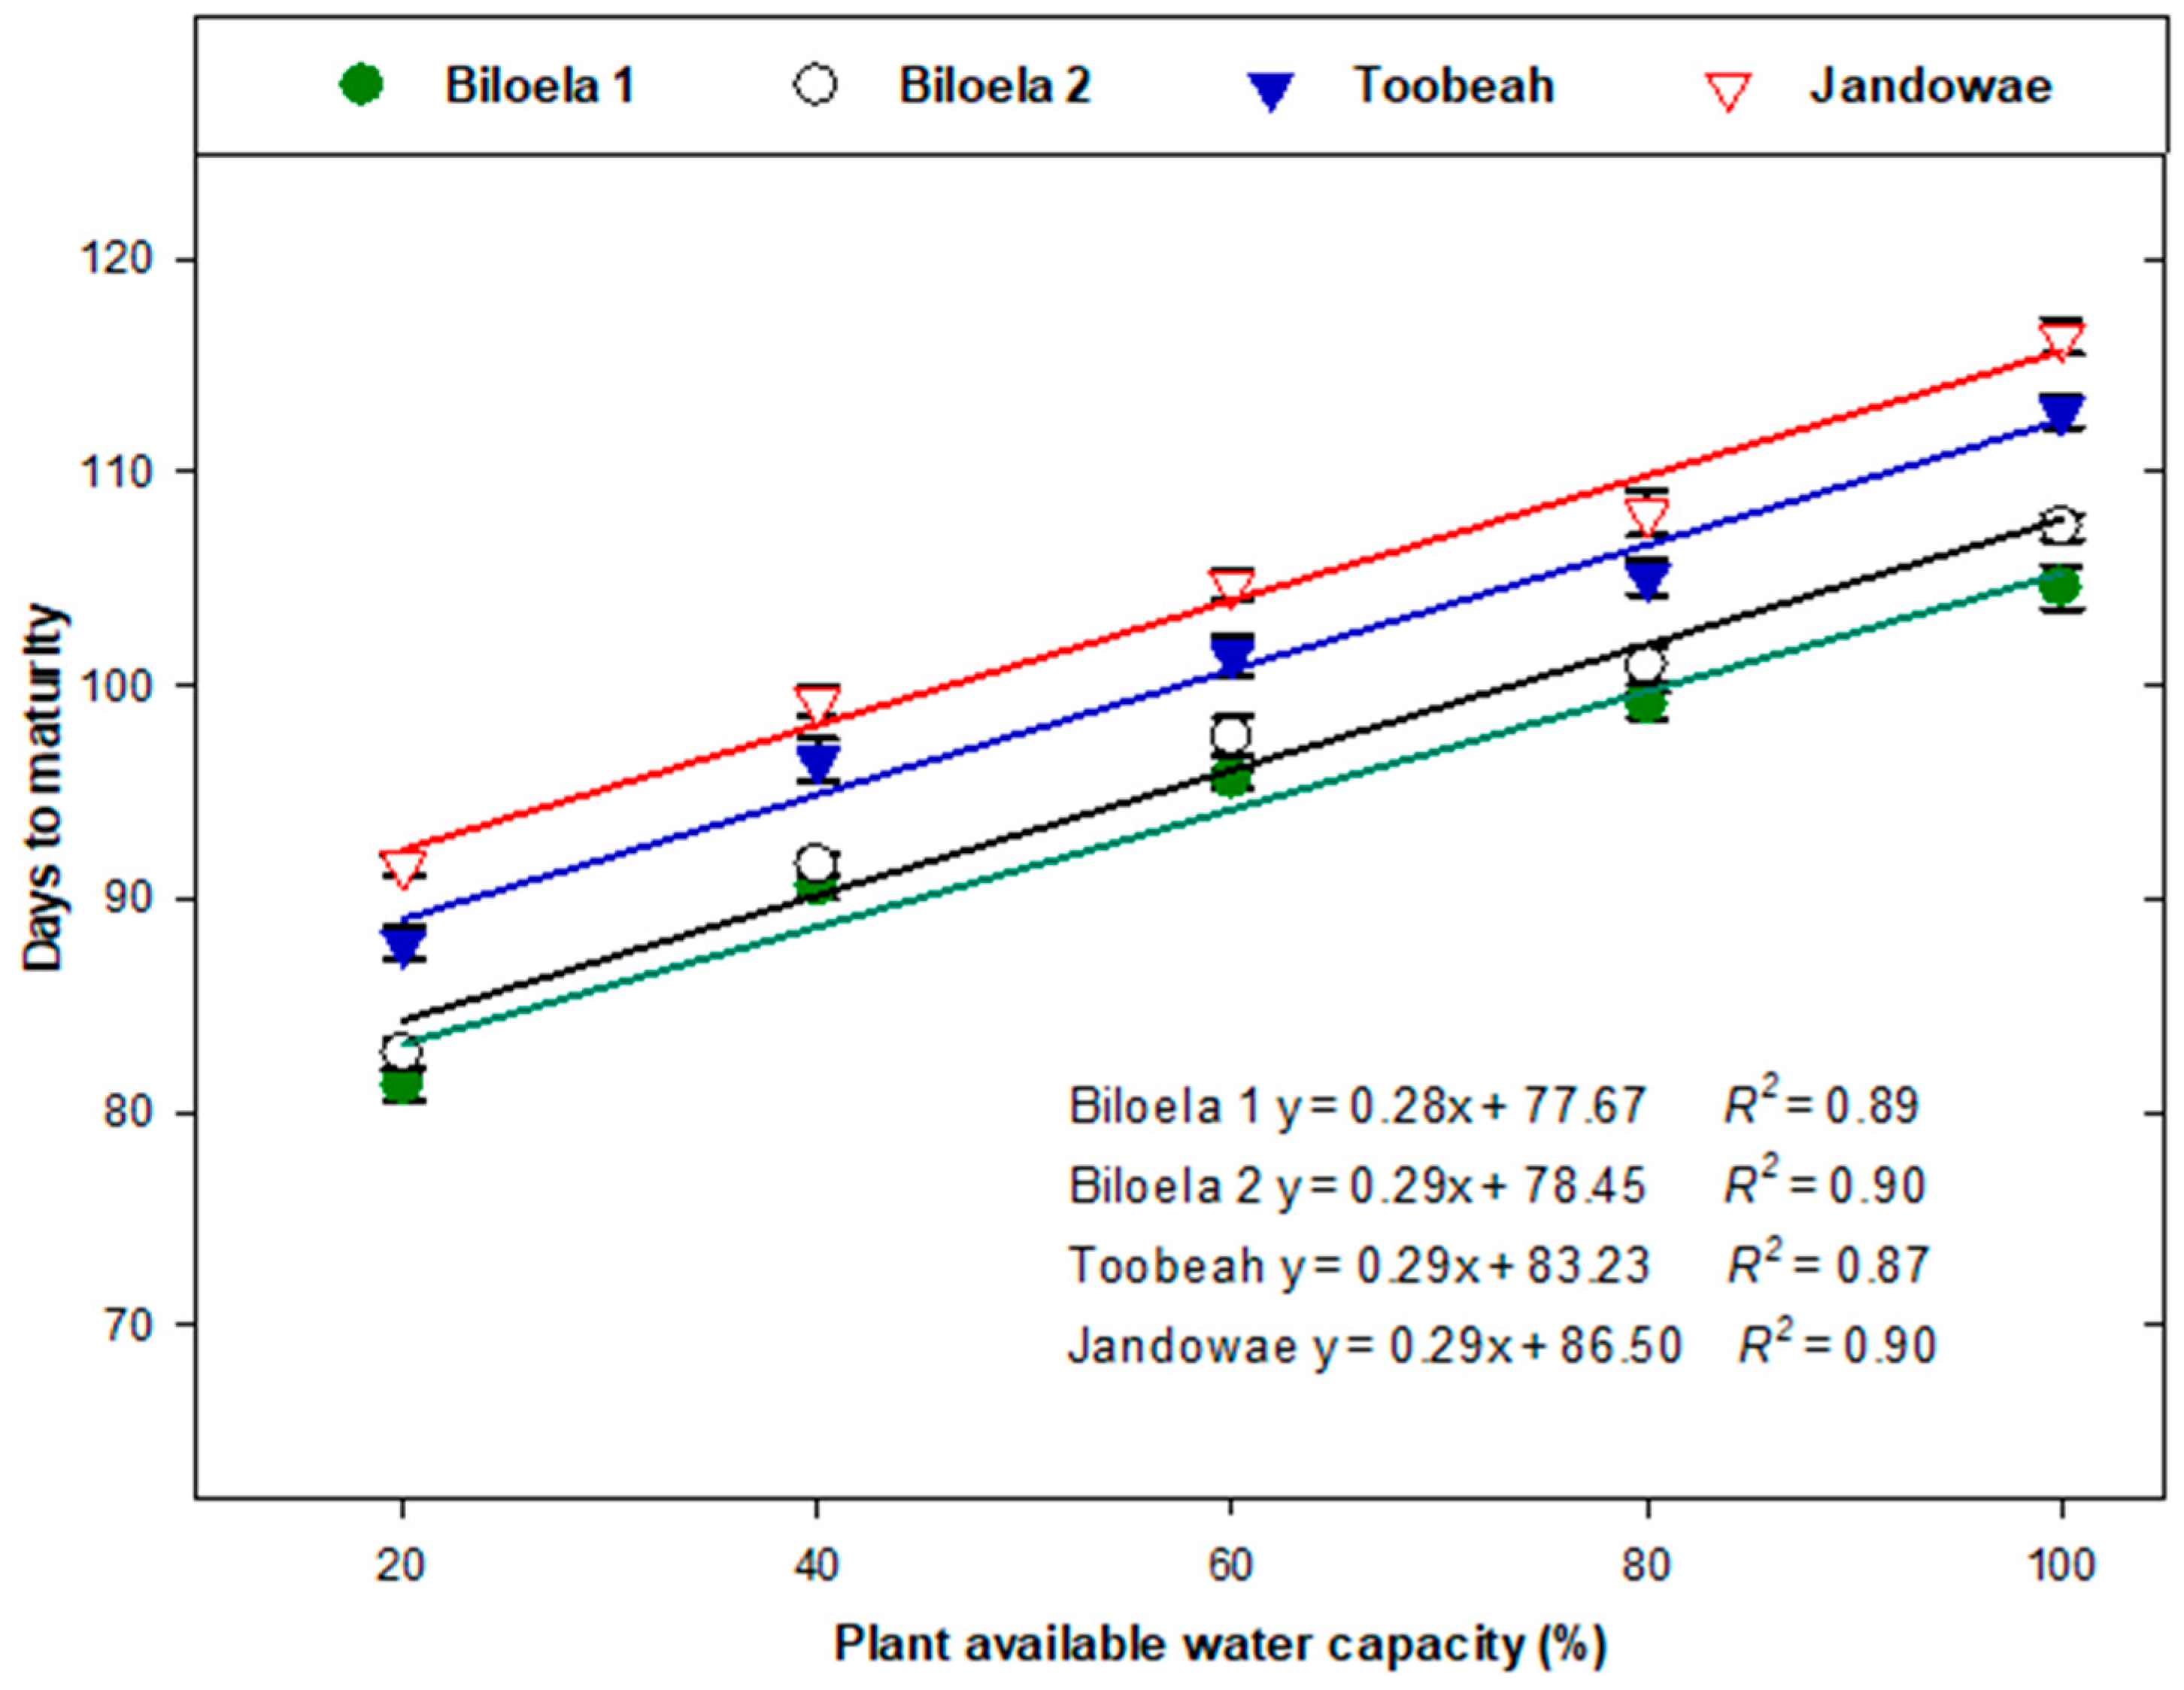
Soil water stress treatments had a significant impact in reducing plant maturity time in all biotypes (p < 0.001; Figure 2, Figure 3 and Figure 4). Overall, northern biotypes (Biloela 1 and 2) matured 5 to 9 days earlier than southern biotypes (Toobeah and Jandowae; Figure 2). Irrespective of soil water stress treatments applied, the Jandowae biotype took the longest time to mature (104 days), while Biloela 1 took the shortest time to mature (94 days). The mean plant maturity time under the severe drought stress was 86 days, 24 days earlier compared to the unstressed control plants which matured in 110 days (Figure 2). Plant maturity was accelerated in all biotypes when the severity of the soil water stress was increased (Figure 2, Figure 3 and Figure 4). There was a positive correlation observed between plant maturity time and % PAWC (Figure 3). The plant maturity time of all biotypes was greatly reduced with the increment of the severity of drought stress (Figure 3).
3.2. Seeds Produced
The interaction effect between biotypes and soil water stress treatments was found to significantly impact the number of filled (p < 0.001) and empty (p = 0.002 and 0.010, respectively), primary and secondary seeds produced (Figure 5). Within a biotype, a plant that produced the lowest number of filled primary or secondary seeds also produced the highest number of empty primary or secondary seeds (Figure 5). A plant grown under severe drought stress produced 34% less filled, but three-and-a-half-fold empty seeds compared to control plants (i.e., 100% PAWC). When the severity of soil water stress was reduced, the number of filled seeds produced increased while empty seed production decreased (Figure 5). The filled secondary seed production rate of all biotypes was always found to be lower, and the empty secondary seed production rate was always found to be higher, than their primary seed production (Figure 5).
3.3. The 1000 Primary and Secondary Seed Weight
A significant two-way interaction between the biotypes and soil water stress treatments was found in reducing the seed mass of both types of seed (p < 0.001). Among biotypes, the seed mass of Biloela 1 was affected the most under the severe drought stress treatment. The mass of both types of seed of this biotype was reduced by more than 50% under the 20% PAWC compared to its control (Figure 6). On the other hand, Jandowae produced larger-sized primary and secondary seeds in the control (Figure 6). However, the seed mass of this biotype was reduced by 34% under the 20% PAWC treatment compared to its control. A positive effect was also observed between the plant’s maturity time and the mass of both types of seed (Figure 7). The seed weight of all biotypes was reduced as the time to plant maturity was reduced with the severity of soil water stress increased (Figure 7). The seed mass of all biotypes was less affected when the plants were grown under their optimum conditions (Figure 7).
3.4. Dormancy Test of Seeds in the T-Bar
The ANOVA test showed that constant incubation temperatures of 6 °C (p = 0.005), 9 °C (p = 0.003), and 15 °C (p = 0.018) significantly increased the germination of primary seeds from all four biotypes produced under soil water stress treatments (Figure 8). The optimum germination temperature for the southerly originated biotypes was 6 °C whereas it was 9 °C for the northern biotypes (Figure 8). Primary seeds of Biloela 1, Toobeah, and Jandowae biotypes, produced under severe drought stress, expressed little dormancy (80% germinated) when incubated at their optimal germination temperature. On the contrary, only 10% of the primary seeds of those biotypes were able to germinate at the same incubation temperature when plants were grown under the control environment (Figure 8). However, Biloela 2 consistently showed a strong hull-imposed dormancy at any given temperature. The germination rate or the dormancy status of the primary seeds produced under other soil water stress treatments were almost similar for the northern and southern biotypes at their optimal incubation temperature (Figure 8). The dormancy trend of secondary seeds was found to be similar to that of their primary seeds (Figure 8). Nevertheless, the dormancy rate of secondary seeds produced under severe drought stress was always 15 to 20% higher than their primary seeds under their optimum incubation temperature, which was seen in all biotypes except Biloela 2 (Figure 8).
3.5. Dormancy Test of Caryopses in the Germination Incubator
When seeds were dehulled and placed under an optimum incubation temperature, soil water stress treatments were found to have a significant role (p < 0.001) in breaking the dormancy of both primary and secondary caryopses (Figure 9). Overall, the germination rate was very high when seeds were produced under severe drought stress, their hull removed, and they were incubated under their optimum day/night temperature of 15/5 °C (Figure 9). More than 90% of primary caryopses coming from the 20% PAWC environment were able to germinate, whereas 75% germinated in the case of secondary caryopses (Figure 9). However, the caryopses’ germination rate was decreased, and the dormancy rate was increased, when the plants were grown under a 60% or above PAWC treatment. The dormancy rate of the caryopses varied depending on their growing environment, as well as the types of seed present (Figure 9).
3.6. Seed Longevity Determined by CAT
Primary and secondary seeds of all biotypes produced under severe drought stress lost their viability earlier compared to seeds produced under mild or no water stress (Figure 10 and Table 3). The seed lots produced under severe drought stress lost 50% of their viability (P50) within 30 to 60 days in the CAT—almost half the time earlier than seeds produced under no water stress (75 to 100 days; Figure 10 and Table 3 and Table 4). The biotype Biloela 1 was ranked first, followed by Jandowae, Toobeah, and Biloela 2, based on rapidly dropping to 50% viability of seeds produced by either 20 or 60% PAWC. At the end of the 120-day study, 3 to 5% of the primary seeds of Biloela 2 and Jandowae biotypes and 5 to 15% of the secondary seeds of Biloela 2, Toobeah, and Jandowae biotypes produced under the control environment were still found to be viable (Figure 10).
The seeds produced under severe drought stress were classified as transient-to-short-lived seed types that had a predicted longevity of 1 to 2 years in the soil seedbank (Table 3). Mild drought stress was responsible for the production of medium-lived seed types that had a predicted longevity of >2 to 4 years. Seeds produced under the control environment were predicted to have >4 years of longevity in the soil seedbank.
4. Discussion
In the present study, we aimed to determine how A. ludoviciana’s reproductive biology could be modified in response to the intensity of drought stress. In particular, we focused on plant maturity time, and seed production, dormancy, and longevity of four NGR A. ludoviciana biotypes over 2 consecutive years. From this study, it was observed that severe drought stress during the seed development stage (i.e., late winter to early spring season) forced A. ludoviciana plants to mature 24 days earlier than would have occurred under a moist soil environment (Figure 2, Figure 3 and Figure 4). This reduction in plant maturity time reduced the seed production rate by 35% (Figure 5) and seed mass by 40% (Figure 6 and Figure 7) relative to control plants. However, the reduction in plant maturity time modified one of its important seed biology traits, i.e., dormancy. Those early-matured seeds were found to have less dormancy, but only when they were exposed to cool imbibition temperatures (6 to 9 °C; Figure 8). This result suggests that seeds produced under a severe-to-mild drought stress period will be ready to germinate in the following winter cropping season when they meet their optimum germination requirement. The CAT test (Figure 10 and Table 4) indicated that the less-dormant seeds produced from the early maturing plants had a reduced ability to remain viable in the soil seedbank for long periods of time. However, it was also observed that the phenology and seed biology of A. ludoviciana varied due to the genetic diversity present between the two types of seed, and among biotypes, which will also have an impact on the species ecology in the cropping environment. The modification in plant maturity and seed biology of A. ludoviciana under the changing climate therefore remains a challenge for the management of this weed under the NTCA approach practices in the NGR.
4.1. Phenology
Plants grown under a severe drought stress (i.e., 20% PAWC) matured approximately 24 days earlier than control plants (Figure 2 and Figure 3). Plant maturity was reduced to 16, 10, and 7 days under 40, 60, and 80% PAWC treatments, respectively. Previous studies [18,30] reported that water stress can accelerate the life cycle of A. fatua plants by reducing the required thermal time for them to complete their life cycle. In our study, plants grown under severe drought stress required approximately 400 degree-days less thermal time for their maturation compared to control plants (Table 5). Our previous study with elevated temperature observed similar results, with an 18-day reduction in plant maturity time occurring when plants were grown under an elevated temperature stress during their reproductive phase [24]. Both results indicate that elevated temperature or drought stress applied individually can significantly reduce the thermal time requirement of this weed to mature than plants grown under no stress. The faster but lower accumulation of thermal time under different levels of drought stress influenced the period of maturity and reproductive biology of this weed, as was observed under elevated temperature stress [24]. Moreover, under drought conditions, stomatal activity is regulated in part by chemical signals (e.g., by abscisic acid synthesis) produced by dehydrating roots [10,31]. By closing the stomates, this leads to a decreased rate of leaf expansion, impaired photosynthetic activity, and premature leaf senescence, all of which ultimately reduce photosynthate production [32]. All of these changes can lead to a shortening of plant maturity time.
In this study, we found that a variation in the maturity time was also evident among the northerly and southerly originated biotypes under the various drought stress treatments. This occurred mainly due to the inherent earlier maturation of northern biotypes (5 to 9 days earlier) compared to their southern counterparts (Figure 2 and Figure 3). It must be noted that the northern biotypes originated from a drier part of the NGR compared to the southern biotypes (Table 1), and therefore they appear to have become adapted to mature faster under the drier conditions (Figure 2 and Figure 3). Peters [33] reported that the phenology of A. fatua differed due to its biotype difference and the response of biotypes towards drought stress. Clearly, heritability and environment have a great impact on the phenology of A. ludoviciana. It is, therefore, understandable that mild-to-moderate drought stress that usually prevails in the NGR at the time of seed development can force A. ludoviciana plants to mature earlier than expected. However, a crop plant can also mature faster under a drier environment [34], but the rate of maturation between crop and weed may differ, which growers need to keep in mind while adjusting their weed management tactics.
4.2. Reproductive Biology
The effect of different soil water stress treatments reduced the number of filled seeds produced (35% less under severe drought stress than the control) but also increased the production of empty seeds (65% more under severe drought stress than the control; Figure 5). In addition, the filled seeds produced under different soil water stress treatments were smaller in mass (40% less under severe drought stress compared to the control; Figure 6), and the mass reduction rate was dependent on the maturity time, which changed in response to the severity of drought stress (Figure 7). A similar observation was made in our previous study, where elevated temperature at the reproductive phase resulted in the production of 30% less filled seeds and 70% more empty seeds, with a 37% reduction in seed mass compared to the control [24]. Samarah [35] observed an approximately 60% reduction in the grain yield of barley (Hordieum vulgare L.) under drought conditions, mainly due to a lower number of grains along with a lower grain weight. The negative impacts of drought on seed production mainly depend upon the severity of the stress [36]. Yadav et al. [37] reported that the exposure of pearl millet (Pennisetum glaucum L.) plants to drought stress at flowering lowered the number of filled seed production and increased empty seed production due to the disturbed assimilate movement to the developing ear. Soil water stress during the anthesis-to-maturity phase of A. ludoviciana resulted in some seeds being empty (Figure 5), and some seeds being smaller in mass (Figure 6), which had an effect in modifying their reproductive biology.
4.3. Dormancy Status
Seeds produced under reduced soil water were found to readily germinate at their optimum germination temperature between 6 to 9 °C (Figure 8). Similar results were found in the case of elevated temperature [24], which means that plants grown under drought stress or elevated temperature stress can produce seeds with reduced dormancy. Previous studies also reported that drought stress can produce A. fatua seeds that have less biomass allocated to them, which enables the seeds to overcome dormancy in a shorter time [19,20,21]. Drought stress hastened plants to mature seeds quicker, which is correlated with a reduction of starch and ABA but more a-amylase content leading to the production of less-dormant seeds than an unstressed plant [19,20,38,39,40]. In contrast, adequate soil water during seed maturation can help to express the alleles responsible for long-term dormancy [20]. When the hull of the seeds was removed, more seedlings of A. ludoviciana were found to germinate (Figure 9). This result indicated that when the hull is naturally lost in the soil, more seeds of A. ludoviciana can germinate and infest the crop [25]. Under the variable climate scenario in the NGR, it is thus possible that a year of adequate rainfall at the time of seed development can help A. ludoviciana plants to produce more seeds with a high rate of dormancy, whereas drought conditions will produce fewer but less-dormant seeds. Both types of seeds will return to the soil seedbank, where the less-dormant seeds will be ready to germinate in the following season under a NTCA system with minimal soil disturbance. However, dormant seeds will contribute to the persistence of soil seedbank.
Seed dormancy is an important element in the survival of Avena spp. [19]. Even seeds produced from a single plant of Avena spp. may vary in their dormancy level [41,42]. Peters [43] determined that secondary seeds of A. fatua had a greater dormancy than primary seeds. This is consistent with our study, which showed that at any given incubation temperature, the germination percentage of secondary seeds/caryopses was always lower (5 to 20% less) than that of their primary seeds/caryopses (Figure 8 and Figure 9). The difference between the primary and secondary seeds may result from their genotype, as well as the response of seeds towards the changed environment, where soil water stress may have a greater impact on producing premature primary seeds with fewer defence mechanisms than the secondary seeds [21,23]. Previous studies reported that the seed dormancy of A. fatua is controlled by an interaction of both genetic and environmental factors [44,45]. Moreover, the seed dormancy of the biotypes differed due to the requirement of their specific incubation temperature (Figure 8), whereas northern biotypes preferred 9 ℃ and southern biotypes 6 ℃. This result confirms the work performed by Quail and Carter [23], Fernández-Quintanilla et al. [46], and Uremis and Uygur [47].
4.4. Longevity Status
The eradication of weeds always becomes more difficult when they produce a large number of viable seeds and can develop a persistent seedbank [48]. In the case of A. ludoviciana, these two traits enable the weed to stagger its germination from a season to a few years, perpetuating it as a difficult-to-control weed under the prevailing NTCA system. However, the lower amounts of starch in seeds produced from water-stressed plants [19] can affect the longevity of seeds in the soil environment [48], which was observed in the present study (Figure 10 and Table 4). Caryopses coming from severe drought stress lost their viability far quicker than caryopses coming from the control (Figure 10), and those caryopses had a predicted longevity of at least 2 years less in the soil seedbank (Table 4). A similar result was observed by Ali et al. [24] in the case of elevated temperature stress. However, in the field, the longevity of seeds (especially those retaining on or near the soil surface) depends on many factors, including soil type, burial depth, fluctuating temperature, soil water condition, and hydration cycle [49,50,51], as well as the types of seeds coming from different biotypes. Additionally, seeds might persist longer in regions with low rainfall and moderate temperatures than in climates with heavy rainfall and considerable temperature variability [52]. clay type soil and the drier environment of the NGR may further help Avena spp. seeds to survive in the soil longer compared to sandy type and relatively wet soil [53]. Seedbank longevity of A. ludoviciana under NTCA therefore largely depends on its reproductive biology and the climate.
5. Conclusions
The current study shows that the imposition of a severe-to-mild drought stress during the time of seed development of A. ludoviciana can lead to maturation and the production of seeds more rapidly, but with a penalty in their seed number and mass. There was also a strong relationship observed between the severity of the soil water stress and the degree of modification of the reproductive traits of this weed. An incubation temperature of 10 °C was found to germinate the maximum number of seeds, implying that a large flush of seedlings may be ready to infest the next winter crops from the time the crop is planted. When the seeds are unable to germinate due to a lack of a germination requirement, they will most likely die as the CAT suggested their longevity has been compromised by the water stress treatments. However, under the variable changing climate scenario, a year of cool and wet environments can lead to the production of more filled seeds with greater dormancy. In addition, the genetic variability between the two types of seed produced by A. ludoviciana provides further variation in the seedbank. The non-burial conditions of NTCA favour the development of a seedbank, with less-dormant seeds readily available to germinate and re-infest crops, while more-dormant seeds contribute to the persistence of the seedbank. The complex relationship between biology, ecology, and edaphic and climatic factors makes the management of A. ludoviciana difficult under NTCA.
Supplementary Materials
The following supporting information is available online at https://doi.org/10.48610/45b2aa3. Table S1: Analysis of variance for observing the year effect on different variables of four A. ludoviciana biotypes produced under different soil water stress treatments; Table S2: Analysis of variance for observing the year effect on primary and secondary seed dormancy of four A. ludoviciana biotypes produced under different soil water stress treatments; Table S3: Analysis of variance for observing the year effect on primary and secondary caryopsis dormancy of four A. ludoviciana biotypes produced under different soil water stress treatments; Table S4: Analysis of variance for observing the year effect on primary and secondary seed longevity (CAT) of four A. ludoviciana biotypes produced under different soil water stress treatments.
Author Contributions
Conceptualization, M.A. and S.A.; experiment design, M.A. and S.A.; data acquisition, M.A.; data analysis, M.A. and M.A.H.; data interpretation, M.A. and M.A.H.; writing—original draft preparation, M.A., A.W., M.W., M.A.H. and S.A.; writing—review and editing, M.A., A.W., M.W., M.A.H. and S.A. All authors have read and agreed to the published version of the manuscript.
Funding
This research was funded by the Grains Research and Development Corporation (GRDC; project ID 9175899).
Data Availability Statement
The data presented in this study are openly available at https://doi.org/10.48610/45b2aa3.
Acknowledgments
The authors would like to thank the grain growers of Australia and the GRDC for their significant contributions to undertaking the PhD research. The authors are also grateful to Bernhard Wehr, of the University of Queensland, for his help in determining the plant available water capacity of the soil using the pressure-plate extraction method.
Conflicts of Interest
The authors declare no conflict of interest.
References
- Anderson, W.K.; Stephens, D.; Siddique, K.H.M. Dryland Agriculture in Australia: Experiences and Innovations. In Innovations in Dryland Agriculture; Farooq, M., Siddique, K.H.M., Eds.; Springer International Publishing: Cham, Switzerland, 2016; pp. 299–320. [Google Scholar]
- GRDC (Grains Research and Development Corporation). Wheat Grow Notes. 2016. Available online: https://grdc.com.au/__data/assets/pdf_file/0033/364875/grdc-grownotes-wheat-southern.pdf (accessed on 8 April 2019).
- Llewellyn, R.; Ouzman, J. Conservation agriculture in Australia: 30 years. In Australian Agriculture in 2020: From Conservation to Automation; Pratley, J., Kirkegaard, J., Eds.; Agronomy Australia and Charles Sturt University: Wagga, Australia, 2019; pp. 21–32. [Google Scholar]
- Bellotti, B.; Rochecouste, J.F. The development of Conservation Agriculture in Australia-Farmers as innovators. Inter. Soil Water Conserv. Res. 2014, 2, 21–34. [Google Scholar]
- Dang, Y.P.; Moody, P.W.; Bell, M.J.; Seymour, N.P.; Dalal, R.C.; Freebairn, D.M.; Walker, S.R. Strategic tillage in no-till farming systems in Australia’s north-eastern grains-growing regions: II Implications for agronomy, soil and environment. Soil Tillage Res. 2015, 152, 115–123. [Google Scholar]
- Dang, Y.P.; Balzer, A.; Crawford, M.; Rincon-Florez, V.; Liu, H.; Melland, A.R.; Antille, D.; Kodur, S.; Bell, M.J.; Whish, J.P.M.; et al. Strategic tillage in conservation agricultural systems of north-eastern Australia: Why, where, when and how? Environ. Sci. Pollut. Res. 2018, 25, 1000–1015. [Google Scholar]
- Mansfield, T.J.; Atkinson, C.J. Stomatal behaviour in water stressed plants. In Stress Responses in Plants: Adaptation and Acclimation Mechanisms; Alscher, R.G., Cumming, J.R., Eds.; Wiley-Liss: New York, NY, USA, 1990; pp. 241–264. [Google Scholar]
- Cornic, G.; Massacci, A. Leaf photosynthesis under drought stress. In Photosynthesis and the Environment; Baker, N.R., Ed.; Kluwer Academic Publishers: Dordrecht, The Netherlands, 1996. [Google Scholar]
- Yokota, A.; Kawasaki, S.; Iwano, M.; Nakamura, C.; Miyake, C.; Akashi, K. Citrulline and DRIP-1 Protein (ArgE Homologue) in drought tolerance of wild watermelon. Ann. Bot. 2002, 89, 825–832. [Google Scholar] [PubMed]
- Farooq, M.; Wahid, A.; Kobayashi, N.; Fujita, D.; Basra, S.M.A. Plant drought stress: Effects, mechanisms and management. Agron. Sustain. Dev. 2009, 29, 185–212. [Google Scholar]
- Kim, J.Y.; Mahé, A.; Brangeon, J.; Prioul, J.L. A maize vacuolur invertase, IVR2, is induced by water stress. Organ/tissue specificity and diurnal modulation of expression. Plant Physiol. 2000, 124, 71–84. [Google Scholar] [CrossRef]
- Komor, E. Source physiology and assimilate transport: The interaction of sucrose metabolism, starch storage and phloem export in source leaves and the effects on sugar status in phloem. Aust. J. Plant Physiol. 2000, 27, 497–505. [Google Scholar] [CrossRef]
- De Souza, J.G.; Da Silv, J.V. Partitioning of carbohydrates in annual and perennial cotton (Gossypium hirsutum L.). J. Exp. Bot. 1987, 38, 1211–1218. [Google Scholar] [CrossRef]
- Leport, L.; Turner, N.C.; French, R.J.; Barr, M.D.; Duda, R.; Davies, S.L. Physiological responses of chickpea genotypes to terminal drought in a Mediterranean-type environment. Eur. J. Agron. 2006, 11, 279–291. [Google Scholar] [CrossRef]
- Diaz-Espejo, A.; Buckley, T.N.; Sperry, J.S.; Cuevas, M.V.; de Cires Elsayed-Farag, A.S.; Martin-Palomo, M.J.; Muriel, J.L.; Perez-Martin, A.; Rodriguez-Dominguez, C.M.; Rubio-Casal, A.E.; et al. Steps toward an improvement in process-based models of water use by fruit trees: A case study in olive. Agric. Water Manag. 2012, 114, 37–49. [Google Scholar]
- Rich, S.M.; Watt, M. Soil conditions and cereal root system architecture: Review and considerations for linking Darwin and Weaver. J. Exp. Bot. 2013, 64, 1193–1208. [Google Scholar] [CrossRef] [PubMed]
- Asch, F.; Dingkuhn, M.; Sow, A.; Audebert, A. Drought-induced changes in rooting patterns and assimilate partitioning between root and shoot in upland rice. Field Crop Res. 2005, 93, 223–236. [Google Scholar] [CrossRef]
- O’Donnell, C.; Adkins, S.W. Wild oat and climate change: The effect of CO2 concentration, temperature, and water deficit on the growth and development of wild oat in monoculture. Weed Sci. 2001, 49, 694–702. [Google Scholar] [CrossRef]
- Peters, N.C.B. Production and dormancy of wild oat (Avena fatua) seed from plants grown under soil water stress. Ann. Appl. Biol. 1982, 100, 189–196. [Google Scholar] [CrossRef]
- Sawhney, R.; Naylor, J.M. Dormancy studies in seed of Avena fatua. 13. Influence of drought stress during seed development on duration of seed dormancy. Can. J. Bot. 1982, 60, 1016–1020. [Google Scholar] [CrossRef]
- Gallagher, R.S.; Kristen, L.G.; Lidewij, H.K.; Jairus, R.; Dennis, P.; Sebastian, R.; Burnham, M.; Fuerst, E.P. Shade and drought stress-induced changes in phenolic content of wild oat (Avena fatua L.) seeds. J. Stress Physiol. Biochem. 2010, 6, 90–107. [Google Scholar]
- BOM and CSIRO (Bureau of Meteorology; Centre for Scientific and Industrial Research Organization). State of the Climate. 2020. Available online: http://www.bom.gov.au/state-of-the-climate/ (accessed on 15 July 2021).
- Quail, P.H.; Carter, O.G. Survival and seasonal germination of seeds of Avena fatua and A. ludoviciana. Aust. J. Agric. Res. 1968, 19, 721–729. [Google Scholar] [CrossRef]
- Ali, M.; Williams, A.; Widderick, M.; Adkins, S. Elevated temperature affects Avena sterilis ssp. ludoviciana reproductive biology. Agronomy 2023, 13, 474. [Google Scholar]
- Ali, M.; Suthar, P.C.; Williams, A.; Widderick, M.; Adkins, S.W. Germination behaviour of Avena sterilis ssp. ludoviciana under a range of light and temperature. Crop Pasture Sci. 2022, 73, 1395–1405. [Google Scholar] [CrossRef]
- Soil Survey Staff. Kellogg Soil Survey Laboratory Methods Manual. In Soil Survey Investigations; Report No. 42, Version 5.0; Burt, R., Ed.; Soil Survey Staff, United States Department of Agriculture, Natural Resources Conservation Service: Washington, DC, USA, 2014; pp. 140–144. [Google Scholar]
- Long, R.L.; Panetta, F.D.; Steadman, K.J.; Probert, R.; Bekker, R.M.; Brooks, S.; Adkins, S.W. Seed Persistence in the field may be predicted by Laboratory-Controlled Aging. Weed Sci. 2008, 56, 523–528. [Google Scholar] [CrossRef]
- McMaster, G.S.; Wilhelm, W.W. Growing degree-days: One equation, two interpretations. Agric. For. Meteor. 1997, 87, 291–300. [Google Scholar] [CrossRef]
- Richards, R.A.; Hunt, J.R.; Kirkegaard, J.A.; Passioura, J.B. Yield improvement and adaptation of wheat to water-limited environments in Australia—A case study. Crop Pasture Sci. 2014, 65, 676–689. [Google Scholar] [CrossRef]
- Adkins, S.W.; Loewen, M.; Symons, S.J. Variation within pure lines of wild oats (Avena fatua) in relation to degree of primary dormancy. Weed Sci. 1986, 34, 859–864. [Google Scholar] [CrossRef]
- Turner, N.C.; Wright, G.C.; Siddique, K.H.M. Adaptation of grain legumes (pulses) to water-limited environments. Adv. Agron. 2001, 71, 193–231. [Google Scholar]
- Wahid, A.; Rasul, E. Photosynthesis in leaf, stem, flower and fruit. In Handbook of Photosynthesis, 2nd ed.; Pessarakli, M., Ed.; CRC Press: Boca Raton, FL, USA, 2005; pp. 479–497. [Google Scholar]
- Peters, N.C.B. The dormancy of wild oat seed (Avena fatua L.) from plants grown under various temperature and soil moisture conditions. Weed Res. 1982, 22, 205–212. [Google Scholar] [CrossRef]
- Aisthorpe, D.; McCosker, E. Optimising the phenology and grain yield of wheat genotypes-Emerald. In Queensland Grains Research 2018-19; Regional Research Agronomy, Queensland Department of Agriculture and Fisheries, and Grains Research and Development Corporation: Brisbane City, Australia, 2019; pp. 7–14. [Google Scholar]
- Samarah, N.H. Effects of drought stress on growth and yield of barley. Agron. Sustain. Dev. 2005, 25, 145–149. [Google Scholar] [CrossRef]
- Fahad, S.; Bajwa, A.A.; Nazir, U.; Anjum, S.A.; Farooq, A.; Zohaib, A.; Sadia, S.; Nasim, W.; Adkins, S.; Saud, S.; et al. Crop production under drought and heat stress: Plant responses and management options. Front. Plant Sci. 2017, 8, 1147. [Google Scholar] [CrossRef]
- Yadav, R.S.; Hash, C.T.; Bidinger, F.R.; Devos, K.M.; Howarth, C.J. Genomic regions associated with grain yield and aspects of post-flowering drought tolerance in pearl millet across environments and tester background. Euphytica 2004, 136, 265–277. [Google Scholar] [CrossRef]
- Wellington, P.S. Studies on the germination of cereals. 2. Factors determining the germination behavior of wheat grains during maturation. Ann. Bot. 1956, 20, 481–500. [Google Scholar] [CrossRef]
- King, R.W. Abscisic acid in developing wheat grains and its relationship to grain growth and maturation. Planta 1976, 132, 43–51. [Google Scholar] [CrossRef]
- Ko, J.H.; Yang, S.H.; Han, K.H. Upregulation of an Arabidopsis RING-H2 gene, XERICO, confers drought tolerance through increased abscisic acid biosynthesis. Plant J. 2006, 47, 343–355. [Google Scholar] [CrossRef]
- Thurston, J.M. Biology and Control of Wild Oats; Report for 1962; Rothamsted Experimental Station: Harpenden, UK, 1963; pp. 236–253. [Google Scholar]
- Chancellor, R.J. Growth and development of wild oats plants. In Wild Oats in World Agriculture; Jones, D.P., Ed.; Agricultural Research Council: London, UK, 1976; pp. 89–98. [Google Scholar]
- Peters, N.C.B. Factors affecting seedling emergence of different strains of Avena fatua L. Weed Res. 1986, 26, 29–38. [Google Scholar] [CrossRef]
- Naylor, J.M.; Jana, S. Genetic adaptation for seed dormancy in Avena fatua. Can. J. Bot. 1976, 54, 306–312. [Google Scholar] [CrossRef]
- Jana, S.; Naylor, J.M. Dormancy studies in seed of Avena fatua. 11. Heritability for seed dormancy. Can. J. Bot. 1980, 58, 91–93. [Google Scholar] [CrossRef]
- Fernandez-Quintanilla, C.; Andujar, J.L.G.; Appleby, A.P. Characterization of the germination and emergence response to temperature and soil moisture of Avena fatua and A. sterilis. Weed Res. 1990, 30, 289–295. [Google Scholar] [CrossRef]
- Uremis, I.; Uygur, F. Minimum, optimum and maximum germination temperatures of some important weed species in the Çukurova Region of Turkey. Türk. Herbol. Derg. 1999, 2, 1–12. [Google Scholar]
- Long, R.L. Predicting Weed Seed Persistence: Towards a Technique for Rapid and Reliable Assessment. Ph.D. Thesis, The University of Queensland, Brisbane, Australia, 2007. [Google Scholar]
- Bekker, R.M.; Oomes, M.; Bakker, J.P. The impact of groundwater level on soil seed bank survival. Seed Sci. Res. 1998, 8, 399–404. [Google Scholar] [CrossRef]
- Gonzalez-Zertuche, L.; Vazquez-Yanes, C.; Gamboa, A.; Sanchez-Coronado, M.E.; Aguilera, P.; Orozco-Sergovia, A. Natural priming of Wigandia urens seeds during burial: Effects on germination, growth and protein expression. Seed Sci. Res. 2001, 11, 27–34. [Google Scholar] [CrossRef]
- Taylor, I.N.; Walker, S.R.; Adkins, S.W. Burial depth and cultivation influence emergence and persistence of Phalaris paradoxa seed in an Australian sub-tropical environment. Weed Res. 2005, 45, 33–40. [Google Scholar] [CrossRef]
- Burnside, O.C.; Wilson, R.G.; Weisbert, S.; Hubbard, K.G. Seed longevity of 41 weed species buried 17 years in eastern and western Nebraska. Weed Sci. 1996, 44, 74–86. [Google Scholar] [CrossRef]
- Mahajan, G.; Chauhan, B.S. Seed longevity and seedling emergence behaviour of wild oat (Avena fatua) and sterile oat (Avena sterilis ssp. ludoviciana) in response to burial depth in eastern Australia. Weed Sci. 2021, 69, 362–371. [Google Scholar]
Figure 1.
Spikelet characteristics of Avena sterilis ssp. ludoviciana and Avena fatua (A) showing spikelets on a panicle head and (B) a spikelet of A. ludoviciana and A. fatua. The left-hand insert shows a primary and secondary seed of A. ludoviciana, with the primary seed having an abscission scar at its base, while the secondary seed ends in a stalk. The right-hand insert shows a primary and secondary seed of A. fatua, with each seed having an abscission scar at its base.

Figure 2.
Effect of different soil water stress treatments (percentage of plant available water capacity; % PAWC) on the plant maturity of four Avena sterilis ssp. ludoviciana biotypes. The stress treatments were applied at panicle initiation and continued until plant maturity. Error bars represent standard errors of the mean of 12 replicates and represent pooled data from two experimental runs. Different letters within a biotype indicate significant differences among the treatments.

Figure 3.
Relationship between the plant available water capacity percentage and the time to plant maturity of four biotypes of Avena sterilis ssp. ludoviciana. Error bars represent standard errors of the mean of 12 replicates and represent pooled data from two experimental runs. Lines represent fitted linear regressions.

Figure 4.
Effect of different soil water stress treatments (percentage of plant available water capacity; % PAWC) on the maturity time of four biotypes of Avena sterilis ssp. ludoviciana. From left to right, the pots contain randomly selected plants of 20, 40, 60, 80, and 100% PAWC treatments. Plants within a biotype matured approximately 17, 12, 6, and 3 days earlier by 20, 40, 60, and 80% PAWC treatments compared to the control treatment, i.e., 100% PAWC. Images were taken 78 days after planting.

Figure 5.
Effect of different soil water stress treatments (percentage of plant available water capacity; % PAWC) on the production of filled and empty (A) primary seeds and (B) secondary seeds plant−1 of four biotypes of Avena sterilis ssp. ludoviciana. The stress treatments were applied at panicle initiation and continued until plant maturity. Error bars represent standard errors of the mean of 12 replicates and represent pooled data from two experimental runs. Letters within a biotype indicate significant differences among the treatments. Upper- and lower-case letters used for filled and empty seeds, respectively.

Figure 6.
Effect of different soil water stress treatments (percentage of plant available water capacity; % PAWC) on 1000 primary and 1000 secondary seed weight of four biotypes of Avena sterilis ssp. ludoviciana. The stress treatments were applied at panicle initiation and continued until plant maturity. Error bars represent standard errors of the mean of 12 replicates and represent pooled data from two experimental runs. Letters within a biotype indicate significant differences among the treatments. Upper- and lower-case letters used for 1000 primary and 1000 secondary filled seed weights, respectively.

Figure 7.
Relationship between the time to plant maturity and 1000 filled seed weight of both primary and secondary seeds of four biotypes of Avena sterilis ssp. ludoviciana. Error bars represent standard errors of the mean of 12 replicates and represent pooled data from two experimental runs. Lines represent fitted linear regressions.

Figure 8.
Effect of different soil water stress treatments (percentage of plant available water capacity; % PAWC) on the dormancy (%) of the freshly harvested (A) primary seeds, and (B) secondary seeds of four Avena sterilis ssp. ludoviciana biotypes. Error bars represent standard errors of the mean of six replicates and represent pooled data from two experimental runs.

Figure 9.
Effect of different soil water stress treatments (percentage of plant available water capacity; % PAWC) on the dormancy (%) of the freshly harvested primary and secondary caryopses (palea and lemma removed) of four Avena sterilis ssp. ludoviciana biotypes. Error bars represent standard errors of the mean of six replicates and represent pooled data from two experimental runs. Letters within a biotype indicate significant differences among the treatments. Upper- and lower-case letters used for primary and secondary caryopses, respectively.

Figure 10.
Non-linear regression model of the response of (A) primary caryopses and (B) secondary caryopses from four Avena sterilis ssp. ludoviciana biotypes to controlled aging at 48 °C and 60% relative humidity. Caryopses used in the test had been produced under 20, 60, or 100% PAWC (plant available water capacity) treatments. Viability is expressed as the percentage of normal germination during 21 days of incubation at 15/5 °C day/night temperature with a matching photoperiod (12/12 h light/dark condition). The horizontal dashed line running across each panel identifies the time for a 50% reduction in viability of the seeds produced under different treatments.


Table 1.
Monthly average rainfall (mm) of the seed collection sites of Avena sterilis ssp. ludoviciana biotypes during their seed development time from August to October, 2015 to 2017. The rainfall data were collected from the nearest weather station to the seed collection sites (source: Bureau of Meteorology, Australian Government; www.bom.gov.au (accessed on 10 August 2021). The data were taken from 2015, 2016, and 2017.
| Location | Year | Monthly Average Rainfall (mm) | 3-Month Average Rainfall (mm) | |||
|---|---|---|---|---|---|---|
| August | September | October | ||||
| Northern NGR | Biloela | 2015 | 43.0 | 26.2 | 79.6 | 49.6 |
| 2016 | 9.8 | 28.2 | 16.6 | 18.2 | ||
| 2017 | 14.0 | 0.0 | 87.8 | 33.9 | ||
| Northern NGR 3-year average | 22.3 | 18.1 | 61.3 | 33.9 | ||
| Southern NGR | Toobeah | 2015 | 30.0 | 3.0 | 12.0 | 15.0 |
| 2016 | 73.0 | 114.0 | 33.0 | 73.3 | ||
| 2017 | 9.0 | 0.0 | 118.0 | 42.3 | ||
| 3-year average | 37.3 | 39.0 | 54.3 | 43.6 | ||
| Jandowae | 2015 | 39.6 | 23.6 | 65.8 | 43.0 | |
| 2016 | 48.0 | 113.6 | 23.2 | 61.6 | ||
| 2017 | 4.2 | 1.2 | 137.4 | 47.6 | ||
| 3-year average | 30.6 | 46.1 | 75.5 | 50.7 | ||
| Southern NGR 3-year average | 33.8 | 42.6 | 64.9 | 47.2 | ||
Table 2.
The calculated soil water contents used in the treatments (percentage of plant available water capacity; % PAWC) that were applied to four Avena sterilis ssp. ludoviciana biotypes collected from the Northern Grains Region. The soil water stress treatments were applied at the time of panicle emergence and continued until harvest. The severity of the drought stress was categorised based on the amount of water applied to the plants.
| Soil Water Stress Treatments (% PAWC) | Soil Water Content (g H2O kg−1 Soil) | Classification of Drought Stress Created |
|---|---|---|
| 100 (Control) | 166 | No stress |
| 80 | 133 | Very mild |
| 60 | 100 | Mild |
| 40 | 66 | Moderate |
| 20 | 33 | Severe |
Table 3.
Fitted initial viability percentage (a), rate of viability loss in the rapidly declining section of the curve (b), and days taken to 50% viability loss (P50) of primary and secondary caryopses of four biotypes of Avena sterilis ssp. ludoviciana found in the controlled aging test (CAT) at 48 °C and 60% RH. Caryopses used had been produced under 20, 60, or 100% PAWC (plant available water capacity).
| Treatment | Biotype | Caryopsis Type | a | b | P50 |
|---|---|---|---|---|---|
| 20% PAWC | Biloela 1 | Primary | 100 | 7 | 32 |
| Secondary | 101 | 9 | 45 | ||
| Biloela 2 | Primary | 98 | 9 | 51 | |
| Secondary | 100 | 11 | 57 | ||
| Toobeah | Primary | 99 | 9 | 42 | |
| Secondary | 99 | 9 | 54 | ||
| Jandowae | Primary | 99 | 8 | 37 | |
| Secondary | 100 | 10 | 50 | ||
| 60% PAWC | Biloela 1 | Primary | 98 | 8 | 63 |
| Secondary | 98 | 8 | 67 | ||
| Biloela 2 | Primary | 98 | 8 | 79 | |
| Secondary | 98 | 8 | 83 | ||
| Toobeah | Primary | 99 | 10 | 71 | |
| Secondary | 99 | 11 | 72 | ||
| Jandowae | Primary | 99 | 10 | 66 | |
| Secondary | 100 | 11 | 69 | ||
| 100% PAWC | Biloela 1 | Primary | 98 | 10 | 78 |
| Secondary | 98 | 9 | 83 | ||
| Biloela 2 | Primary | 99 | 10 | 91 | |
| Secondary | 98 | 11 | 102 | ||
| Toobeah | Primary | 99 | 9 | 82 | |
| Secondary | 98 | 11 | 95 | ||
| Jandowae | Primary | 100 | 11 | 84 | |
| Secondary | 97 | 9 | 97 |
Table 4.
Response of primary and secondary caryopses of four biotypes of Avena sterilis ssp. ludoviciana to controlled aging test (CAT) at 48 °C and 60% RH and their predicted longevity in soil. Caryopses used were produced under 20, 60, and 100% PAWC (plant available water capacity) treatments. Caryopses losing their 50% viability (P50) in 40 days under the CAT were categorised as transient type (predicted longevity in the soil <1 year), while caryopses that reached their P50 value in >40 to 60 days were categorised as short-lived type (predicted longevity 1 to 2 years), those reaching their P50 value in >60 to 80 days were categorised as medium-lived type (predicted longevity >2 to 4 years), and those reaching their P50 value in >80 days were categorised as long-lived type (predicted longevity >4 years).
| Biotype | 20% PAWC | 60% PAWC | 100% PAWC | |||
|---|---|---|---|---|---|---|
| P50 Value (Days) | Predicted Longevity in the Seedbank (Years) | P50 Value (Days) | Predicted Longevity in the Seedbank (Years) | P50 Value (Days) | Predicted Longevity in the Seedbank (Years) | |
| Primary caryopses/seed | ||||||
| Biloela 1 | 32 | <1 | 63 | >2 to 4 | 78 | >2 to 4 |
| Biloela 2 | 51 | 1 to 2 | 79 | >2 to 4 | 91 | >4 |
| Toobeah | 42 | 1 to 2 | 71 | >2 to 4 | 82 | >4 |
| Jandowae | 37 | <1 | 66 | >2 to 4 | 84 | >4 |
| Secondary caryopses/seed | ||||||
| Biloela 1 | 45 | 1 to 2 | 67 | >2 to 4 | 83 | >4 |
| Biloela 2 | 57 | 1 to 2 | 83 | >4 | 102 | >4 |
| Toobeah | 54 | 1 to 2 | 72 | >2 to 4 | 95 | >4 |
| Jandowae | 50 | 1 to 2 | 69 | >2 to 4 | 97 | >4 |
Table 5.
Thermal time (degree-days) of four Avena sterilis ssp. ludoviciana biotypes. Plants were grown under different percentages of plant available water capacity (% PAWC).
Table 5.
Thermal time (degree-days) of four Avena sterilis ssp. ludoviciana biotypes. Plants were grown under different percentages of plant available water capacity (% PAWC).
| Treatment (% PAWC) | Days to Panicle Initiation | Thermal Time (Degree-Days) | Days to Maturity | Thermal Time until Maturity (Degree-Days) | ||||
|---|---|---|---|---|---|---|---|---|
| 2018–2019 | 2019–2020 | 2-Year Average | 2018–2019 | 2019–2020 | 2-Year Average | |||
| Biloela 1 | ||||||||
| 20% | 58 | 852 | 884 | 868 | 84 | 1335 | 1352 | 1344 |
| 40% | 91 | 1455 | 1481 | 1468 | ||||
| 60% | 96 | 1585 | 1603 | 1594 | ||||
| 80% | 99 | 1651 | 1675 | 1663 | ||||
| 100% | 103 | 1748 | 1761 | 1755 | ||||
| Biloela 2 | ||||||||
| 20% | 58 | 852 | 884 | 868 | 86 | 1376 | 1393 | 1385 |
| 40% | 92 | 1494 | 1525 | 1510 | ||||
| 60% | 98 | 1630 | 1648 | 1639 | ||||
| 80% | 101 | 1699 | 1725 | 1712 | ||||
| 100% | 104 | 1772 | 1778 | 1775 | ||||
| Toobeah | ||||||||
| 20% | 63 | 946 | 965 | 956 | 91 | 1474 | 1503 | 1489 |
| 40% | 97 | 1607 | 1626 | 1617 | ||||
| 60% | 101 | 1699 | 1725 | 1712 | ||||
| 80% | 105 | 1795 | 1795 | 1795 | ||||
| 100% | 108 | 1858 | 1864 | 1861 | ||||
| Jandowae | ||||||||
| 20% | 65 | 978 | 1002 | 990 | 95 | 1561 | 1583 | 1572 |
| 40% | 99 | 1651 | 1675 | 1663 | ||||
| 60% | 105 | 1795 | 1795 | 1795 | ||||
| 80% | 108 | 1858 | 1864 | 1861 | ||||
| 100% | 111 | 1924 | 1939 | 1932 | ||||
Disclaimer/Publisher’s Note: The statements, opinions and data contained in all publications are solely those of the individual author(s) and contributor(s) and not of MDPI and/or the editor(s). MDPI and/or the editor(s) disclaim responsibility for any injury to people or property resulting from any ideas, methods, instructions or products referred to in the content. |
© 2023 by the authors. Licensee MDPI, Basel, Switzerland. This article is an open access article distributed under the terms and conditions of the Creative Commons Attribution (CC BY) license (https://creativecommons.org/licenses/by/4.0/).
Share and Cite
MDPI and ACS Style
Ali, M.; Williams, A.; Widderick, M.; Haque, M.A.; Adkins, S. Drought Stress Affects the Reproductive Biology of Avena sterilis ssp. ludoviciana. Land 2023, 12, 1745. https://doi.org/10.3390/land12091745
AMA Style
Ali M, Williams A, Widderick M, Haque MA, Adkins S. Drought Stress Affects the Reproductive Biology of Avena sterilis ssp. ludoviciana. Land. 2023; 12(9):1745. https://doi.org/10.3390/land12091745
Chicago/Turabian StyleAli, Mohammad, Alwyn Williams, Michael Widderick, Mohammad Anamul Haque, and Steve Adkins. 2023. "Drought Stress Affects the Reproductive Biology of Avena sterilis ssp. ludoviciana" Land 12, no. 9: 1745. https://doi.org/10.3390/land12091745
Note that from the first issue of 2016, this journal uses article numbers instead of page numbers. See further details here.