Article

Analysis of the Propionate Metabolism in Bacillus subtilis during 3-Indolacetic Production

by
Freddy Castillo-Alfonso
1,
Alejandro Quintana-Menéndez
1,
Gabriel Vigueras-Ramírez
2,
Alfonso Mauricio Sales-Cruz
2,
Luis Manuel Rosales-Colunga
3 and
Roberto Olivares-Hernández
2,*
1
Posgrado en Ciencias Naturales e Ingeniería, Universidad Autónoma Metropolitana Unidad Cuajimalpa, Ciudad de México 05370, Mexico
2
Departamento de Procesos y Tecnología, Universidad Autónoma Metropolitana, Unidad Cuajimalpa, Av. Vasco de Quiroga 4871, Col. Santa Fe Cuajimalpa, Cuajimalpa de Morelos, Ciudad de México 05348, Mexico
3
Facultad de Ingeniería, Universidad Autónoma de San Luis Potosí, Av. Dr Manuel Nava 8, Zona Universitaria, San Luis Potosí 78290, Mexico
*
Author to whom correspondence should be addressed.
Microorganisms 2022, 10(12), 2352; https://doi.org/10.3390/microorganisms10122352
Submission received: 31 October 2022 / Revised: 23 November 2022 / Accepted: 23 November 2022 / Published: 28 November 2022
(This article belongs to the Special Issue Metabolism in the Bacillus subtilis)

Abstract

:
The genera Bacillus belongs to the group of microorganisms that are known as plant growth-promoting bacteria, their metabolism has evolved to produce molecules that benefit the growth of the plant, and the production of 3-indole acetic acid (IAA) is part of its secondary metabolism. In this work, Bacillus subtilis was cultivated in a bioreactor to produce IAA using propionate and glucose as carbon sources in an M9-modified media; in both cases, tryptophan was added as a co-substrate. The yield of IAA using propionate is 17% higher compared to glucose. After 48 h of cultivation, the final concentration was 310 mg IAA/L using propionate and 230 mg IAA/L using glucose, with a concentration of 500 mg Trp/L. To gain more insight into propionate metabolism and its advantages, the genome-scale metabolic model of B. subtilis (iBSU 1147) and computational analysis were used to calculate flux distribution and evaluate the metabolic capabilities to produce IAA using propionate. The metabolic fluxes demonstrate that propionate uptake favors the production of precursors needed for the synthesis of the hormone, and the sensitivity analysis shows that the control of a specific growth rate has a positive impact on the production of IAA.

1. Introduction

3-Indoleacetic acid (IAA) is a carboxylic acid that belongs to the group of phytohormones called auxins, which has a role as a plant growth hormone [1]. It is responsible for increasing the density of root hairs and lateral roots favoring the consumption of nutrients from the surroundings. At the cellular level, it stimulates the proliferation of cells in the young areas of the plant and contributes to the differentiation of vascular tissues [2]. These types of hormones are produced by the so-called plant growth-promoting bacteria (PGPB), which are part of the genera: Azotobacter sp., Azospirillum sp., Pseudomonas sp., Bacillus sp. The increasing demand for sustainable handling in agriculture activity, stands out the potential of the PGPB to produce biofertilizers that have an impact on the yield and quality of commercial farming [3]. The synthesis of IAA is considered part of the secondary metabolism of B.subtilis, and the synthesis takes place during the transition from the exponential phase to the stationary phase of bacterial growth. The main precursor in the synthesis is the amino acid L-tryptophan (Trp) as it provides the carbon skeleton of this phytohormone. In general, there are several routes of synthesis of IAA in the group of PGPB: the indole 3-pyruvate (IPA), the tryptamine (TAM) and the indole 3-acetamide (IAM).
From the group of the PGPB, B. subtilis has been widely used for industrial development to produce different compounds of high value such as enzymes, antibiotics, nucleotides and polyhydroxybutyrate (PHB). One of the main bases for using B. subtilis in these biotechnological applications is the knowledge of its central carbon metabolism and its adaptation to different environments. Traditionally, the production processes are carried out using mainly glucose or other sugars as a carbon source [4,5], nevertheless, it has the ability to grow on citrate, glycerol, mannitol and L-glutamic acid as a carbon source [6,7]. It also can grow in different organic acids such as acetate, propionate, butyrate, succinate and formate [8]. Depending on the point of entry of the carbon source in the metabolic pathway, the efficiency to produce metabolic intermediates varies considerably [9].
Initial studies on IAA production using B. subtilis, isolated from the rhizosphere in soy plants in Brazil, reported the concentration from 170 mg IAA/L to 310 mg IAA/L using a complex media with potato-dextrose, hydrolyzed protein and glucose as the main carbon source [10]. Another study reported the production of 55 mg IAA/L cultivating B. subtilis SJ-101 in M9 minimal media with 500 mg Trp/L [11]. The isolation of Bacillus velezensis FKM10 from the rhizosphere in apple trees was used to demonstrate its capability to promote plant growth [12] and it can make synergy with other microorganisms from the genera Aspergillus [13]. Alternatively, the sole production of IAA in other microorganisms are reported. Based on the strategy of culture conditions optimization, Streptomyces fradiae NKZ-259 was cultivated to overproduce IAA reaching a four-fold increase (82.363 μg/mL) with 2 g Trp/L. The cell culture and the culture supernatant filtrated were tested in Solanum lycopersicum plants comparing root length and dry and fresh plant weight reporting a 20% increase on average in those plants subject to the microorganism as promoter [14]. The well-known industrial microorganism Escherichia coli was genetically engineered to overproduce IAA introducing the de novo pathway IAM. The strain was capable to produce 906 mg IAA/L using a complex media [15]. The large-scale production was also exploring cultivating Rhodosporidiobolus fluvialis DMKU-CP293 strain in a pilot-scale bioreactor with a volume of 100 L. The final titer was 3569.32 mg IAA/L, which is so far, the first report of IAA production at the pilot scale [16]. The cultivation media, in the cases mentioned above, was a complex media and Trp dependent, despite the high titer, the production cost can be reduced if minimal media can be used together with the advantages of a natural producer such as B. subtilis.
The cultivation strategies to over-produce the desired metabolite can be directed with rational approaches, such as the mathematical modeling of the metabolism and computational tools. For instance, genome-scale metabolic models (GSMM) compile gene-protein-reaction associations of the metabolic network at genome wide level [17]. Based on this information, it is possible to build a mathematical framework that includes optimization algorithms for flux predictions, known as constrain-based modeling. In particular, the framework for flux predictions using linear programming is called flux balance analysis (FBA) [18,19]. This approach has been widely used for the exploration of metabolic engineering strategies, such as gene deletion, gene insertions, production yields or substrate utilization [20]. As with other mathematical frameworks, FBA has some limitations, one of these is the multiple solutions for flux distribution and competition among metabolic objectives. To overcome these problems, other constraint-based algorithms have been developed. For example, the overproduction of desired metabolites decreases biomass formation, to simulate this scenario, a bilevel optimization framework was developed with the purpose to find gene deletion strategies to maximize biomass formation with maximization of the production of the desired metabolite [21].
Recently, by using the GSMM of Bacillus and constraint-based approaches it was possible to predict the overexpression of target genes to increase the production of fengycin, a novel antifungal [22]. The constraint-based analysis of the metabolic network includes tools to evaluate the robustness and phenotypic states to achieve the desired production objectives [23,24]. Robustness analysis is a constraint-based analysis to assess how much an objective function will change as a function of change in a particular reaction flux [25,26,27]. Another method is the single gene deletion analysis, this is used to potentially find gene deletions to overproduce or inhibit compounds trying to preserve the same distribution of fluxes. Finding the optimal phenotype by eliminating components of the metabolic network is one of the goals of using these tools [28]. The analysis of the Phenotype Phase Plane (PhPP) identifies the dependencies on environmental conditions to optimize target fluxes [29].
In this work, we explored the production of IAA cultivation of B. subtilis in minimal media M9 and an alternative carbon source such as propionate. GSMM allowed the exploration of the metabolic pathway activity highlighting key aspects of the propionate distribution and its impact in IAA production. Additionally, constraint-based analysis addresses the need to control the growth rate in order to increase the IAA productivity.

2. Materials and Methods

2.1. Strain and Media Cultivation

The strain Bacillus subtilis W168 was taken from the cellular bank from Laboratorio de Biotecnología, UAM Cuajimalpa. This strain is prototrophic and sporulating. For the cultivation a minimal media M9 was adjusted based on the Carbon/Nitrogen ratio with a composition of 6 g Na2HPO4/L, 3 g K2HPO4/L, 0.5 g NaCl/L, 0.5 g NH4NO3/L, 0.024 g MgSO4/L, 0.0001 g CaCl/L. The carbon sources were 5 g/L of propionate and glucose and a concentration of 0.5 g/L of tryptophan as a co-substrate.

2.2. Bioreactor Cultivation

The inoculum was prepared and incubated at 33 °C for 24 h, and seed into the bioreactor New Brunswick BioFlo III with 3 L capacity (working volume of 2 L) The bioreactor is equipped with a sensor for pH, dissolved oxygen (DO) and temperature. The gases, O2 and CO2 were monitored using the Blue Sense during the time of cultivation. The cultivation time was 48 h and stirred at 250 rpm. The samples were taken at 0, 4, 6, 15, 16, 17, 18, 19, 21, 23, 25, 40, 44 and 48 h, with a volume of 2 mL. The samples were centrifuged at 12,000 rpm for 5 min. The supernatant was used to quantify the concentration of glucose, propionate, Trp and IAA, and the pellet to quantify biomass. Before scaling up to the bioreactor, flask cultivations were evaluated to identify the variability on the experimental data (See supplementary material 1) with technical and biological replicates. Based on these results and the small standard deviation observed at flask level, we took the decision to perform one experiment at the bioreactor level as the variation might be at the same level. The same level of variation was reported previously [30].

2.3. Biomass and Metabolite Quantification

The biomass pellets were dried at 80 °C for 24 h and the weight was registered. The absorbance at 600 nm with a spectrophotometer (BioPho-tometer plus, Eppendorf, Framingham, MA, USA) for each sample was taken to prepare the calibration curve. Carbon sources were quantified by HPLC (ProStar, Varian, Palo Alto, CA, USA) with an Aminex HPX-87H column (Bio-Rad Laboratories Inc., Hercules, CA, USA) equipped with a refraction index detector (Smart Line 2300, Knauer, Berlin, Germany). The mobile phase was sulfuric acid (H2SO4) at 5 mM. The flow of the mobile phase was 0.6 mL/min.
IAA and tryptophan quantification was determined with spectrophotometry at a wavelength of 530 nm (BioPho-tometer plus, Eppendorf, Framingham, MA, USA) applying the Salkowski method [31]. The samples with the supernatant were incubated for 30 min in dark conditions with the Salkowski reactive (2.4 g de FeCl3 in 100 mL de H2SO4) with a ratio of 1:1. To obtain the values of IAA the absorbance values were extrapolated using a calibration curve obtained with synthetic IAA (Sigma and Aldrich, St. Louis, MO, USA). These values were corroborated with HPLC. The samples were defrosted and filtered with nylon filters with a particle size of 0.2 µm. The analysis was performed on a ProStar HPLC system (Varian, Palo Alto, CA, USA) using a C18 Spherisorb ODS2 column (5 µm, 150 × 4.6 mm ID; Waters, Milford, MA, USA), equipped with a UV–Vis detector adjusted at 280 nm. The mobile phase was acidulated water (acetic acid at 1% v/v) and acetonitrile in a ratio of 70:30. The flow was 1 mL/min. The calibration curve for IAA and tryptophan was prepared using a range of concentration 0.001 to 1 g/L.

2.4. Genome-Scale Metabolic Model and Flux Calculations

The genome-scale metabolic model used for the flux calculations was the iBSU 1147 + 1 [30], this model includes a missing reaction from the previous version, the iBSU 1147 [32]. The model accounts for 1148 genes and 1745 reactions, these reactions are distributed in 1199 metabolic reactions, 290 for transport and 255 for exchange, and 1457 metabolites divided into 1202 intracellular and 255 extracellular [25,33].
The fluxes were calculated using flux balance analysis (FBA). This methodology is based on the linear programming algorithm where the objective function is the biomass, as the initial objective, and the restrictions are a set of linear equations accounting for the mass balances of each internal metabolite. Other restrictions are applied such as the specific production and consumption rates calculated from the kinetic cultivation data.
The mathematical formulation of the FBA problem is formulated with the following equation:
m a x / m i n   Z = v b i o m a s s
s t .           S · v = 0
v j = v e x , j
α   v β                 α , β   ϵ    
where S is the matrix where the entries are the stoichiometric coefficients of the metabolites participating in the metabolic reaction. The vector v is the flux of each metabolic reaction in the model. The objective function Z is the flux (specific growth rate) in the pseudo-biomass reaction, but other physiological objectives can be represented [18,34]. The variable v e x , j are the specific consumption and production rates; in this work, the specific production rate of IAA and the specific consumption rates of glucose, propionate and tryptophan were calculated based on the kinetic cultivation data, and these are used as restrictions for the optimization problem. When the objective function was the production of IAA, the specific growth rate was restricted together with the carbon source rates.

2.5. Constrain-Based Analyses: Robustness, Gene Deletion, Phenotypic Phase Plane and OptKnock

The sensitivity analysis in linear programing is performed by evaluating the changes in the objective function as a function of the changes in the decision variables or modifications in the restrictions of interest. In the context of FBA, the reduced cost evaluates the changes in the objective function relative to the changes in the flux of the reaction of interest. The shadow price evaluates the changes in the objective function relative to an increase in a particular metabolite [35]. These approaches for the sensitivity analysis in linear programming are the bases for the single and doubles robustness analysis and the phenotypic phase plane. The robustness analysis considers the variations in the enzyme activity by changing the flux value in a particular reaction and how these change the impact in IAA production. The phenotypic phase plane evaluates the availability of two metabolites, oxygen and IAA, and their impact in growth rate. Single-gene deletion analysis allows the search of all possible mutants that increase IAA production. The computational analyses were carried out with the Cobra Toolbox 3.0 [29] in Matlab 2021®. The evaluation of two objectives we performed using a bilevel optimization algorithm using OptKnock [36]. This bilevel algorithm enables the search of two objectives: the maximization of the growth cell imposed by the maximum IAA production, the files with the Matlab codes and GSMM of B. subtilis are in Supplementary material 3–7.

2.6. Statistical Analysis and Data Chart

The statistical test to evaluate the kinetics parameters was the Kruskal–Wallis test, this test uses the χ2 statistic for no normal distributed data and based on this statistical analysis we found no significant differences across replicates in flask cultivations and HPLC data (See supplementary material 1) [37]. All data presented were filtered and analyzed using the Microsoft Excel statistical package [38]. All graphs presented in the manuscript were built using Matlab (Mathworks, Inc., Natick, MA, USA).
The specific growth rate, µ (h−1), was calculated using a linear regression of the biomass concentration vs. IVC (Area under the curve using the Simpson numerical method). The specific rate of substrate consumption, qs, was calculated with a linear regression of the substrate concentration vs. IVC, the qp was calculated with a linear regression of the product concentration vs. IVC, and the concentrations of biomass, substrate and product used were in mmol/L units and the IVC value was in gDW h/L units. Yx/s, Yx/p and Yp/s yields were determined from the kinetic parameters µ, qs, qp.

3. Results

3.1. Bioreactor Cultivations

The product and biomass yields are dependent on the carbon source and culture conditions; in particular, the metabolism of B. subtilis produces IAA requiring tryptophan (Trp) as a precursor. Considering this Trp dependency, after the evaluation of IAA production in shake flask cultivations comparing five different carbon sources, it was possible to identify the propionate as an optimal carbon source to increase product yield [30]. To have more insights into propionate’s metabolism, we report the kinetic parameters from microbial cultivations in 3 L bioreactor using propionate and glucose as a reference.

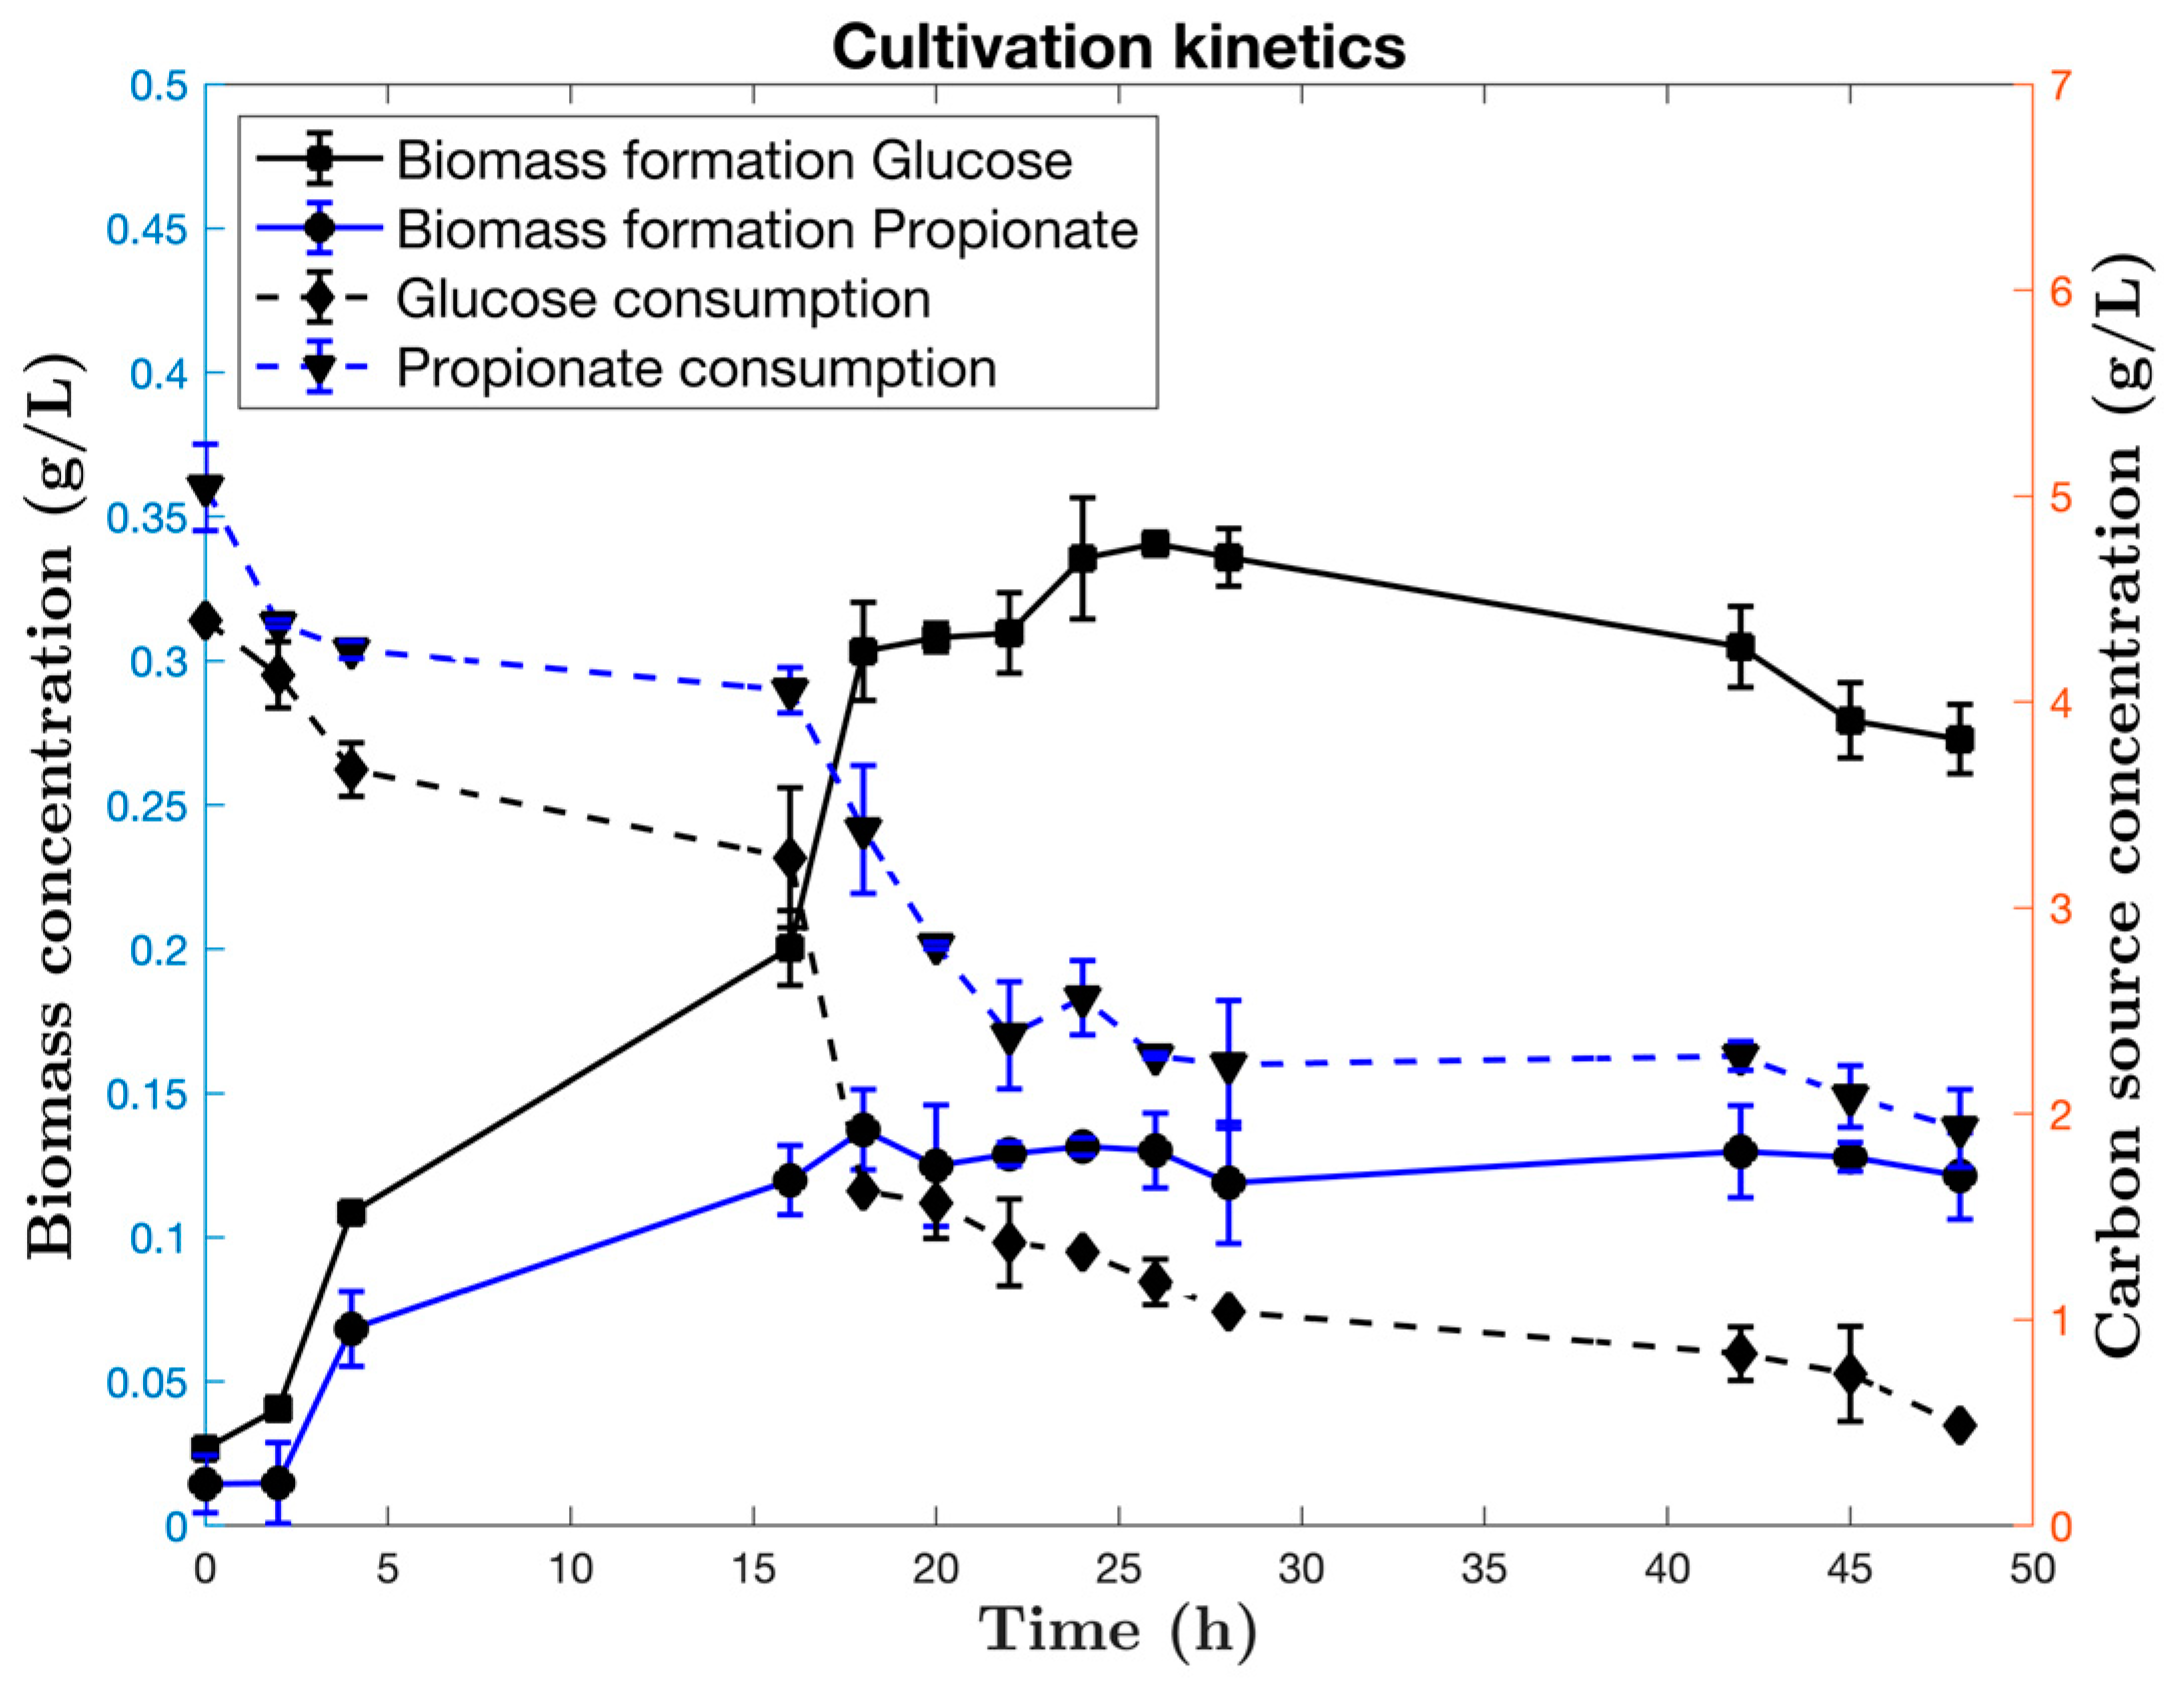
3.1.1. Cultivation Kinetics

Bacillus subtilis was cultivated in a 3 L bioreactor with air, temperature and pH control. Tryptophan was added as precursor for the IAA production, the biomass production and glucose and propionate consumptions can be seen in Figure 1.
The cultivation time was extended up to 48 h. The initiation of the stationary growth phase is close to 18 h; therefore, the induction with Trp started at 16 h. The stationary phase is sustained up to 42 h of cultivation, after that, the decline phase is observed. The final biomass concentration was 0.34 g /L on glucose compared to the 0.13 g DW/L when propionate is the carbon source. These values are reached close to 18 h and kept almost invariant during the stationary phase. Glucose is almost consumed, whereas 1.92 g/L of propionate remains at 48 h. The same tendency was reported in shake flask cultivations [30].

3.1.2. IAA Kinetics

In Figure 2, it can be seen the kinetics of IAA production coupled with the Trp consumption when comparing glucose and propionate as carbon sources. Trp induction was made at 16 h after the initiation of the cultivation.
The accumulation of the product is extended up to 48 h, as the metabolism of B. subtills might be active while the Trp is present in the media. The final concentration of AIA is 0.30 g/L growing on propionate, compared to 0.23 g/L growing on glucose.

3.1.3. Kinetic Parameters

The kinetic parameters are presented in Table 1. In terms of biomass formation, glucose presented a higher yield (Yx/s = 0.324 ± 0.05) compared to propionate (Yx/s = 0.219 ± 0.08). The most interesting observation is that IAA yield (Yp/(s+Trp) = 0.524 ± 0.04) is higher when propionate is the carbon source. The same situation can be seen with productivity, it is higher with propionate (qp,IAA = 1.92 ± 0.07) compared to glucose (qp,IAA = 1.33 ± 0.02).

3.2. Flux Distributions

The kinetic parameters reported in Table 1 were used to calculate the flux distributions (qs,stat, qs,Trp, μstat, and qp,IAA). In Figure 3, the flux distribution is mapped across the central carbon metabolism when propionate and glucose are the carbon sources used. The incorporation of propionate into the B. subtilis catabolism occurs through the methylcitric acid pathway; an intermediate in the synthesis of fatty acids and the tricarboxylic acid cycle [39]. Glucose enters through the glycolytic pathway. When propionate is the carbon source, there is an increase in the flux value at the level of succinate to form malate that corresponds to the incorporation of this carbon source to the TCA cycle (see Figure 4). The increase in the flux value in the formation of succinate is due to the synergistic effect in the formation of this metabolite via alpha-ketoglutarate and 2-methylcitrate. Bacillus subtilis has the anaplerotic pathway responsible for forming phosphoenolpyruvate from oxalacetate by the enzyme phosphoenolpyruvate carboxykinase (PEPCK) and forming pyruvate from oxalacetate by the enzyme pyruvate kinase (PYR). It also possesses the ability to form pyruvate from malate through the malic enzymes encoded in the sfcA and maeA genes. IAA production using propionate can activate or modulate these anaplerotic pathways. The pentose phosphate pathway (PPP) allows the generation of NADPH, but this product can be supplied by tricarboxylic acids cycle (TCA) activity. When TCA activity is decreased, this metabolic pathway can be activated to generate a number of intermediates, as can be seen when analyzing the flux values in the PPP. Furthermore, the formation of glyceraldehyde 3-phosphate from erythrose 4 -phosphate is favored to form tryptophan via indolglycerol phosphate as the main synthesis pathway of this amino acid from erythrose 4-phosphate via shikimate and corismate is found repressed by the Trp operon [40].
The main pathway for the synthesis of Trp is through the molecules of glyceraldehyde 3-phosphate, erythrose 4-phosphate, phosphoenolpyruvate, shikimate and chorismate; all intermediaries of the formation of Trp, and consequently, of IAA. Therefore, analyzing the behavior of the generation and consumption of these compounds, mainly glyceraldehyde 3-phosphate and erythrose 4-phosphate, can be indicative of how intracellular variations of these substances impact the production of IAA by participating in the formation of indole intermediaries.

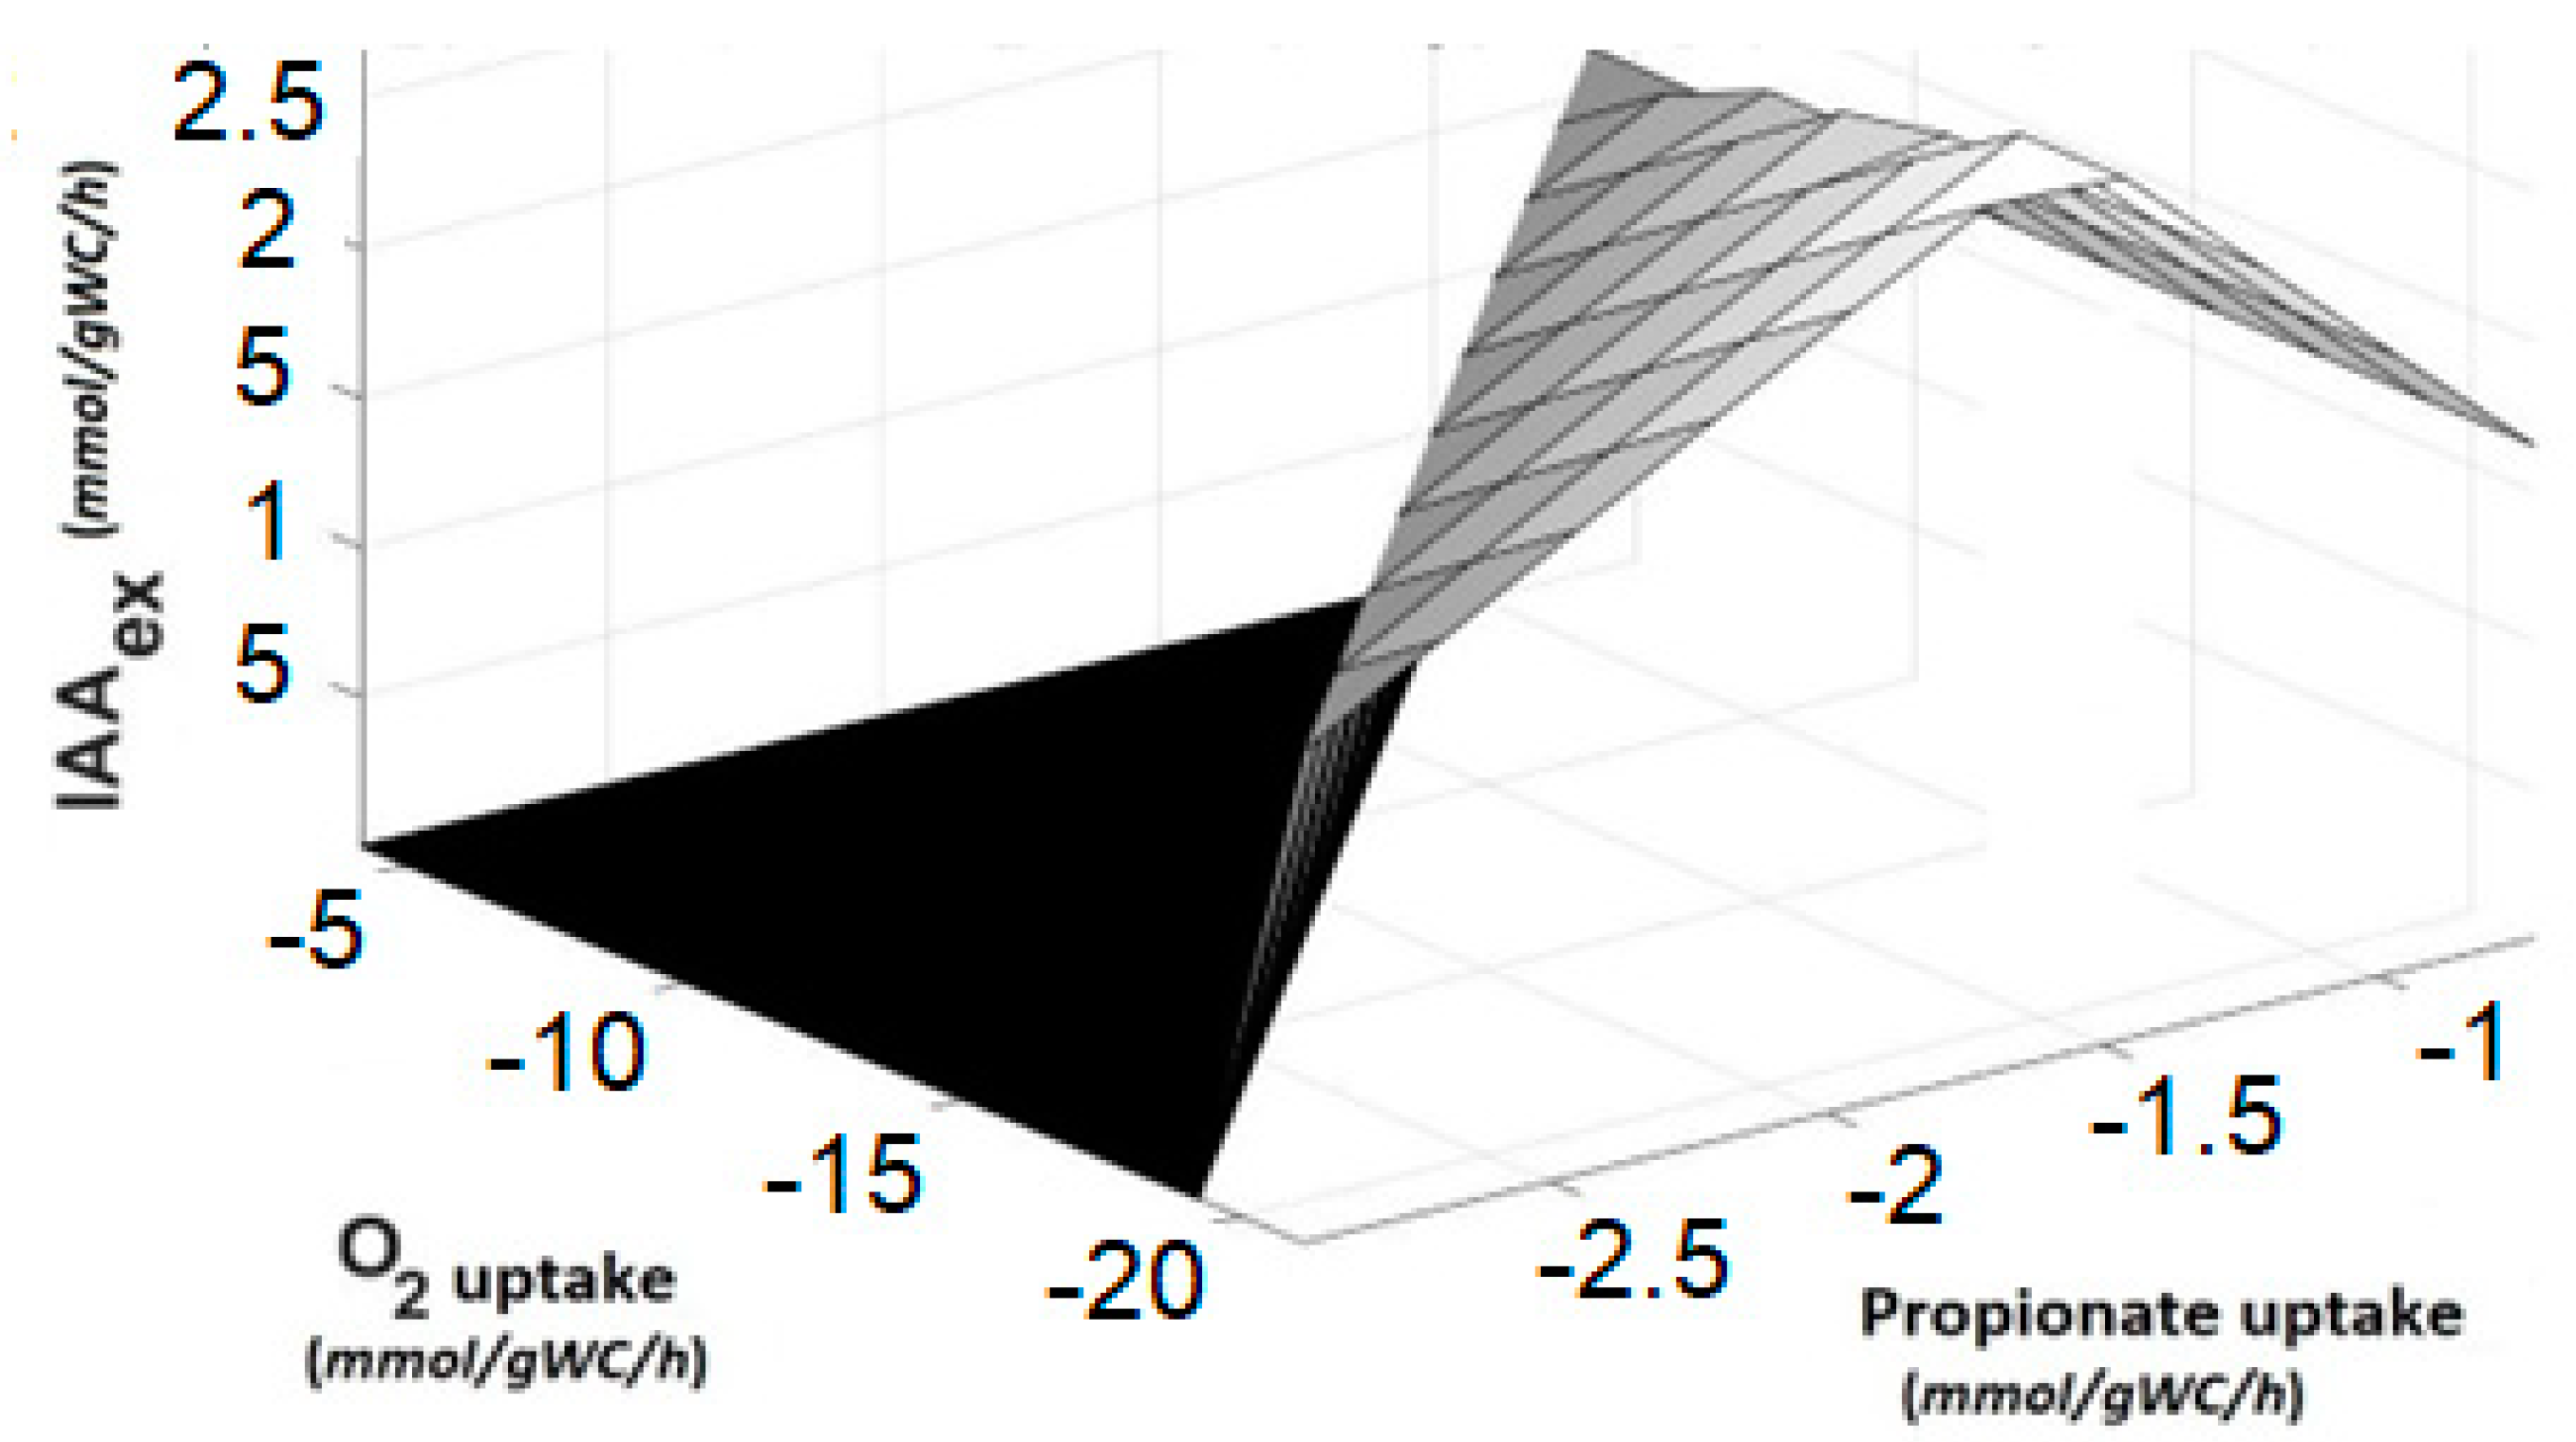
3.3. Propionate Uptake Pathway

Propionate is incorporated into the metabolism at the TCA level, specifically through succinate. In Figure 4, the incorporation requires six enzymatic steps. Oxaloacetate is incorporated to produce 2-methylcitrate in an irreversible step using the 2-methylcitrate synthase (EC 2.3.3.5). Oxaloacetate is an intermediary in the TCA, therefore the activity of the TCA increases to provide this intermediate as a reactive in the reactions that consume propionate, and this carbon is recycled back to succinate but also into pyruvate, as in the final step methylisocitrate is converted to succinate and pyruvate using the enzyme methylisocitrate lyase (EC 4.1.3.30); further, the pyruvate (PYR) is converted to phosphoenolpyruvate (PEP) in the reaction catalyzed by the phosphoenolpyruvate synthase (EC 2.7.9.2) replenishing the gluconeogenesis activity.

3.4. Analysis of Metabolic Capabilities

3.4.1. Simple Robustness Analysis

The presence of the precursor for IAA production is evaluated at different growth rates. Seven reactions that participate in the formation of the following products were selected: 2-methylcitrate (mCIT), malate (MAL), citrate (CIT), glyceraldehyde 3-phosphate (G3P), erythrose 4-phosphate (E4P), pyruvate (PYR) and IAA. This set of metabolites is involved in propionate metabolism and IAA production according to the flux distributions evaluated previously. The different flux values for these reactions were obtained by simulating different values of the specific growth rates (μ); in terms of cultivation strategies of Bacillus subtilis, this analysis suggests it is similar to performing experiments with different dilution rates in chemostat cultivation. All the values of metabolic fluxes obtained were normalized considering the specific consumption rate of propionate, in order to obtain independent data from the initial concentration and to be able to withdraw conclusions of the behavior of the network depending only on the biomass values. As can be seen in Figure 5, the values of glyceraldehyde 3-phosphate (G3P), erythrose 4-phosphate (E4P) and IAA increase as the biomass (m) decreases while simulating the optimal IAA production. Glyceraldehyde 3-phosphate (G3P) and erythrose 4-phosphate (E4P) are primary metabolic precursors for the synthesis of this phytohormone; therefore, their intracellular concentration must increase as the metabolism is diverting resources towards obtaining these precursors [15].
Figure 6 shows the computational analysis of the variation of the flux through a reaction of interest and the optimal value of the objective function calculated for each variation, allowing to evaluate how sensitive the objective function is to this particular reaction. The analysis predicts the changes and directionality of the metabolism; as it predicts how the biomass concentration should vary in the formation of a specific metabolite, in this case, an increase in biomass impacts the formation of IAA. From the predicted values, the formation of IAA increases as the growth rate decreases, improving the consumption of Trp, diverting the incorporation of this amino acid to essential proteins and being free for synthesis as it begins to produce IAA in a state where biomass is still being formed.

3.4.2. Double Robustness Analysis

To evaluate the changes in the oxygen and propionate uptake in the IAA production, the double robustness analysis is presented in Figure 7. The surface graph presents the flux towards IAA as a function of oxygen and propionate uptakes (negative values), the maximum flux value of IAA is predicted when oxygen uptake has the maximum value, but not for propionate uptake. For this simulation, the Trp uptake flux was fixed, and the excess of propionate does not imply an increment in IAA. On the other hand, the increase in O2 availability increases the activity of the enzyme Trp 2-monooxygenase allowing a greater synthesis of IAA.

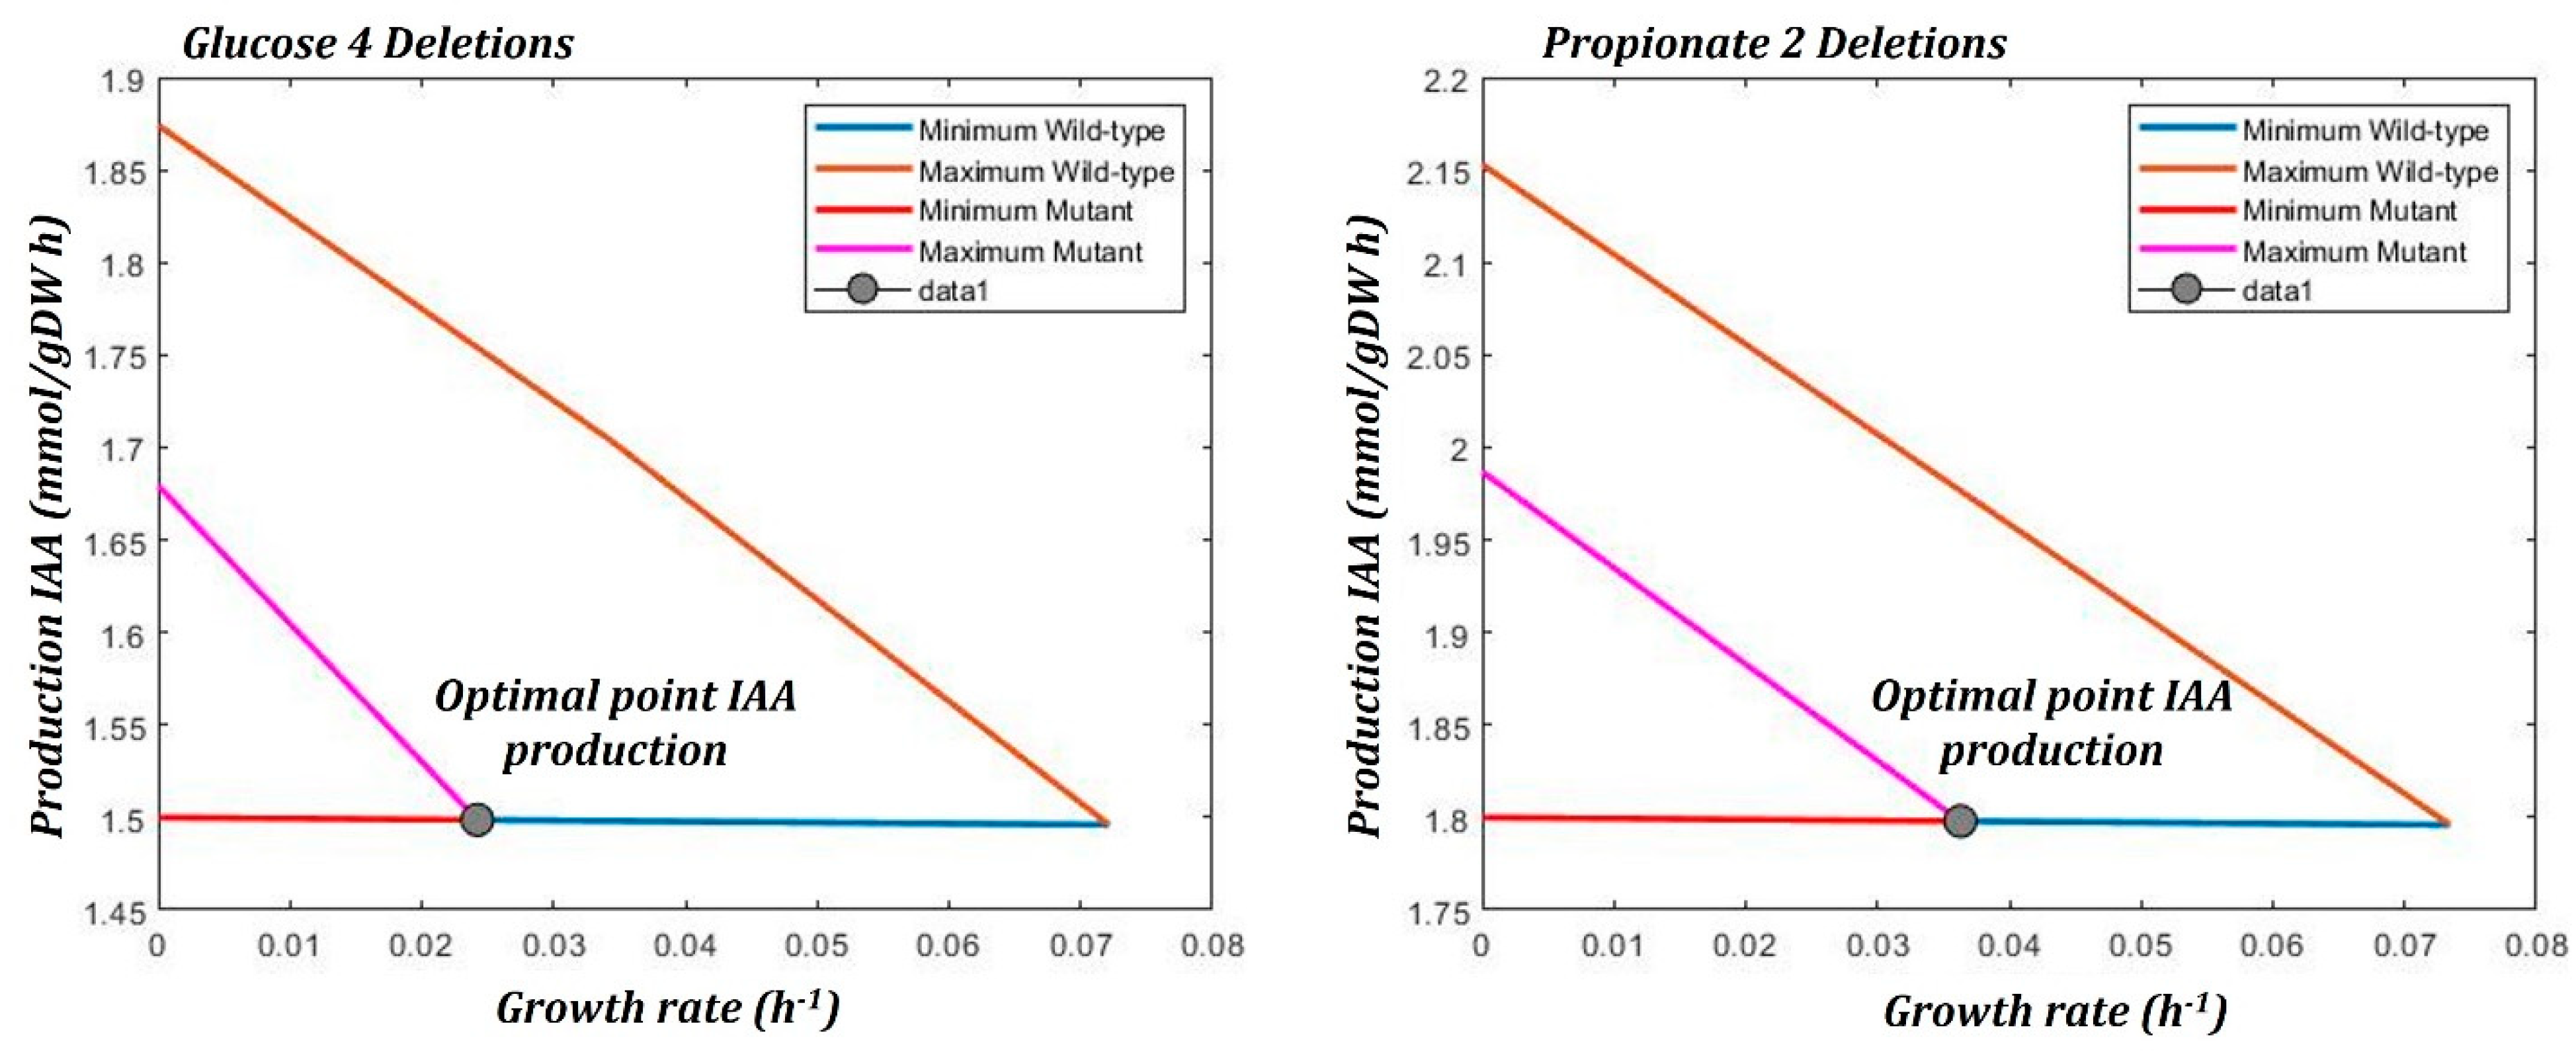
3.4.3. Single Gene Deletion

A total of 271 essential genes were reported experimentally for B. subtilis by Kobayashu et al. [41] and 257 by Koo et al. [42] when it was cultivated in the LB medium at 37 °C. In the gene deletion analysis during the simulation of growth in propionate to overproduce IAA, we identified 249 essential genes (See supplementary material 8). The IAA production during the simulation with the model iBSU 1147 + 1 using propionate and Trp was 1.71 mmol/(gDW h), converting the 97.5 % of the Trp flux considered in the simulations. As can be seen in Appendix B, when applying the gene elimination strategy, the maximum flux of IAA that is achieved is 2.18 mmol/(gDW h). IAA overproduction is achieved by deleting 13 genes individually in the model, that is, one at a time as it is a deletion strategy. The highest production of IAA is achieved when the trpA (BSU13350) and or splB (BSU13930) genes are deleted. The first of these elements encodes a chain tryptophan synthase enzyme and, in the model, this enzyme participates in the formation of Trp from L-serine, or vice versa, due to the fact that it is bidirectionally annotated. Therefore, when Trp is found in the medium, the formation of L-serine from Trp is favored, deviating the production of IAA. The splB gene according to the SubtiWiki database is associated with sporulation processes [43], but in the model, it is found as a gene associated with the enzyme that catalyzes the interconversion reaction between pyruvate and iso-chorismate metabolites related to the synthesis of chorismate. Out of the remaining candidate genes to be eliminated, there are seven elements that participate in the synthesis of teichoic acid and although the elimination strategy considers them non-essential, these are reported as essential genes for growth in LB medium in the SubtiWiki database, so they should not be removed.

3.4.4. Phenotype Phase Plane Analysis

The modified iBSU1147 genomic-scale metabolic model generates a Phenotype Phase Plane analysis (PhPP) which describes the metabolic transition of B. subtilis depending on the availability of sodium propionate and IAA production. The three-dimensional response surface corresponds to the growth rate variation for each pair of rates of propionate uptake and IAA formation in the x–y plane, see Figure 8. All flux distributions in the metabolism of B. subtilis are limited to a solution region where each distribution reflects a feasible metabolic flux [44]. In this particular case, we were interested in the relationship between the qs of the propionate and the growth rate during the pseudo-stationary phase and during the formation of the product. As shown in Figure 8, low values of propionate uptake are not enough to complete the metabolic functions required for cell maintenance and production of IAA. As this rate value increases, the growth rate begins to increase linearly.

3.4.5. Bilevel Optimization

The bilevel optimization algorithm, OptKnock, predicts those reactions that can be deleted in order to increase the IAA production maintaining the maximum level of growth rate. Table 2 contains the set of reactions that can be deleted and slightly increases the IAA production maintaining the optimal growth rate. The strategies using propionate predict higher productivity compared to those predicted when glucose is consumed.
The deletion strategies from Table 2 consider the deletion of the malate dehydrogenase, mdh and the multimeric enzyme alpha-ketoglutarate dehydrogenase codified by the genes odhA, odhB, pdhD [45,46]. The set of genes is not considered essential in B. subtilis.
Other strategies are the deletion of the ribulose-5′phosphate epimerase and the fructokinase. These two reactions are associated with the production of intermediates of the shikimate pathway, essential to produce Trp. The deletion of the gene pfkA conducts to the accumulation of fructose-6-phosphate.
Figure 9 presents the solutions found from OptKnock. The lines are the limits when maximizing and minimizing the IAA production in the mutant and wild type network with their respective biomass yield, this is, when the IAA production is maximized or minimized the biomass production is calculated. It can be seen that in either network, wild type and mutant, the linear relationship has a similar dependency. The optimal point lies on the horizontal edge of the optimization front and indicates that the maximization of biomass and IAA production are coupled in the scenarios when two and four deletions are made, see Table 2.

4. Discussion

IAA production in B. subtills is Trp dependent. Despite this dependency, the productivity and yield variates according to the carbon sources. The cultivation under controlled conditions of pH and temperature demonstrates that propionate improves the metabolism for IAA production, (see Table 1). According to the flux distribution, the incorporation of propionate through the methylcitric acid pathway modifies the activity in the TCA providing a metabolic precursor for IAA. The product formation is favored during the stationary growth phase, where the characteristic is a low value in the growth rate. Under this physiological condition, the IAA production is favored, the experimental observations and the computational prediction support this conclusion. With robustness analyses, the effect related to the increment of IAA production vs. the decrease in the specific growth rate can be associated to the nature of secondary metabolism that produces the indole derivatives, such as indole-3-acetamide and IAA. Another parameter that was computationally evaluated is the impact of oxygen consumption, as the presence of this metabolite with different O2 radicals negatively affecting the synthesis of IAA because Trp; these oxidations can result in the formation of a mixture of several products and prevent the conservation of the indole ring and therefore, cannot participate in the synthesis of IAA [47]. In addition, O2 is essential to carry out oxidative phosphorylation, it can be seen that basal O2 consumption must be present to promote sodium propionate metabolism. Hu et al. [48] and Junne et al. [49] used batch culture strategies to observe the attribution of oxygen consumption in the formation of a determined product and how its availability could constitute a limiting factor. In both studies, it can be seen that an increment in the consumption of O2 also conducts an increment in substrate consumption, so the availability of this gas is essential for the optimal use of sodium propionate and the formation of IAA. The evolution of the different phenotypic phase planes shows which changes are manifested in the cell as a function of the environmental variables such as propionate uptake and IAA production. Therefore, this type of analysis allows us to see how different external perturbations significantly impact the phenotype of a strain, and therefore, in the formation of a product of interest. Based on this observation, an excess in propionate uptake is not a variable that impacts the IAA productions. Therefore, the modulation in propionate uptake and growth rate can result in the optimal production of IAA.
To have a dimension of the potential of IAA production using propionate and minimal media we can compare our results with the previously reported, see Table 3.
In metabolic engineering, one of the strategies to improve product formation is the deletion of selected genes. Single-gene deletion analysis suggests a strategy based on the elimination of reactions for the overproduction of specific compounds, with this strategy it was possible to identify 13 genes, from this list the most relevant are the genes related to de novo synthesis of tryptophan, see Appendix B. On the other hand, we identified that 249 genes are essential for IAA production (see Supplementary material 8). Based on multilevel optimization, other deletion strategies were found to increase IAA production; nevertheless, in this case, it is important to be cautious as there is a strong objective coupling between the maximization of IAA production and the maximization of cell production.
Several parameters increase the production of IAA, among them are, greater availability of oxygen, the consumption of Trp and the carbon source, and the optimization of the production pathway of this metabolite. Considering the results presented, possible strategies for the overproduction of IAA might be viable using Bacillus subtilis [51]. The insertion of genes such as iaaM (tryptophan monooxygenase) with greater efficiency to favor the formation of IAA from IAM, as it was proposed by Defez et al. [52]. Another strategy is the modification in regulatory pathways, for instance, the engineering of transcription factors and the dynamic regulation of the trpEDCBA operon and its control elements such as the trpR repressor protein, as well as the engineering of amino acid transport systems inside the cell [53]. On the one hand, strategies that increase the intracellular concentration of essential metabolites for Trp synthesis pathways such as PEP and E4P are added to pathway control. According to the results obtained through OptKnock, genes such as malate dehydrogenase (mdh) or pyruvate kinase (pyk) can be eliminated and in this way avoid the consumption of PEP [54].

Supplementary Materials

The following supporting information can be downloaded at: https://www.mdpi.com/article/10.3390/microorganisms10122352/s1. These are the supplementary materials that are included in the manuscript: Supplementary material 1—Excel file that includes the information on the growth kinetics in the flask experiments (“biological replicates”). Technical replicates on HPLC measurements for substrate consumption and IAA production, as well as statistical analysis. Supplementary material 2—Excel file that include Curve Pattern Standard. Supplementary material 3—Flux Balance Analysis Programming Code. Supplementary material 4—OptKnock Programming Code. =Supplementary material 5—Single gene deletion. Robustness Analysis (Programming code). Supplementary material 6—Genome scale metabolic models iBSU1147+1 [.mat]. Supplementary material 7—Genome scale metabolic models iBSU1147+1 [.xls]. Supplementary material 8—Excel file that include Single Gene Deletion analysis.

Author Contributions

Conceptualization, R.O.-H., F.C.-A., A.Q.-M.; methodology, F.C.-A., A.Q.-M., G.V.-R.; formal analysis, F.C.-A., A.Q.-M.; investigation, R.O.-H.; resources, G.V.-R.; writing—original draft preparation, F.C.-A., A.Q.-M., R.O.-H.; writing—review and editing, R.O.-H., G.V.-R., L.M.R.-C., A.M.S.-C.; funding acquisition, R.O.-H., A.M.S.-C. All authors have read and agreed to the published version of the manuscript.

Funding

To CONACYT-México for the postgraduate scholarship granted to Freddy Castillo Alfonso (CVU 943715) and Alejandro Quintana Menendez (CVU 1109377) and for the financing through the project A1-S-30750.

Data Availability Statement

Not applicable.

Acknowledgments

We acknowledge to Universidad Autónoma Metropolitana, Campus Cuajimalpa for the facilities to perform the experiments. To Juan Carlos Sigala Alanís for providing the strain.

Conflicts of Interest

The authors declare no conflict of interest. The funders had no role in the design of the study; in the collection, analyses, or interpretation of data; in the writing of the manuscript; or in the decision to publish the results.

Appendix A

Table A1. List of reactions used for the flux analysis in the metabolic pathway.
glucose –> or propionate –>
g6p <=> f6p
atp + f6p <=> adp + f1,6bf
f1,6bf <=> g3p + dhp
g3p + nad + pi <=> 1,3dpg + h + nadh
atp + h + 3pg <=> adp + 1,3dpg
2pg <=> 3pg
3pg <=> h2o + pep
adp + pep <=> atp + pyr
pyr + Coa + nad <=> acoa + nadh + co_2
ACoa + h_2o + oaa <=> h + coa + cit
cit <=> acon-C + h_2o
acon-C + h_2o <=> icit
icit + nadp <=> akg + co_2 + nadph
akg + Coa + nadh –> co_2 + nadh + succoa
atp + Coa + succ <=> adp + pi + succoa
q8 + succ –> fum + q8h2
fum + h_2o <=> mal
mal + nad => h + nadh + oaa
atp + oaa –> adp + co_2 + pep
atp +pyr <=> adp + p_i + h + oaa
mal-L + nad –> co_2 + nadh + pyr
mal-L + nadp –> co_2 + nadph + pyr
g6p + nadp <=> 6pgl + h + nadph
6pgc + nadp –> co_2 + nadph + ru5p
ru5p <==> xu5p
r5p <=> ru5p
e4p + xu5p <=> f6p + g3p
g3p + sh7p <=> f6p + e4p
ser + igp <=> g3p + h_2o + trp
tryptophan –>
trp <=> iam
h_2o + iam <=> nh_4 + iaa

Appendix B

Table A2. List of genes from the Single Gene Deletion analysis.
LocusFluxProtein
BSU133502.18tryptophan synthase alpha chain
BSU139302.18undespore photoproduct lyase
BSU219202.15processive diacylglycerol glucosyltransferase
BSU357601.77glycerol phosphate glycerophosphotransferase
BSU356601.77UDP-N-acetylglucosamine 2-epimerase
BSU357001.77ABC transporter
BSU357101.77ABC transporter
BSU35721.75glycerol-phosphotransferase
BSU355301.75GlcNAc-1-phosphate transferase
BSU357501.74UDP-N-acetyl-D-mannosamine transferase
BSU357301.72polyglycerol phosphate GlcNAc-1-phosphate transferase
BSU357501.74UDP-N-acetyl-D-mannosamine transferase
BSU357301.72polyglycerol phosphate glucosyltransferase

References

  1. Brumos, J.; Robles, L.M.; Yun, J.; Vu, T.C.; Jackson, S.; Alonso, J.M.; Stepanova, A.N. Local Auxin Biosynthesis Is a Key Regulator of Plant Development. Dev. Cell 2018, 47, 306–318.e5. [Google Scholar] [CrossRef] [Green Version]
  2. Grossmann, K. Auxin Herbicides: Current Status of Mechanism and Mode of Action. Pest. Manag. Sci. 2010, 66, 113–120. [Google Scholar] [CrossRef] [PubMed]
  3. Dobbelaere, S.; Vanderleyden, J.; Okon, Y. Plant Growth-Promoting Effects of Diazotrophs in the Rhizosphere. Crit. Rev. Plant Sci. 2003, 22, 107–149. [Google Scholar] [CrossRef]
  4. Fischer, C.R.; Klein-Marcuschamer, D.; Stephanopoulos, G. Selection and Optimization of Microbial Hosts for Biofuels Production. Metab. Eng. 2008, 10, 295–304. [Google Scholar] [CrossRef] [PubMed]
  5. Buffing, M.F.; Link, H.; Christodoulou, D.; Sauer, U. Capacity for Instantaneous Catabolism of Preferred and Non-Preferred Carbon Sources in Escherichia coli and Bacillus subtilis. Sci. Rep. 2018, 8, 11760. [Google Scholar] [CrossRef] [Green Version]
  6. Sridevi, M.; Yadav, N.C.S.; Mallaiah, K.V. Production of Indole-Acetic-Acid by Rhizobium Isolates from Crotalaria Species. Res. J. Microbiol. 2008, 3, 276–281. [Google Scholar] [CrossRef] [Green Version]
  7. Halmschlag, B.; Putri, S.P.; Fukusaki, E.; Blank, L.M. Poly-γ-Glutamic Acid Production by Bacillus subtilis 168 Using Glucose as the Sole Carbon Source: A Metabolomic Analysis. J. Biosci. Bioeng. 2020, 130, 272–282. [Google Scholar] [CrossRef]
  8. Rainey, F.; Kämpfer, P.; Trujillo, M.; Chun, J.; DeVos, P. Bergey’s Manual of Systematics of Archaea and Bacteria; Whitman, W.B., Ed.; Wiley: Hoboken, NJ, USA, 2015; Volume 410. [Google Scholar]
  9. Zhao, J.; Shimizu, K. Metabolic Flux Analysis of Escherichia coli K12 Grown on 13C-Labeled Acetate and Glucose Using GC-MS and Powerful Flux Calculation Method. J. Biotechnol. 2003, 101, 101–117. [Google Scholar] [CrossRef]
  10. Araújo, F.F.; Henning, A.A.; Hungria, M. Phytohormones and Antibiotics Produced by Bacillus subtilis and Their Effects on Seed Pathogenic Fungi and on Soybean Root Development. World J. Microbiol. Biotechnol. 2005, 21, 1639–1645. [Google Scholar] [CrossRef]
  11. Zaidi, S.; Usmani, S.; Singh, B.R.; Musarrat, J. Significance of Bacillus subtilis Strain SJ-101 as a Bioinoculant for Concurrent Plant Growth Promotion and Nickel Accumulation in Brassica Juncea. Chemosphere 2006, 64, 991–997. [Google Scholar] [CrossRef]
  12. Wang, C.; Zhao, D.; Qi, G.; Mao, Z.; Hu, X.; Du, B.; Liu, K.; Ding, Y. Effects of Bacillus velezensis FKM10 for Promoting the Growth of Malus hupehensis Rehd. and Inhibiting Fusarium verticillioides. Front. Microbiol. 2020, 10, 2889. [Google Scholar] [CrossRef]
  13. Escobar Diaz, P.A.; Gil, O.J.A.; Barbosa, C.H.; Desoignies, N.; Rigobelo, E.C. Aspergillus spp. and Bacillus spp. as Growth Promoters in Cotton Plants Under Greenhouse Conditions. Front. Sustain. Food Syst. 2021, 5, 709267. [Google Scholar] [CrossRef]
  14. Myo, E.M.; Ge, B.; Ma, J.; Cui, H.; Liu, B.; Shi, L.; Jiang, M.; Zhang, K. Indole-3-Acetic Acid Production by Streptomyces fradiae NKZ-259 and Its Formulation to Enhance Plant Growth. BMC Microbiol. 2019, 19, 155. [Google Scholar] [CrossRef] [PubMed] [Green Version]
  15. Wu, H.; Yang, J.; Shen, P.; Li, Q.; Wu, W.; Jiang, X.; Qin, L.; Huang, J.; Cao, X.; Qi, F. High-Level Production of Indole-3-Acetic Acid in the Metabolically Engineered Escherichia coli. J. Agric. Food Chem. 2021, 69, 1916–1924. [Google Scholar] [CrossRef] [PubMed]
  16. Bunsangiam, S.; Thongpae, N.; Limtong, S.; Srisuk, N. Large Scale Production of Indole-3-Acetic Acid and Evaluation of the Inhibitory Effect of Indole-3-Acetic Acid on Weed Growth. Sci. Rep. 2021, 11, 13094. [Google Scholar] [CrossRef] [PubMed]
  17. Gu, C.; Kim, G.B.; Kim, W.J.; Kim, H.U.; Lee, S.Y. Current Status and Applications of Genome-Scale Metabolic Models. Genome Biol. 2019, 20, 121. [Google Scholar] [CrossRef] [PubMed] [Green Version]
  18. Orth, J.D.; Thiele, I.; Palsson, B.O. What Is Flux Balance Analysis? Nat. Biotechnol. 2010, 28, 245–248. [Google Scholar] [CrossRef] [PubMed]
  19. Mendoza, S.N.; Olivier, B.G.; Molenaar, D.; Teusink, B. A Systematic Assessment of Current Genome-Scale Metabolic Reconstruction Tools. Genome Biol. 2019, 20, 158. [Google Scholar] [CrossRef] [Green Version]
  20. Lularevic, M.; Racher, A.J.; Jaques, C.; Kiparissides, A. Improving the Accuracy of Flux Balance Analysis through the Implementation of Carbon Availability Constraints for Intracellular Reactions. Biotechnol. Bioeng. 2019, 116, 2339–2352. [Google Scholar] [CrossRef]
  21. Burgard, A.P.; Pharkya, P.; Maranas, C.D. Optknock: A Bilevel Programming Framework for Identifying Gene Knockout Strategies for Microbial Strain Optimization. Biotechnol. Bioeng. 2003, 84, 647–657. [Google Scholar] [CrossRef]
  22. He, M.; Wen, J.; Yin, Y.; Wang, P. Metabolic Engineering of Bacillus subtilis Based on Genome-Scale Metabolic Model to Promote Fengycin Production. 3 Biotech 2021, 11, 448. [Google Scholar] [CrossRef] [PubMed]
  23. Costanza, J.; Carapezza, G.; Angione, C.; Liò, P.; Nicosia, G. Multi-Objective Optimisation, Sensitivity and Robustness Analysis in FBA Modelling. In Lecture Notes in Computer Science (including Subseries Lecture Notes in Artificial Intelligence and Lecture Notes in Bioinformatics); Springer: Heidelberg, Germany, 2012; Volume 7605. [Google Scholar]
  24. Karimi, E.; Geslain, E.; Belcour, A.; Frioux, C.; Aïte, M.; Siegel, A.; Corre, E.; Dittami, S.M. Robustness Analysis of Metabolic Predictions in Algal Microbial Communities Based on Different Annotation Pipelines. PeerJ 2021, 9, e11344. [Google Scholar] [CrossRef] [PubMed]
  25. Edwards, J.S.; Palsson, B.O. Robustness Analysis of the Escherichia coli Metabolic Network. Biotechnol. Prog. 2000, 16, 927–939. [Google Scholar] [CrossRef]
  26. Edwards, J.S.; Ramakrishna, R.; Palsson, B.O. Characterizing the Metabolic Phenotype: A Phenotype Phase Plane Analysis. Biotechnol. Bioeng. 2002, 77, 27–36. [Google Scholar] [CrossRef]
  27. Iman, M.; Sobati, T.; Panahi, Y.; Mobasheri, M. Systems Biology Approach to Bioremediation of Nitroaromatics: Constraint-Based Analysis of 2,4,6-Trinitrotoluene Biotransformation by Escherichia coli. Molecules 2017, 22, 1242. [Google Scholar] [CrossRef] [PubMed] [Green Version]
  28. Salleh, A.H.M.; Mohamad, M.S.; Deris, S.; Omatu, S.; Fdez-Riverola, F.; Corchado, J.M. Gene Knockout Identification for Metabolite Production Improvement Using a Hybrid of Genetic Ant Colony Optimization and Flux Balance Analysis. Biotechnol. Bioprocess Eng. 2015, 20, 685–693. [Google Scholar] [CrossRef]
  29. Heirendt, L.; Arreckx, S.; Pfau, T.; Mendoza, S.N.; Richelle, A.; Heinken, A.; Haraldsdóttir, H.S.; Wachowiak, J.; Keating, S.M.; Vlasov, V.; et al. Creation and Analysis of Biochemical Constraint-Based Models Using the COBRA Toolbox v.3.0. Nat. Protoc. 2019, 14, 639–702. [Google Scholar] [CrossRef] [PubMed] [Green Version]
  30. Castillo Alfonso, F.; Vigueras-Ramírez, G.; Rosales-Colunga, L.M.; del Monte-Martínez, A.; Olivares Hernández, R. Propionate as the Preferred Carbon Source to Produce 3-Indoleacetic Acid In B. subtilis: Comparative Flux Analysis Using Five Carbon Sources. Mol. Omics 2021, 17, 554–564. [Google Scholar] [CrossRef]
  31. Glickmann, E.; Dessaux, Y. A Critical Examination of the Specificity of the Salkowski Reagent for Indolic Compounds Produced by Phytopathogenic Bacteria. Appl. Environ. Microbiol. 1995, 61, 793–796. [Google Scholar] [CrossRef] [Green Version]
  32. Hao, T.; Han, B.; Ma, H.; Fu, J.; Wang, H.; Wang, Z.; Tang, B.; Chen, T.; Zhao, X. In Silico Metabolic Engineering of Bacillus Subtilis for Improved Production of Riboflavin, Egl-237, (R,R)-2,3-Butanediol and Isobutanol. Mol. Biosyst. 2013, 9, 2034–2044. [Google Scholar] [CrossRef]
  33. Streif, S.; Kim, K.K.K.; Rumschinski, P.; Kishida, M.; Shen, D.E.; Findeisen, R.; Braatz, R.D. Robustness Analysis, Prediction, and Estimation for Uncertain Biochemical Networks: An Overview. J. Process Control 2016, 42, 14–34. [Google Scholar] [CrossRef]
  34. Anand, S.; Mukherjee, K.; Padmanabhan, P. An Insight to Flux-Balance Analysis for Biochemical Networks. Biotechnol. Genet. Eng. Rev. 2020, 36, 32–55. [Google Scholar] [CrossRef]
  35. Price, N.D.; Reed, J.L.; Palsson, B.Ø. Genome-Scale Models of Microbial Cells: Evaluating the Consequences of Constraints. Nat. Rev. Microbiol. 2004, 2, 886–897. [Google Scholar] [CrossRef] [PubMed]
  36. Pharkya, P.; Burgard, A.P.; Maranas, C.D. Exploring the overproduction of amino acids using the bilevel optimization framework OptKnock. Biotechnol. Bioeng. 2003, 84, 887–899. [Google Scholar] [CrossRef] [PubMed] [Green Version]
  37. McKight, P.E.; Najab, J. Kruskal-Wallis Test. In The Corsini Encyclopedia of Psychology; John Wiley & Sons, Inc.: Hoboken, NJ, USA, 2010. [Google Scholar]
  38. Anderson, D.R.; Sweeney, D.J.; Williams, T.A.; Camm, J.D.; Cochran, J.J. Modern Business Statistics with Microsoft Excel; Cengage Learning: Boston, MA, USA, 2020; ISBN 0357131525. [Google Scholar]
  39. Doyle, J.S.H. Towards the Stereoselective Syntheses of 2-Methylcitrate and 2-Methylisocitrate and Their Use in Studying the Methylcitric Acid Cycle in Bacillus subtilis; The University of North Carolina at Greensboro: Greensboro, NC, USA, 2018; ISBN 0438087801. [Google Scholar]
  40. Sander, T.; Farke, N.; Diehl, C.; Kuntz, M.; Glatter, T.; Link, H. Allosteric Feedback Inhibition Enables Robust Amino Acid Biosynthesis in E. Coli by Enforcing Enzyme Overabundance. Cell Syst. 2019, 8, 66–75.e8. [Google Scholar] [CrossRef] [PubMed] [Green Version]
  41. Kobayashi, K.; Ehrlich, S.D.; Albertini, A.; Amati, G.; Andersen, K.K.; Arnaud, M.; Asai, K.; Ashikaga, S.; Aymerich, S.; Bessieres, P.; et al. Essential Bacillus subtilis Genes. Proc. Natl. Acad. Sci. USA 2003, 100, 4678–4683. [Google Scholar] [CrossRef] [PubMed] [Green Version]
  42. Koo, B.-M.; Kritikos, G.; Farelli, J.D.; Todor, H.; Tong, K.; Kimsey, H.; Wapinski, I.; Galardini, M.; Cabal, A.; Peters, J.M.; et al. Construction and Analysis of Two Genome-Scale Deletion Libraries for Bacillus subtilis. Cell Syst. 2017, 4, 291–305.e7. [Google Scholar] [CrossRef]
  43. Michna, R.H.; Zhu, B.; Mäder, U.; Stülke, J. SubtiWiki 2.0—An Integrated Database for the Model Organism Bacillus subtilis. Nucleic Acids Res. 2016, 44, D654–D662. [Google Scholar] [CrossRef] [PubMed] [Green Version]
  44. Boele, J.; Olivier, B.G.; Teusink, B. FAME, the Flux Analysis and Modeling Environment. BMC Syst. Biol. 2012, 6, 8. [Google Scholar] [CrossRef] [PubMed] [Green Version]
  45. Kanehisa, M.; Sato, Y.; Kawashima, M. KEGG Mapping Tools for Uncovering Hidden Features in Biological Data. Protein Sci. 2022, 31, 47–53. [Google Scholar] [CrossRef] [PubMed]
  46. Bateman, A. UniProt: A Worldwide Hub of Protein Knowledge. Nucleic Acids Res. 2019, 47, D506–D515. [Google Scholar] [CrossRef] [Green Version]
  47. Ehrenshaft, M.; Deterding, L.J.; Mason, R.P. Tripping up Trp: Modification of Protein Tryptophan Residues by Reactive Oxygen Species, Modes of Detection, and Biological Consequences. Free Radic. Biol. Med. 2015, 89, 220–228. [Google Scholar] [CrossRef] [PubMed] [Green Version]
  48. Hu, J.; Lei, P.; Mohsin, A.; Liu, X.; Huang, M.; Li, L.; Hu, J.; Hang, H.; Zhuang, Y.; Guo, M. Mixomics Analysis of Bacillus Subtilis: Effect of Oxygen Availability on Riboflavin Production. Microb. Cell Fact. 2017, 16, 150. [Google Scholar] [CrossRef] [PubMed]
  49. Junne, S.; Klingner, A.; Kabisch, J.; Schweder, T.; Neubauer, P. A Two-Compartment Bioreactor System Made of Commercial Parts for Bioprocess Scale-down Studies: Impact of Oscillations on Bacillus subtilis Fed-Batch Cultivations. Biotechnol. J. 2011, 6, 1009–1017. [Google Scholar] [CrossRef]
  50. Sivasakthi, S.; Kanchana, D.; Usharani, G.; Saranraj, P. Production of plant growth promoting substance by Pseudomonas fluorescens and Bacillus subtilis isolates from paddy rhizosphere soil of Cuddalore District, Tamil Nadu, India. Int. J. Microbiol. Res. 2013, 4, 227–233. [Google Scholar]
  51. Duca, D.; Lorv, J.; Patten, C.L.; Rose, D.; Glick, B.R. Indole-3-Acetic Acid in Plant–Microbe Interactions. Antonie Van Leeuwenhoek 2014, 106, 85–125. [Google Scholar] [CrossRef]
  52. Defez, R.; Andreozzi, A.; Bianco, C. The Overproduction of Indole-3-Acetic Acid (IAA) in Endophytes Upregulates Nitrogen Fixation in Both Bacterial Cultures and Inoculated Rice Plants. Microb. Ecol. 2017, 74, 441–452. [Google Scholar] [CrossRef]
  53. Niu, H.; Li, R.; Liang, Q.; Qi, Q.; Li, Q.; Gu, P. Metabolic Engineering for Improving L-tryptophan Production in Escherichia coli. J. Ind. Microbiol. Biotechnol. 2019, 46, 55–65. [Google Scholar] [CrossRef]
  54. Zuo, S.; Xiao, J.; Zhang, Y.; Zhang, X.; Nomura, C.T.; Chen, S.; Wang, Q. Rational Design and Medium Optimization for Shikimate Production in Recombinant Bacillus licheniformis Strains. Process Biochem. 2018, 66, 19–27. [Google Scholar] [CrossRef]
Figure 1. Cultivation kinetics of B. subtilis using glucose and propionate as carbon sources. Minimal media M9 was used, and tryptophan added at 16 h.
Microorganisms 10 02352 g001
Figure 2. Kinetics of tryptophan consumption and IAA production using glucose and propionate as carbon source.
Microorganisms 10 02352 g002
Figure 3. Flux distribution in the central carbon metabolism. Numbers in black are the fluxes when glucose is the carbon source and blue numbers when propionate is the carbon source. These fluxes are calculated in the stationary growth phase with units of mmol/(gDW h). The set of reactions are annotated in Appendix A.
Microorganisms 10 02352 g003
Figure 4. Metabolic pathway and fluxes for the incorporation of propionate to central carbon metabolism.
Microorganisms 10 02352 g004
Figure 5. Normalized fluxes as a function of specific growth rate, in this case, represented as dilution rate. The consumption rates of sodium propionate (qs) are 3.5, 3.0 and 2.5 mmol/L corresponding to the specific growth rates m of 0:06, 0:08 and 0:10 h−1, respectively. Fluxes were normalized based on the propionate consumption rates and represented as percentage.
Microorganisms 10 02352 g005
Figure 6. Simple robustness analysis of IAA formation metabolism and propionate consumption as a function of growth rate. Negative values of the propionate uptake are indicating that this substrate is consumed.
Microorganisms 10 02352 g006
Figure 7. Double robustness analysis of IAA production rate as a function of propionate uptake and O2 consumption. Negative values of the propionate and oxygen uptake are indicating that these substrates are consumed.
Microorganisms 10 02352 g007
Figure 8. Phenotype Phase Plane analysis of propionate metabolism as a function of biomass and IAA production.
Microorganisms 10 02352 g008
Figure 9. Graphs obtained from the simulation with OptKnock. The intersection point corresponds to the optimal solution.
Microorganisms 10 02352 g009
Table 1. Kinetics parameters of Bacillus subtilis cultivation in a 3 L bioreactor comparing two carbon sources, glucose and propionate.
ParameterGlucosePropionate
μexp0.15 ± 0.060.14 ± 0.02
μstat0.07 ± 0.120.06 ± 0.04
qs,exp2.15 ± 0.084.18 ± 0.04
qs,stat1.2 ± 0.032.85 ± 0.01
qs,Trp1.5 ± 0.051.8 ± 0.02
qp,IAA1.33 ± 0.021.92 ± 0.07
Yx/s0.324 ± 0.050.219 ± 0.08
Yx/(s+Trp)0.134 ± 0.110.094 ± 0.06
Yp/(s+Trp)0.446 ± 0.030.524 ± 0.04
Yp/Trp0.761 ± 0.040.915 ± 0.03
Specific growth rates (μ) have units of h−1, specific rates (q) have units of mmol/(gDW h). Yields have units of g/g. Subindexes are, substrate (s) and product IAA (p).
Table 2. Sets of candidate reactions to be deleted with potential increase in the production of IAA while maintaining optimal biomass production.
GLUCOSEMax ⱱbio
No. DelKnockoutsEnzymeBiomass (h−1)IAA (mmol/gDW h)
0“Wild type”-------0.11.496
21. FDP <=> DHAP + G3P
2. MAL <=> FUM + H2O
Fructose bisphosphate aldolase (fbaA)
Fumarase (citG)
0.071.4992
31. 2PG <=> H2O + PEP
2. MAL <=> FUM + H2O
3. G6P <=> F6P
Enolase (eno)
Fumarase (citG)
Glucose-6-phosphate isomerase (pgi)
0.041.51
41. MAL + NAD <=> OAA + H + NADH
2. RU5P <=> XU5P
3. AKG + NAD + CoA<=> SUC-CoA + CO2 + NADH
4. F6P + ATP -> FDP + ADP
Malate dehydrogenase (mdh)
Ribulose-5-phosphate epimerase (rpe)
α-Ketoglutarate dehydrogenase (odhB)
Phosphofructokinase (pfkA)
0.041.61
PROPIONATEMax ⱱbio
No. DelKnockoutsEnzymeBiomass (h−1)IAA (mmol/gDW h)
0“Wild type”-------0.11.796
21. MAL + NAD <=> OAA + H + NADH
2. SUC-CoA + GDP + HPO4 <=> SUC + GTP + CoA
Malate dehydrogenase (mdh)
Succinyl-CoA synthetase (sucCD)
0.061.798
31. MAL + NAD <=> OAA + H + NADH
2. 2PG <=> H2O + PEP
3. AKG + NAD + CoA<=> SUC-CoA + CO2 + NADH
Malate dehydrogenase (mdh)
Enolase (eno)
α-Ketoglutarate dehydrogenase (odhB)
0.031.798
51. AKG + ALA <=> GLU + PYR
2. MAL + NAD <=> OAA + H + NADH
3. 2PG <=> H2O + PEP
4. AKG + VAL <=> GLU + 3M-2-OB
5. AKG + NAD + CoA<=> SUC-CoA + CO2 + NADH
Transaminase (alaT)
Malate dehydrogenase (mdh)
Enolase (eno)
Transaminase (ywaA)
α-Ketoglutarate dehydrogenase (odhB)
0.061.798
Table 3. Comparative table of IAA production by Bacillus subtilis in different culture media.
AuthorsConcentration (g/L)Medium
Araujo et al., 2005 [10]0.17Potato-dextrose (PDA)
Zaidi et al., 2006 [11]0.055M9 + Glucose
Sivasakthi et al., 2013 [50]0.025Agar Nutriente
Alfonso et al., 2021 [30]0.086M9 + Propionate
This work0.31M9 + Propionate
Publisher’s Note: MDPI stays neutral with regard to jurisdictional claims in published maps and institutional affiliations.

