
Exploring the Nutritional Potential of Wild Grass Fodder for Mega Herbivore (Elephas maximus) in the Foothills of Western Ghats
 , ,
, ,
Abstract
:Simple Summary
Abstract

1. Introduction
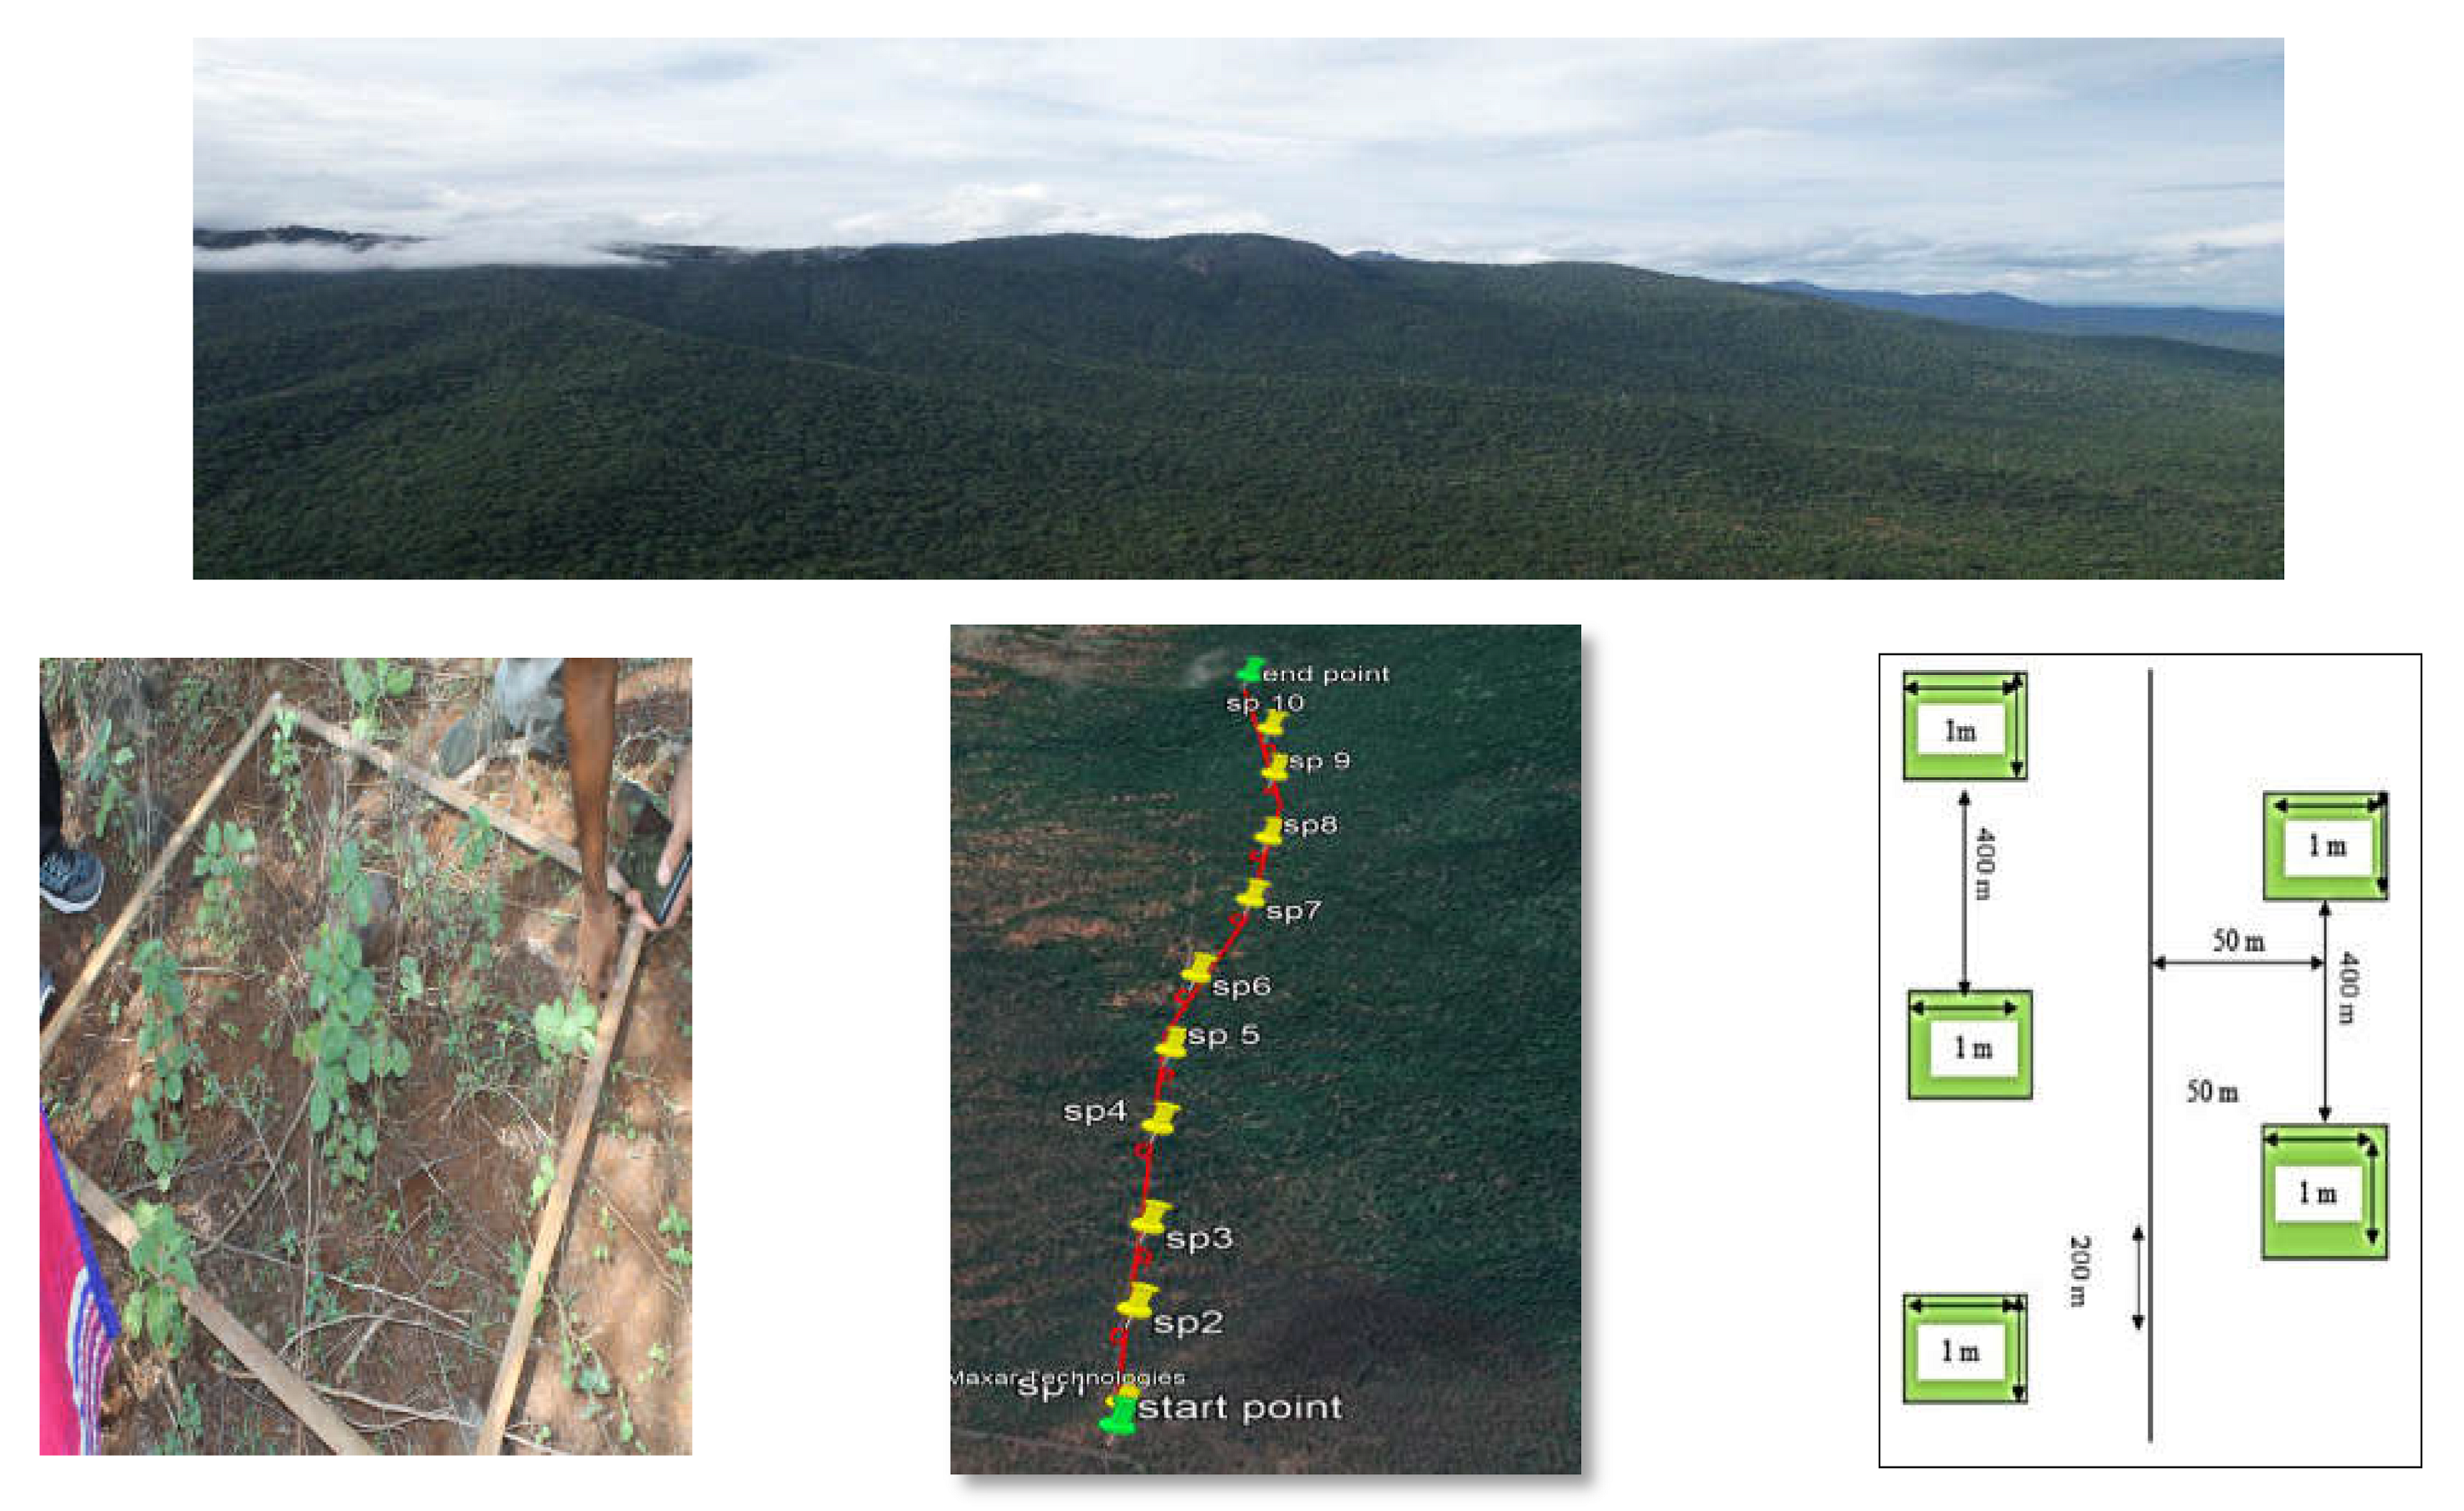
2. Materials and Methods
3. Results
4. Discussion
5. Conclusions
Author Contributions
Funding
Institutional Review Board Statement
Informed Consent Statement
Data Availability Statement
Acknowledgments
Conflicts of Interest
References
- Sukumar, R. The Living Elephants: Evolutionary Ecology, Behaviour, and Conservation; Oxford University Press: Oxford, UK, 2003. [Google Scholar]
- Wilmshurst, J.F.; Fryxell, J.M.; Bergman, C.M. The allometry of patch selection in ruminants. Proc. R. Soc. B Boil. Sci. 2000, 267, 345–349. [Google Scholar] [CrossRef] [PubMed] [Green Version]
- Gubbi, S.; Swaminath, M.H.; Poornesha, H.C.; Bhat, R.; Raghunath, R. An elephantine challenge: Human–elephant conflict distribution in the largest Asian elephant population, southern India. Biodivers. Conserv. 2014, 23, 633–647. [Google Scholar] [CrossRef]
- Sukumar, R. A brief review of the status, distribution and biology of wild Asian elephants Elephas maximus. Int. Zoo Yearb. 2006, 40, 1–8. [Google Scholar] [CrossRef]
- WWF India. Glimpses of Initiatives Taken for Elephant Conservation in India (2012–2017) Based on Parliamentary Questions and Replies; ENVIS Centre WWF India and Project Elephant Division; MoEF and CC: New Delhi, India, 2017; pp. 14–15. [Google Scholar]
- Baskaran, N.; Balasubramanian, M.; Swaminathan, S.; Desai, A.A. Feeding ecology of the Asian elephant Elephas maximus Linnaeus in the Nilgiri Biosphere Reserve, southern India. J. Bombay Nat. Hist. Soc. 2010, 107, 3. [Google Scholar]
- Gor, S.H. Ethno-Medicinally Significant Grasses of Girnar Wildlife Sanctuary of Gujarat, India. Plant Arch. 2022, 22, 158–161. [Google Scholar] [CrossRef]
- Khude, V.S. Diversity studies of grasses around Arjunnagar. Plant Arch. 2016, 16, 477–478. [Google Scholar]
- Wood, K.A.; Hilton, G.M.; Newth, J.L.; Rees, E.C. Seasonal variation in energy gain explains patterns of resource use by avian herbivores in an agricultural landscape: Insights from a mechanistic model. Ecol. Model. 2019, 409, 108762. [Google Scholar] [CrossRef]
- Devos, A.; Mosby, H.D. Habitat Analysis and Evaluation in Wildlife Management Techniques; Giles, R.H., Ed.; The Wildlife Society: Washington, DC, USA, 1971. [Google Scholar]
- Achariyar, R.B. A handbook of some South Indian grasses. Montana 1921, 270, 205i. [Google Scholar]
- Association of Official Analytical Chemists; Association of Official Agricultural Chemists (US). Official Methods of Analysis of the Association of Official Analytical Chemists; The Association of Official Analytical Chemists: Gaithersburg, MD, USA, 2000. [Google Scholar]
- Van Soest, P.J. Nutritional Ecology of the Ruminant; Cornell University Press: Ithaca, NY, USA, 1994. [Google Scholar]
- Moran, J. Tropical Dairy Farming: Feeding Management for Small Holder Dairy Farmers in the Humid Tropics; Csiro Publishing: Clayton, Australia, 2005. [Google Scholar]
- Schroeder, J.W. Interpreting Forage Analysis; North Dakota State University: Fargo, ND, USA, 1994. [Google Scholar]
- Moore, J.E.; Undersander, D.J. Relative forage quality: An alternative to relative feed value and quality index. In Proceedings of the 13th Annual Florida Ruminant Nutrition Symposium, Gainesville, FL, USA, 10 January 2002; Volume 32, pp. 16–29. [Google Scholar]
- Khanum, S.A.; Yaqoob, T.; Sadaf, S.; Hussain, M.; Jabbar, M.A.; Hussain, H.N.; Kausar, R.; Rehman, S. Nutritional evaluation of various feedstuffs for livestock production using in vitro gas method. Pak. Vet. J. 2007, 27, 129. [Google Scholar]
- Hamid, A.; Singh, S.; Agrawal, M.; Agrawal, S.B. Effects of plant age on performance of the tropical perennial fodder grass, Cenchrus ciliaris L. subjected to elevated ultraviolet-B radiation. Plant Biol. 2020, 22, 805–812. [Google Scholar] [CrossRef]
- Faji, M.; Kebede, G.; Feyissa, F.; Mohammed, K.; Minta, M.; Mengistu, S.; Tsegahun, A. Evaluation of ten perennial forage grasses for biomass and nutritional quality. Trop. Grasslands-Forrajes Trop. 2021, 9, 292–299. [Google Scholar] [CrossRef]
- Gate, D.V.; Damame, S.V.; Gore, S.B. Assessment of forage nutritional quality of B x N hybrids between giant bajra and napier grass. Forage Res. 2018, 43, 279–282. [Google Scholar]
- Abebe, A.; Tolera, A.; Holand, Ø.; Ådnøy, T.; Eik, L.O. Seasonal variation in nutritive value of some browses and grass species in Borana rangeland, Southern Ethiopia. Trop. Subtrop. Agroecosyst. 2012, 15, 261–271. [Google Scholar]
- Adebayo, O.A.; Ibhaze, G.A.; Onibi, G.E. Impact of substituted mulberry (Morus alba) leaves with guinea grass (Panicum maximum) on feed intake, milk yield and composition of lactating West African Dwarf does. Anim. Res. Int. 2022, 19, 4281–4292. [Google Scholar]
- Karbivska, U.; Kurgak, V.; Gamayunova, V.; Butenko, A.; Malynka, L.; Kovalenko, I.; Onychko, V.; Masyk, I.; Chyrva, A.; Zakharchenko, E.; et al. Productivity and quality of diverse ripe pasture grass fodder depends on the method of soil cultivation. Acta Agrobot. 2020, 73, 1–11. [Google Scholar] [CrossRef]
- Al-Rowaily, S.L.; Abd-ElGawad, A.M.; Alghanem, S.M.; Al-Taisan, W.A.; El-Amier, Y.A. Nutritional value, mineral composition, secondary metabolites, and antioxidant activity of some wild geophyte sedges and grasses. Plants 2019, 8, 569. [Google Scholar] [CrossRef] [Green Version]
- Singh, G.P.; Oosting, S.J. A model for describing the energy value of straws. Indian Dairym. 1992, 44, 322–327. [Google Scholar]
- Faji, M.; Kebede, G.; Feyissa, F.; Mohammed, K.; Mengistu, G. Yield, Yield Components, and Nutritive Value of Perennial Forage Grass Grown under Supplementary Irrigation. Adv. Agric. 2022, 2022, 5471533. [Google Scholar] [CrossRef]
- Megersa, E.; Mengistu, A.; Asebe, G. Nutritional characterization of selected fodder species in Abol and Lare districts of Gambella region, Ethiopia. J. Nutr. Food Sci. 2017, 7, 1000581. [Google Scholar] [CrossRef]
- Zewdu, T. Variation in growth, yield, chemical composition and in vitro dry matter digestibility of Napier grass accessions (Pennisetum purpureum). Trop. Sci. 2005, 45, 67–73. [Google Scholar] [CrossRef]
- Bamikole, M.A.; Ikhatua, U.J. Nutritional evaluation of Ficus thonningii-Panicum maximum mixtures in West African dwarf goats. Nutr. Food Sci. 2010, 40, 280–288. [Google Scholar] [CrossRef]
- Amiri, F. Comparison of nutritive values of grasses and legume species using forage quality index. Songklanakarin J. Sci. Technol. 2012, 34, 577–586. [Google Scholar]
- Waramit, N.; Moore, K.J.; Fales, S.L. Forage quality of native warm-season grasses in response to nitrogen fertilization and harvest date. Anim. Feed Sci. Technol. 2012, 174, 46–59. [Google Scholar] [CrossRef]


| Species Name | DM | AC | CP | EE | |
|---|---|---|---|---|---|
| 1. | Alloteropsis cimicina | 57.35 ± 2.64abc | 4.25 ± 0.27fg | 6.75 ± 0.19fg | 1.67 ± 0.15gh |
| 2. | Apluda mutica | 47.79 ± 1.07efgh | 7.10 ± 0.01cd | 7.50 ± 0.37cdef | 3.00 ± 0.05c |
| 3. | Acrachne racemosa | 40.26 ± 1.09ijkl | 3.15 ± 0.21ij | 6.31 ± 0.37fg | 2.67 ± 0.14de |
| 4. | Aristida setacea | 59.75 ± 4.00a | 3.00 ± 0.12jk | 5.94 ± 0.22g | 2.00 ± 0.01fg |
| 5. | Brachiaria semiundulata | 54.01 ± 4.62abcde | 1.85 ± 0.14lm | 6.44 ± 0.15fg | 1.33 ± 0.02hi |
| 6. | Bromus diandrus | 53.80 ± 1.03abcdef | 2.35 ± 0.14l | 6.81 ± 0.34efg | 2.33 ± 0.19ef |
| 7. | Bulbostylis barbata | 33.33 ± 1.11lmno | 2.40 ± 0.06kl | 6.75 ± 0.18fg | 1.33 ± 0.11hi |
| 8. | Cenchrus ciliaris | 41.27 ± 1.05hijk | 6.90 ± 0.02d | 6.38 ± 0.45fg | 2.67 ± 0.13de |
| 9. | Chloris barbata | 50.75 ± 3.91cdef | 3.35 ± 0.20hij | 7.31 ± 0.36cdef | 1.00 ± 0.08i |
| 10. | Chloris virgata | 48.48 ± 0.48defg | 3.45 ± 0.18hij | 7.25 ± 0.36cdef | 1.00 ± 0.00i |
| 11. | Chrysopogon aciculatus | 55.07 ± 3.01abcd | 5.10 ± 0.24e | 9.88 ± 0.15b | 1.33 ± 0.06hi |
| 12. | Cymbopogon martinii | 46.63 ± 1.47fghi | 4.35 ± 0.32fg | 8.00 ± 0.14cde | 5.00 ± 0.31a |
| 13. | Cynodon dactylon | 47.09 ± 0.44efgh | 7.90 ± 0.24b | 11.94 ± 0.80a | 2.33 ± 0.18ef |
| 14. | Cyperus rotundus | 32.21 ± 2.40mno | 4.60 ± 0.36ef | 8.06 ± 0.41cd | 1.67 ± 0.07gh |
| 15. | Dichanthium aristatum | 53.37 ± 0.71abcdef | 8.70 ± 0.72a | 11.56 ± 0.49a | 1.67 ± 0.09gh |
| 16. | Digitaria ciliaris | 34.16 ± 1.77jklmno | 4.20 ± 0.04fg | 7.56 ± 0.54cdef | 2.33 ± 0.09ef |
| 17. | Digitaria longifolia | 37.13 ± 2.44jklmn | 2.05 ± 0.03lm | 7.31 ± 0.12cdef | 2.67 ± 0.03de |
| 18. | Digitaria sanguinalis | 44.48 ± 1.81ghij | 3.00 ± 0.24jk | 6.31 ± 0.15fg | 1.33 ± 0.08hi |
| 19. | Echinochloa colona | 36.87 ± 1.17jklmn | 3.35 ± 0.24hij | 6.81 ± 0.21efg | 2.67 ± 0.02de |
| 20. | Enteropogon monostachyos | 37.40 ± 2.58ijklmn | 3.70 ± 0.21ghi | 10.50 ± 0.19b | 4.67 ± 0.37ab |
| 21. | Eragrostiella bifaria | 55.07 ± 2.23abcd | 3.25 ± 0.05ij | 7.25 ± 0.46cdef | 1.33 ± 0.02hi |
| 22. | Eragrostis cilianensis | 59.15 ± 2.25ab | 2.15 ± 0.06lm | 7.31 ± 0.31cdef | 1.67 ± 0.13 gh |
| 23. | Eremochloa ophiuroides | 38.97 ± 3.49jklm | 1.60 ± 0.09m | 7.06 ± 0.15defg | 1.00 ± 0.07i |
| 24. | Heteropogon contortus | 31.37 ± 1.96no | 7.55 ± 0.37bc | 11.69 ± 0.75a | 4.33 ± 0.29b |
| 25. | Hyparrhenia hirta | 28.18 ± 1.66o | 5.00 ± 0.30e | 10.31 ± 0.01b | 4.33 ± 0.17b |
| 26. | Kyllinga brevifolia | 52.51 ± 2.95abcdef | 1.75 ± 0.13lm | 6.81 ± 0.30efg | 1.00 ± 0.06i |
| 27. | Melinis repens | 33.33 ± 1.71lmno | 4.00 ± 0.33fgh | 8.38 ± 0.53c | 3.33 ± 0.16c |
| 28. | Oplismenus burmannii | 38.97 ± 0.57jklm | 7.20 ± 0.15cd | 9.94 ± 0.11b | 3.00 ± 0.09cd |
| 29. | Perotis indica | 57.35 ± 2.49abc | 2.15 ± 0.10lm | 7.31 ± 0.63cdef | 2.33 ± 0.14ef |
| 30. | Themeda triandra | 32.78 ± 0.76mno | 8.85 ± 0.18a | 11.81 ± 0.93a | 3.00 ± 0.13c |
| SEM | 1.83 | 0.19 | 0.33 | 0.12 |
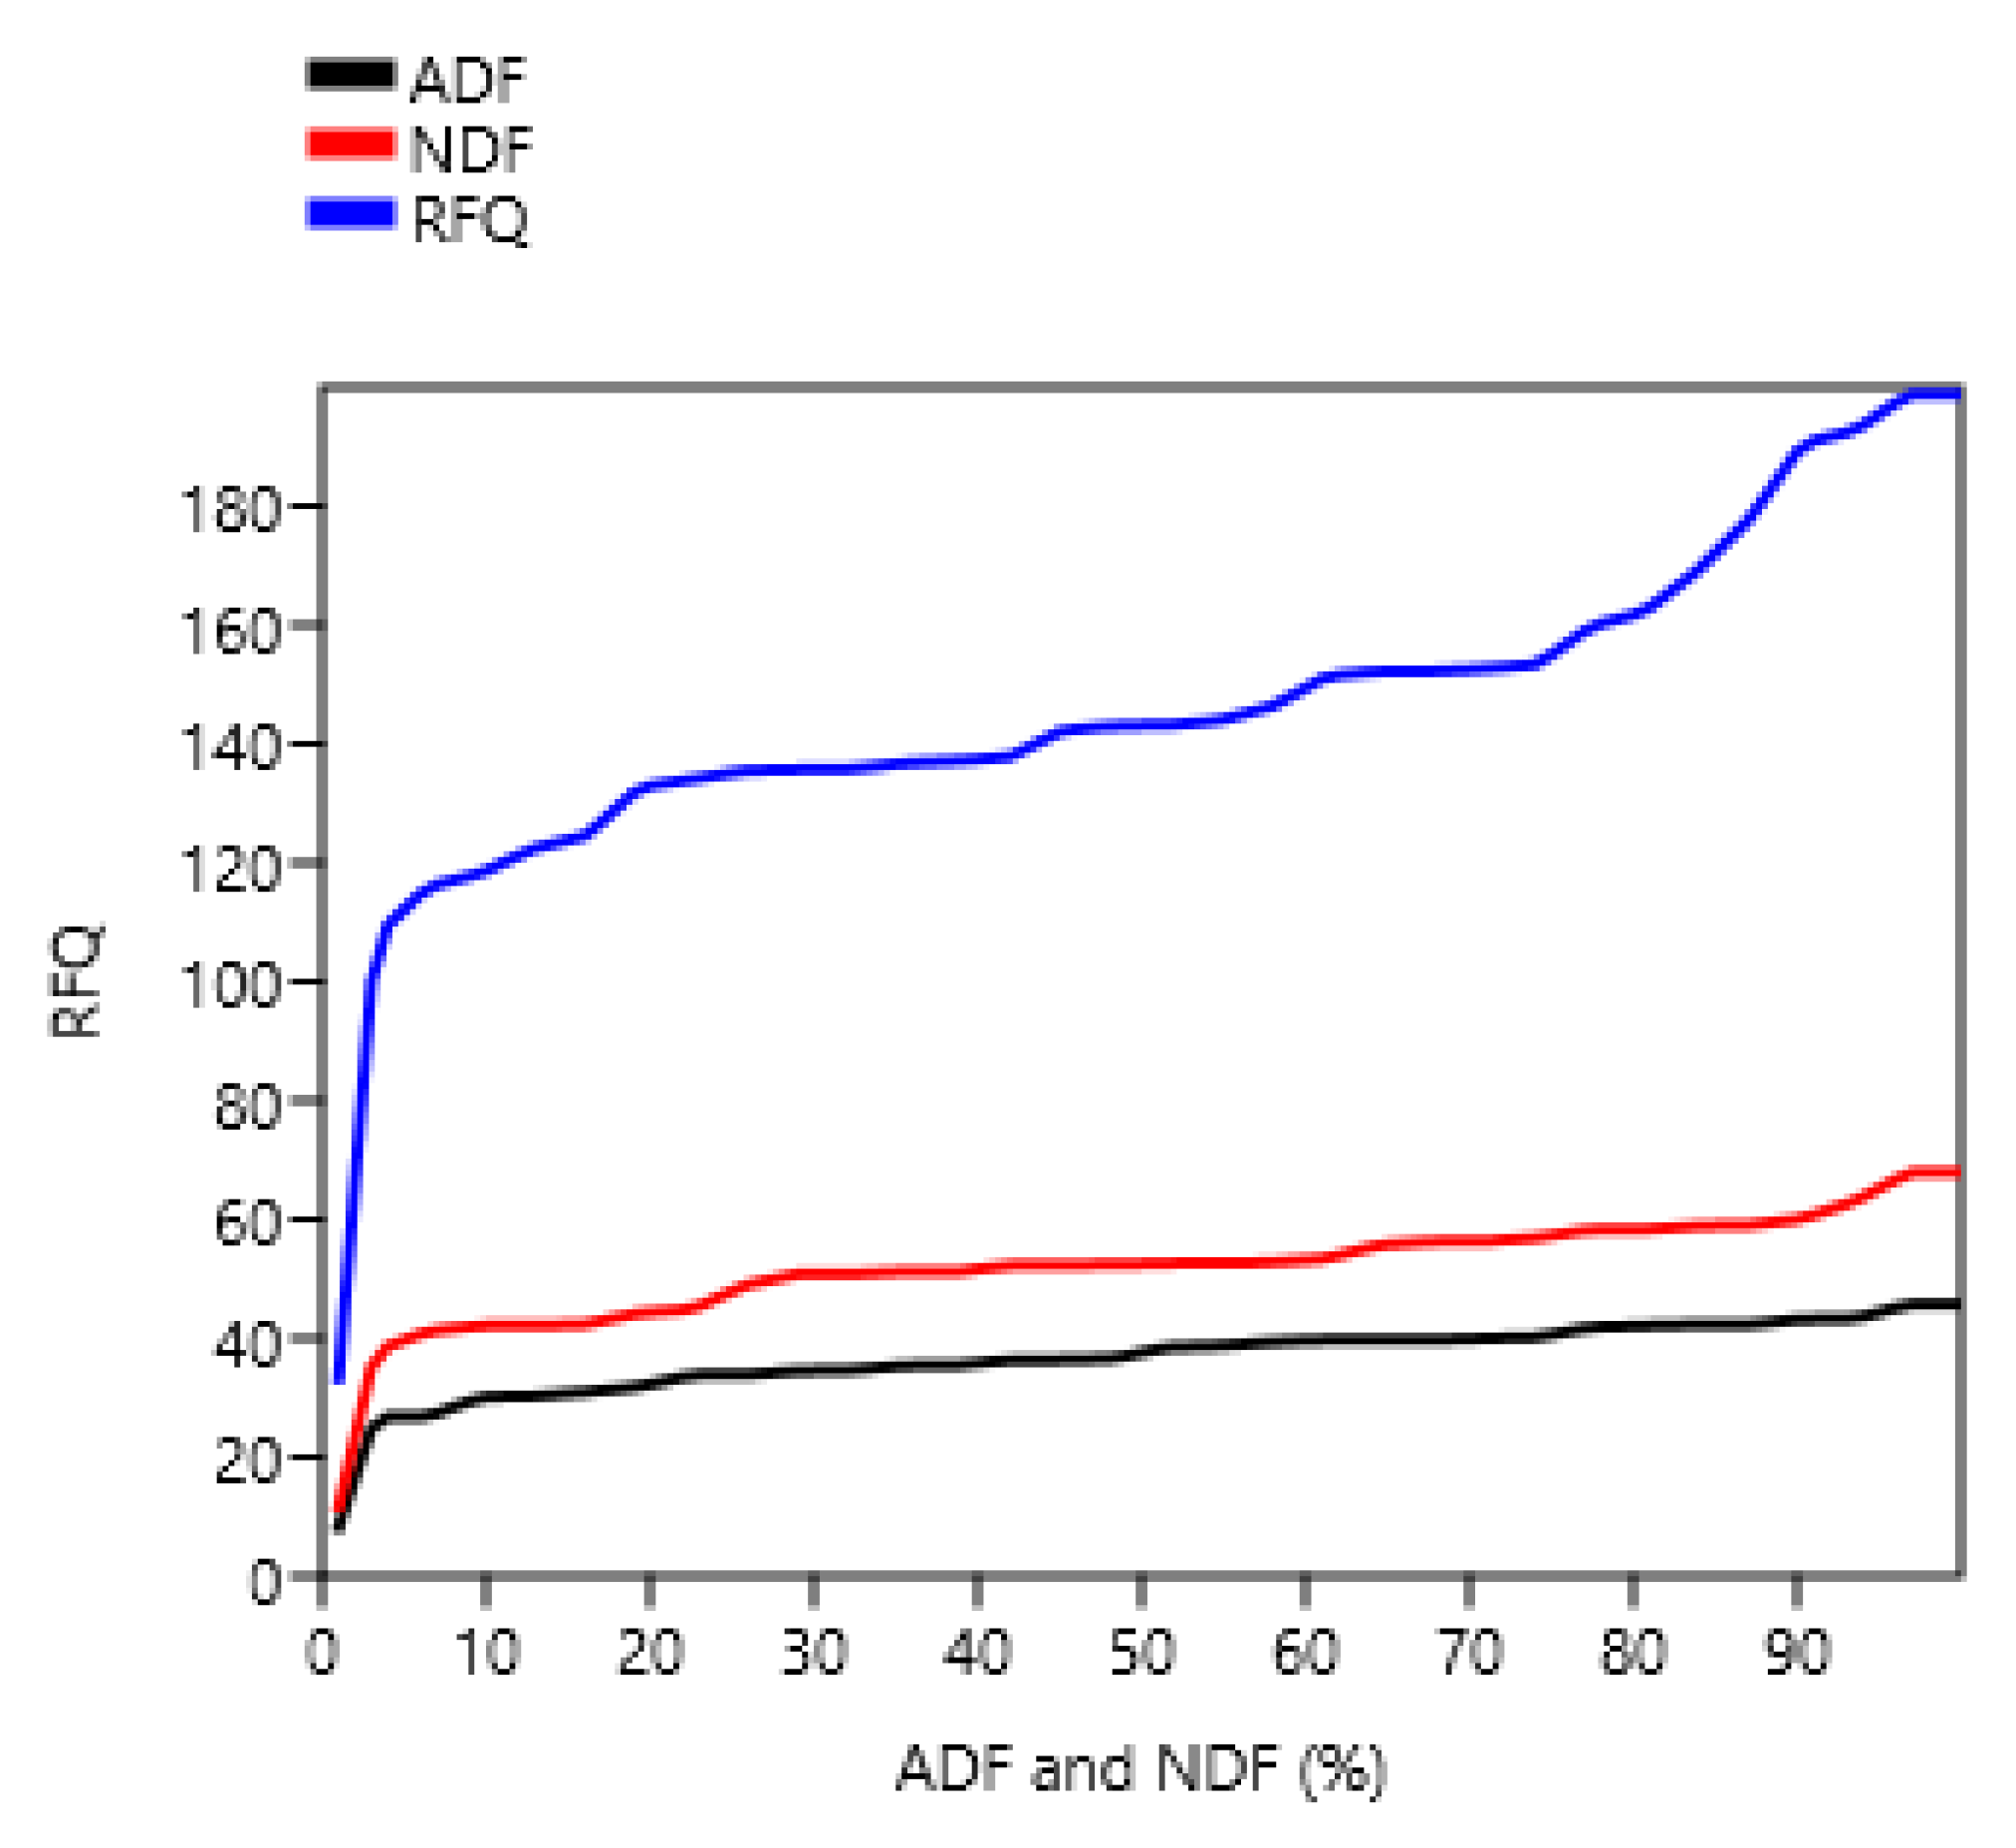
| Species Name | CF | ADF | NDF | |
|---|---|---|---|---|
| 1. | Alloteropsis cimicina | 18.63 ± 1.01ijk | 43.32 ± 1.03gh | 51.23 ± 0.64cdefg |
| 2. | Apluda mutica | 24.29 ± 0.25cdef | 35.45 ± 2.33bcd | 52.65 ± 0.10defgh |
| 3. | Acrachne racemosa | 18.76 ± 0.77ijk | 42.13 ± 2.89fgh | 59.08 ± 0.85ghi |
| 4. | Aristida setacea | 21.38 ± 0.69efghi | 45.74 ± 0.25h | 50.87 ± 0.41cdefg |
| 5. | Brachiaria semiundulata | 20.88 ± 1.56fghi | 39.76 ± 2.12defgh | 48.97 ± 4.16bcde |
| 6. | Bromus diandrus | 20.13 ± 1.66ghi | 42.34 ± 0.97fgh | 51.23 ± 3.79cdefg |
| 7. | Bulbostylis barbata | 15.68 ± 1.29jkl | 36.34 ± 2.09bcdef | 56.98 ± 2.93efghi |
| 8. | Cenchrus ciliaris | 28.18 ± 1.36bc | 42.34 ± 0.14fgh | 52.31 ± 4.30cdefgh |
| 9. | Chloris barbata | 20.11 ± 0.02gh | 39.76 ± 2.97defgh | 52.43 ± 4.70cdefgh |
| 10. | Chloris virgata | 20.43 ± 0.52fghi | 40.01 ± 2.93defgh | 53.45 ± 0.14efgh |
| 11. | Chrysopogon aciculatus | 23.90 ± 1.17defg | 39.76 ± 3.49defgh | 52.65 ± 2.94defgh |
| 12. | Cymbopogon martinii | 26.86 ± 1.52bcd | 40.21 ± 2.63defgh | 67.87 ± 5.23j |
| 13. | Cynodon dactylon | 28.45 ± 1.40b | 36.43 ± 1.97bcdef | 56.32 ± 2.79efghi |
| 14. | Cyperus rotundus | 25.32 ± 1.78bcde | 31.89 ± 1.02abc | 52.31 ± 1.15cdefgh |
| 15. | Dichanthium aristatum | 26.33 ± 0.40bcd | 34.65 ± 1.64bcd | 52.87 ± 1.84defgh |
| 16. | Digitaria ciliaris | 19.35 ± 1.50ij | 39.45 ± 1.89defgh | 56.32 ± 4.30efghi |
| 17. | Digitaria longifolia | 10.67 ± 0.78n | 36.65 ± 2.52cdef | 55.76 ± 0.62efghi |
| 18. | Digitaria sanguinalis | 10.83 ± 0.74n | 38.57 ± 0.40defg | 58.34 ± 0.46fghi |
| 19. | Echinochloa colona | 13.26 ± 1.10lmn | 35.53 ± 0.26bcde | 50.84 ± 0.66cdef |
| 20. | Enteropogon monostachyos | 28.11 ± 2.34bc | 30.31 ± 0.13abc | 42.16 ± 0.42ab |
| 21. | Eragrostiella bifaria | 15.71 ± 0.96jkl | 43.27 ± 1.09gh | 58.34 ± 3.28fghi |
| 22. | Eragrostis cilianensis | 15.19 ± 1.16klm | 41.89 ± 3.34efgh | 60.16 ± 2.44hij |
| 23. | Eremochloa ophiuroides | 18.13 ± 0.42ijk | 34.55 ± 2.64bcd | 44.89 ± 0.81abcd |
| 24. | Heteropogon contortus | 34.38 ± 1.20a | 30.12 ± 0.91ab | 41.23 ± 0.08ab |
| 25. | Hyparrhenia hirta | 24.91 ± 1.00bcde | 33.87 ± 1.13bcd | 58.94 ± 2.29fghi |
| 26. | Kyllingabrevifolia | 11.31 ± 0.67mn | 38.76 ± 2.89defg | 44.31 ± 3.18abc |
| 27. | Melinis repens | 23.31 ± 0.95defgh | 33.87 ± 1.18bcd | 63.12 ± 2.08ij |
| 28. | Oplismenus burmannii | 19.91 ± 0.54hi | 26.78 ± 1.75a | 37.89 ± 2.07a |
| 29. | Perotis indica | 12.29 ± 0.13lmn | 30.98 ± 0.39abc | 42.14 ± 1.34ab |
| 30. | Themeda triandra | 34.63 ± 2.95a | 26.85 ± 2.36a | 42.42 ± 1.62ab |
| SEM | 1.00 | 1.63 | 2.09 |
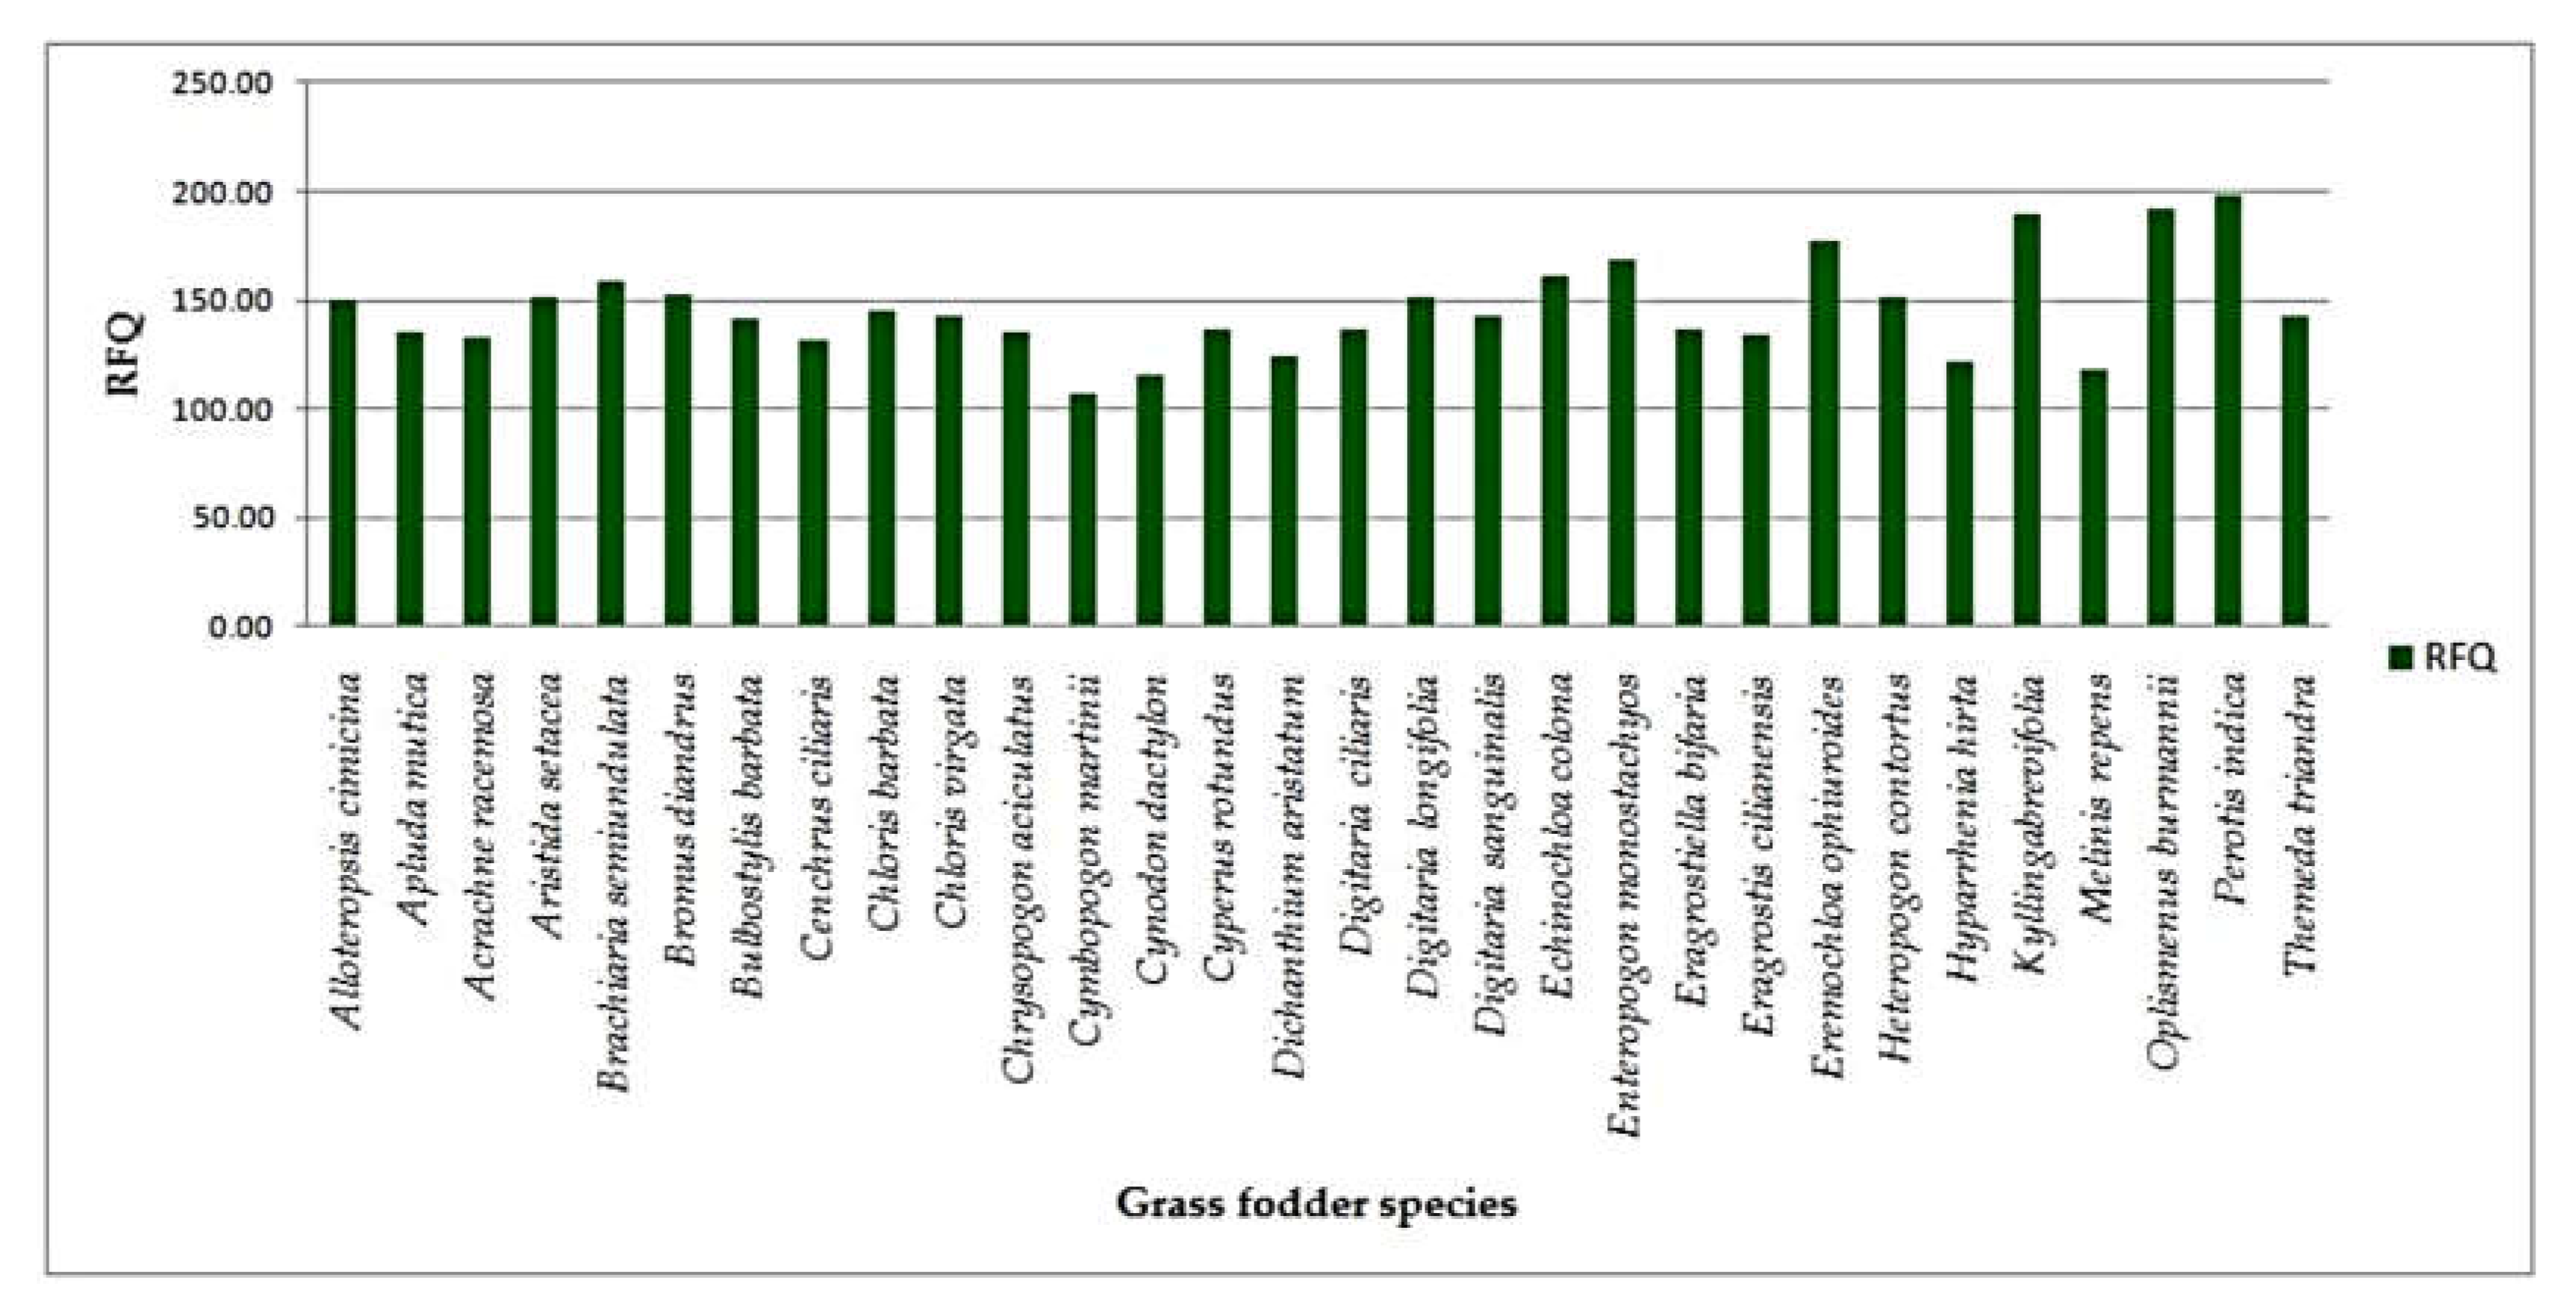
| Species Name | NFE | TDN | DDM | DMI | ME | RFQ | |
|---|---|---|---|---|---|---|---|
| 1. | Alloteropsis cimicina | 68.70 ± 1.01bcde | 79.51 ± 1.07abc | 55.15 ± 2.15de | 2.34 ± 0.01defg | 12.82 ± 0.12abcdf | 151.42 ± 3.68defg |
| 2. | Apluda mutica | 58.11 ± 2.30cfgh | 73.23 ± 5.86abcde | 61.28 ± 4.95abcde | 2.28 ± 0.03efgh | 11.66 ± 0.50dfgh | 135.69 ± 3.28ghij |
| 3. | Acrachne racemosa | 69.11 ± 0.33abde | 81.19 ± 5.25ab | 56.08 ± 0.17cde | 2.03 ± 0.07ghi | 13.13 ± 1.07abcdf | 134.08 ± 11.18ghij |
| 4. | Aristida setacea | 67.68 ± 3.21bcdef | 79.39 ± 5.62abc | 53.27 ± 2.21e | 2.36 ± 0.16defg | 12.80 ± 0.69abcdf | 152.25 ± 3.53defg |
| 5. | Brachiaria semiundulata | 69.50 ± 3.21abcd | 80.20 ± 3.79abc | 57.93 ± 3.65bcde | 2.45 ± 0.14cdef | 12.95 ± 0.91abcdf | 159.79 ± 6.96cdef |
| 6. | Bromus diandrus | 68.38 ± 1.53bcde | 80.56 ± 4.75abc | 55.92 ± 2.25cde | 2.34 ± 0.18defg | 13.01 ± 0.65abcdf | 153.43 ± 8.73defg |
| 7. | Bulbostylis barbata | 73.84 ± 2.00abc | 83.10 ± 1.69ab | 60.59 ± 4.27abcde | 2.11 ± 0.04fghi | 13.48 ± 1.12abcd | 142.29 ± 1.10efghi |
| 8. | Cenchrus ciliaris | 55.87 ± 1.01gh | 71.16 ± 1.65bcde | 55.92 ± 0.60cde | 2.29 ± 0.13efh | 11.27 ± 0.17fghi | 132.72 ± 1.62ghij |
| 9. | Chloris barbata | 68.23 ± 4.01bcde | 78.70 ± 2.33abc | 57.93 ± 3.80bcde | 2.29 ± 0.14efgh | 12.67 ± 0.60abcdf | 146.45 ± 11.04defgh |
| 10. | Chloris virgata | 67.87 ± 3.29bcde | 78.42 ± 1.05abc | 57.73 ± 4.65cde | 2.25 ± 0.15fgh | 12.62 ± 0.04abcdf | 143.14 ± 7.59efghi |
| 11. | Chrysopogon aciculatus | 59.79 ± 0.11efg | 73.28 ± 3.92abcde | 57.93 ± 2.92bcde | 2.28 ± 0.06efgh | 11.67 ± 0.44dfgh | 135.78 ± 0.97ghij |
| 12. | Cymbopogon martinii | 55.79 ± 4.46gh | 74.79 ± 6.49abcde | 57.58 ± 0.41cde | 1.77 ± 0.12i | 11.95 ± 0.60cdfg | 107.51 ± 6.94k |
| 13. | Cynodon dactylon | 49.38 ± 1.73hi | 66.95 ± 1.66cde | 60.52 ± 4.58abcde | 2.13 ± 0.07fghi | 10.50 ± 0.73ghi | 115.97 ± 7.81jk |
| 14. | Cyperus rotundus | 60.35 ± 0.95defg | 73.89 ± 3.60abcde | 64.06 ± 1.68abcd | 2.29 ± 0.03efgh | 11.78 ± 0.34dfgh | 137.82 ± 0.49fghij |
| 15. | Dichanthium aristatum | 51.74 ± 3.33gh | 67.52 ± 1.67cde | 61.91 ± 1.28abcde | 2.27 ± 0.09fgh | 10.60 ± 0.28ghi | 124.60 ± 5.80hijk |
| 16. | Digitaria ciliaris | 66.56 ± 0.18cdef | 78.97 ± 0.36abc | 58.17 ± 5.11abcde | 2.13 ± 0.01fghi | 12.72 ± 0.36abcdf | 136.80 ± 5.94ghij |
| 17. | Digitaria longifolia | 77.30 ± 0.89ab | 87.26 ± 4.66 | 60.35 ± 3.06abcde | 2.15 ± 0.15fghi | 14.25 ± 1.11a | 152.68 ± 9.15defg |
| 18. | Digitaria sanguinalis | 78.53 ± 5.30a | 86.11 ± 7.44a | 58.85 ± 0.76abcde | 2.06 ± 0.04fghi | 14.04 ± 0.08a | 144.00 ± 10.05efghi |
| 19. | Echinochloa colona | 73.91 ± 0.73abc | 84.53 ± 2.83ab | 61.22 ± 0.20abcde | 2.36 ± 0.13defg | 13.75 ± 0.78abc | 162.20 ± 10.34cde |
| 20. | Enteropogon monostachyos | 53.02 ± 2.58gh | 73.06 ± 1.63abcde | 65.29 ± 2.86abc | 2.85 ± 0.14abc | 11.63 ± 0.46dfgh | 169.06 ± 9.24bcd |
| 21. | Eragrostiella bifaria | 72.46 ± 4.55abc | 82.02 ± 4.25ab | 55.19 ± 0.66de | 2.06 ± 0.08fghi | 13.28 ± 0.52abcd | 137.17 ± 1.60fghij |
| 22. | Eragrostis cilianensis | 73.68 ± 2.20abc | 83.55 ± 2.88ab | 56.27 ± 1.37cde | 1.99 ± 0.03ghi | 13.57 ± 0.17abc | 135.50 ± 5.12ghij |
| 23. | Eremochloa ophiuroides | 72.21 ± 5.46abc | 81.84 ± 2.41ab | 61.99 ± 0.73abcde | 2.67 ± 0.05bcde | 13.25 ± 0.11abcd | 177.86 ± 8.48abc |
| 24. | Heteropogon contortus | 42.05 ± 1.92i | 64.34 ± 0.94de | 65.44 ± 1.35abc | 2.91 ± 0.25ab | 10.01 ± 0.19hi | 152.25 ± 11.50defg |
| 25. | Hyparrhenia hirta | 55.45 ± 4.80gh | 73.97 ± 2.15abcde | 62.52 ± 2.02abcde | 2.04 ± 0.18ghi | 11.79 ± 0.48dfgh | 122.44 ± 2.50ijk |
| 26. | Kyllinga brevifolia | 79.13 ± 2.28 | 86.52 ± 5.95a | 58.71 ± 1.98abcde | 2.71 ± 0.18bcd | 14.12 ± 0.53a | 190.50 ± 11.49ab |
| 27. | Melinis repens | 60.98 ± 4.83defg | 76.51 ± 5.72abcd | 62.52 ± 5.57abcde | 1.90 ± 0.15hi | 12.27 ± 0.67bcdfg | 118.26 ± 6.50jk |
| 28. | Oplismenus burmannii | 59.95 ± 4.37defg | 74.87 ± 6.25abcde | 68.04 ± 5.62a | 3.17 ± 0.01a | 11.96 ± 0.64cdfg | 192.77 ± 4.11a |
| 29. | Perotis indica | 75.92 ± 2.48abc | 85.88 ± 7.58ab | 64.77 ± 3.86abcd | 2.85 ± 0.23abc | 14.00 ± 0.44a | 198.83 ± 7.73a |
| 30. | Themeda triandra | 41.71 ± 1.68i | 62.21 ± 5.60e | 67.98 ± 4.38ab | 2.83 ± 0.09abc | 9.62 ± 0.74i | 143.08 ± 3.11efghi |
| SEM | 2.45 | 3.47 | 2.56 | 0.10 | 0.49 | 5.82 |
Publisher’s Note: MDPI stays neutral with regard to jurisdictional claims in published maps and institutional affiliations. |
© 2022 by the authors. Licensee MDPI, Basel, Switzerland. This article is an open access article distributed under the terms and conditions of the Creative Commons Attribution (CC BY) license (https://creativecommons.org/licenses/by/4.0/).
Share and Cite
Packialakshmi, M.; Palani Divya, M.; Baranidharan, K.; Geetha, S.; Nalliappan Ganesan, K.; Vijayabhama, M.; Manivasakan, S.; Hemalatha, P.; Radha, P.; Tilak, M.; et al. Exploring the Nutritional Potential of Wild Grass Fodder for Mega Herbivore (Elephas maximus) in the Foothills of Western Ghats. Animals 2022, 12, 2668. https://doi.org/10.3390/ani12192668
Packialakshmi M, Palani Divya M, Baranidharan K, Geetha S, Nalliappan Ganesan K, Vijayabhama M, Manivasakan S, Hemalatha P, Radha P, Tilak M, et al. Exploring the Nutritional Potential of Wild Grass Fodder for Mega Herbivore (Elephas maximus) in the Foothills of Western Ghats. Animals. 2022; 12(19):2668. https://doi.org/10.3390/ani12192668
Chicago/Turabian StylePackialakshmi, Mohan, Muthusamy Palani Divya, Krishnamoorthy Baranidharan, Seshadri Geetha, Kalipatty Nalliappan Ganesan, Manickam Vijayabhama, Srinivasan Manivasakan, Palanivel Hemalatha, Palaniswamy Radha, Meenakshisundaram Tilak, and et al. 2022. "Exploring the Nutritional Potential of Wild Grass Fodder for Mega Herbivore (Elephas maximus) in the Foothills of Western Ghats" Animals 12, no. 19: 2668. https://doi.org/10.3390/ani12192668