Article

Nutritional Characteristics and Digestibility of Woody and Herbaceous Native Plants from Tropical Flooded Savannas Ecosystems

by
Mauricio Vélez-Terranova
1,*,
Arcesio Salamanca-Carreño
2,
Andrés Mauricio Bejarano-Sánchez
3,
Daniela Alexandra González-Castro
4,
Rubén Darío Higuera-Pedraza
4 and
Luis Alfonso Giraldo
5
1
Facultad de Ciencias Agropecuarias, Universidad Nacional de Colombia, Palmira 763533, Colombia
2
Facultad de Medicina Veterinaria y Zootecnia, Universidad Cooperativa de Colombia, Villavicencio 500001, Colombia
3
Facultad de Ciencias Agrarias, Universidad Nacional de Colombia, Bogotá 111321, Colombia
4
Facultad de Medicina Veterinaria y Zootecnia, Universidad Nacional de Colombia, Bogotá 111321, Colombia
5
Laboratorio de Biotecnología Ruminal, Universidad Nacional de Colombia, Medellín 050034, Colombia
*
Author to whom correspondence should be addressed.
Agriculture 2022, 12(10), 1613; https://doi.org/10.3390/agriculture12101613
Submission received: 19 August 2022 / Revised: 24 September 2022 / Accepted: 28 September 2022 / Published: 5 October 2022
(This article belongs to the Special Issue Efficient Utilization of Biomass Resources in Agriculture)

Abstract

:
Native plants constitute an enormous source of nutrients for grazing animals, although their use has been limited due to the lack of knowledge about its properties. The aim of this research was to evaluate the nutritional characteristics of native plants from flooded savannas ecosystem. Seven transects (290 km) were carried out through the montane forests, gallery forests and open savannah ecosystems. A total of 42 plant species were collected (22 arboreal, 13 shrubs, 5 climbing and 2 herb plants) and their nutritional composition and digestibility were evaluated. Data analysis included univariate and multivariate methods. Nutritional composition and digestibility varied among the groups of arboreal, shrub, climbing and herb species. At an individual level plants such as G. americana, C. cf minor-grandiflora and M. nobilis, A.Jahnii, P. hispidium, I. carnea, S. reticulate, H. furcellatus, and C. erosa stood out by their protein, ash, and digestibility. At a group level, a mixed of 19 plants presented the highest digestibility, and the lowest fiber fraction constituted a promising forage alternative. Data variability was explained in the 47% by protein, ash, digestibility, and the different fiber fractions variables. Further studies related with the animal acceptability, performance and the presence of secondary metabolites are needed before being fully recommended.

1. Introduction

The flooded savannahs are the humid ecosystems with the highest productivity and ecological value in the neotropics. In Colombia, this ecosystem is distributed in the Orinoquia region with more than 5 million hectares between Arauca and Casanare departments [1]. Livestock breeding and fattening are one of the main activities carried out in flooded savannahs, usually under extensive grazing conditions, where animal performance is recognized for its low production rates, in addition to negative affect soil physicochemical properties, contributing to land degradation and environmental pollution [2,3].
The intensification of livestock activity is an emerging alternative to increase productivity and reduce its environmental impact under different agroecological conditions [4]. Productive intensification implies efficient resources use to guarantee a balance nutrition, health, and welfare of animals, allowing an increase in productivity per unit area [5]. In grazing livestock under tropical conditions several intensification models are found, highlighting the silvopastoral systems and the integrated crop—livestock systems [6,7].
The implementation of the intensify livestock models (e.g., Silvopastoral systems) are viable productive alternatives to be stablished under flooded savannahs conditions, however, is limited by the scarce knowledge about the availability, quality, phenology, and digestibility of native plants that support livestock activity throughout the year, hampering the design of suitable productive strategies [3]. In tropical environments, the vast native flora diversity (trees, shrubs, and other herbage plants) adapted to a wide range of agroecological ecosystems constitute a natural resource that needs further research to identify its potential use in animal production, either as nutritional alternatives for herbivorous species (leaves, fruits) or to provide shade, wood, nitrogen fixation, bioactive functionalities, etc. In this way, their use within the livestock systems of the region is encouraged, so that they contribute positively and permanently to the livestock activity sustainability, the maintenance of wildlife and the environmental contribution through its different ecosystem services [8,9].
Livestock activity under flooded savannah conditions requires a change towards more sustainable systems, however, to achieve this goal it is required to strengthen the knowledge about the nutritional properties that native species can provide, which, due to their adaptive capacities, constitute the main option for the establishment of sustainable livestock models in the region. In this sense, native herbaceous plants, shrubs, and trees that are feed sources commonly with unknown agronomic characteristics, could be used as an extra energy and protein sources to be utilized in scarcity seasons or to complement the base diet of animals, which in tropical conditions is characterized by grasses with high levels of fiber and low protein [8,9]. Considering that potential food sources can belong to a wide range of plants, including those in different botanical classifications, the aim is to identify the most nutritious ones to establish forage mixtures that guarantee the maximum performance of grazing ruminants. The objective of the present study was to evaluate the individual and join nutritional characteristics of woody and herbaceous native plants from flooded savannas ecosystems as a nutritional alternative for grazing ruminants.

2. Materials and Methods
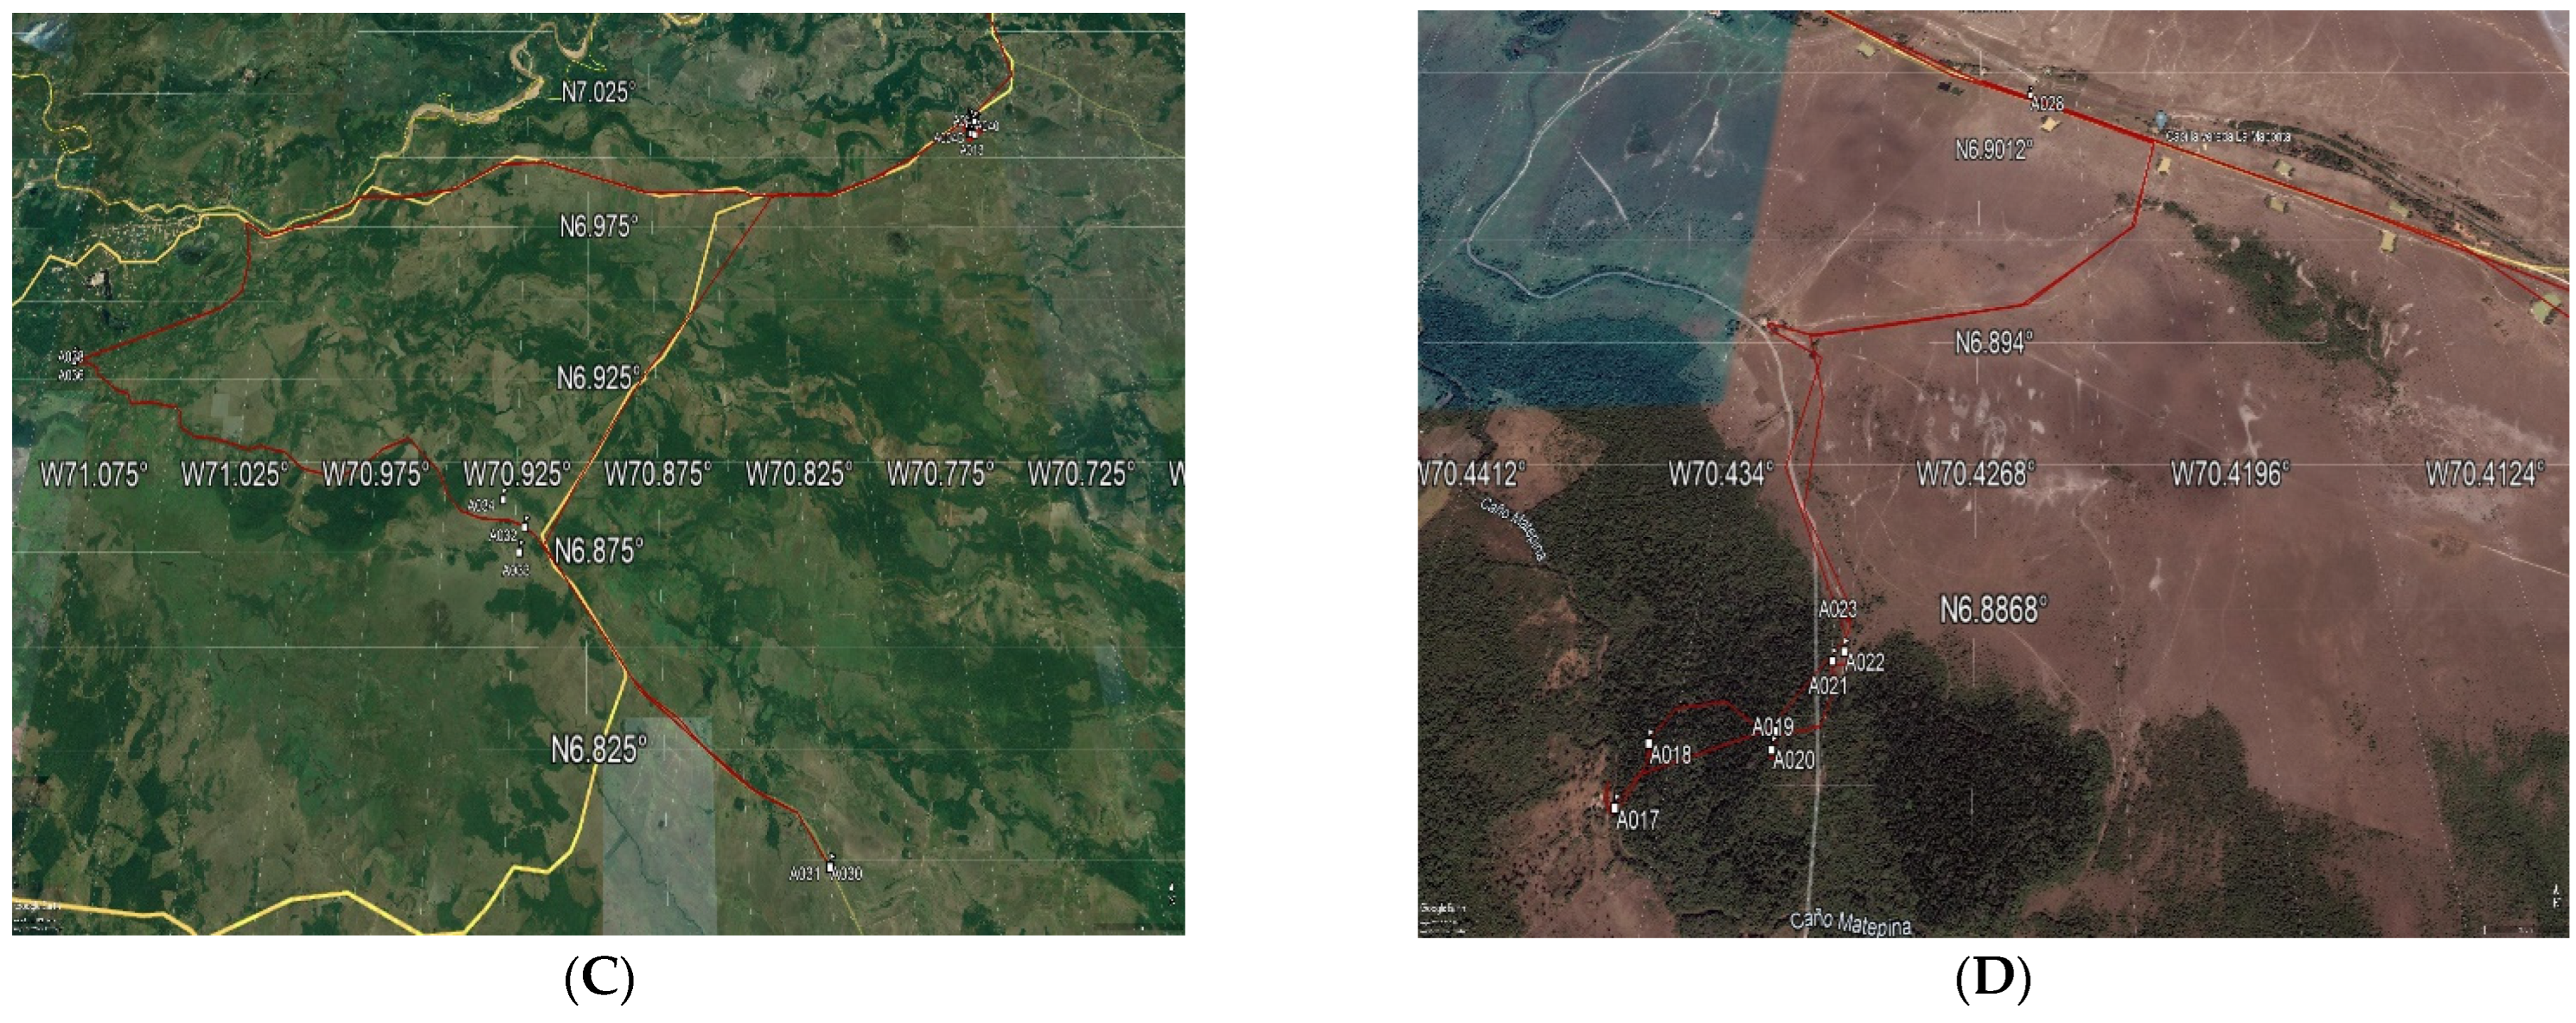
2.1. Localization

The study was carried out in the flooded savannah ecosystem of the Arauca’s municipality, located in Arauca’s department, Colombia (Figure 1) [10]. The area is located at 128 m above sea level. The ambient temperature varies between 28 °C to 35 °C on average with a relative humidity of 90%, the rainfall regime is monomodal, with the rainy season between April and November and an annual precipitation less than 1500 mm [10]. Soils present a sandy-loam texture and according to Holdridge’s classification, the region corresponds to the sub-humid tropical forest zone [11].

2.2. Selection of Plant Material

Species considered as a candidate for evaluation were those woody or herbaceous native plants of the flooded savannah ecosystem, with non-conventional use in the livestock systems of the region. Selection criteria were based on the degree of plants availability and greenness during the sampling season, the absence of morphological structures such as spines, or the presences of toxic compounds that may compromise the animals welfare, the suggestion of livestock farmers associated with the Livestock Committee of the region or other productive attributes (timber, medicinal, among others).

2.3. Plant Material Sampling Method

For the collection of plants samples, seven transects (290 km) were carried out during the transition period from the dry to the rainy season (April and May 2021), to evaluate the vegetation dynamics after a prolonged and adverse environmental condition (6 months). The transects covered the montane forests, gallery forests and open savannah ecosystems (Figure 2).
Plants samples were collected according with the standard methodology [12], which consists of traveling previously established transects, making stops (observation points) to evaluate the vegetation. At each observation point, plants meeting the selection criteria were triplicate sampled in a 100 m radius around the georeferenced site. Each sample consist of approximately 500 g of leaves, midribs, rachis (compound plants) and petioles. Different specimens of the same plant species were sample to guarantee representativeness. In this sense, at the end of the sampling period an approximately 1.5 kg was collected from each plant. According to the species availability, all the samples were taken within the same observation point or were complemented of other traveled points. The samples were collected in black polyethylene bags and stored under refrigeration (4–6 °C) until their transfer to the laboratory. To georeferenced each sampling point a GPS (Garmin Etrex Summit HC. Garmin Ltd., Olathe, KS, USA) was used and the transects maps were established with QGIS 3.16.3 and Google Earth Pro 7.3.3.7786 software’s (Figure 2).
During the traveled points, the selected plants were identified in the field by an expert botanist and later validated by comparison with specimens from the HORI herbarium of the National University of Colombia—Orinoquia, and online collections (tropics, KEW herbarium, catalog of Colombian plants and the virtual collection of the National University of Colombia). Complementary information about the plant habit, phenological state and the physiographic unit was also recorded.
In the laboratory, the samples were dried in a forced ventilation oven at 60 °C for 48 h, until attained constant dry weight. Subsequently, they were ground through a 1 mm sieve in a Wiley mill (Arthur H. Thomas Company, Philadelphia, PA, USA), for chemical composition and digestibility analyses.

2.4. Nutritional Composition Analysis

Plants nutritional composition was analyzed following the AOAC methodologies [13]. The dry matter (DM) content was determined by gravimetry (AOAC 934.01), the crude protein (CP) was estimated by the Kjeldahl method using the factor N × 6.25 (AOAC 97605), the ashes (ash) were obtained by the elimination of organic compounds by combustion (AOAC 948.05), the organic matter was quantified using the formula: (OM = 100 − %ash), neutral detergent fiber (NDF), acid detergent fiber (ADF) and lignin were calculated by the standard methodology [14]. Finally, the percentage of in vitro dry matter digestibility (IVDMD) was estimated by the DaisyII® digestor (Ankom Technology, New York, NY, USA). In this procedure, 0.5 g of ground samples were weighed into ANKOM F57 bags previously dried during 24 h at 60 °C. Bags were heat-sealed and placed in the four digestion flask of the equipment. Previously, a culture medium (6.8 L) with microminerals (50 mL), macrominerals (2000 mL), a reducing solution (500 mL), a buffer solution (2000 mL), and an indicator (Resarzurin 50 mL) were prepared, mixing the components under CO2 flushing until attained a transparent color. Subsequently, 1600 mL were transferred to each digestion flask and kept at 39 °C inside the equipment. Ruminal inoculum was collected in the morning from 2 ruminally cannulated Holstein cows fed with Kikuyo grass (Cenchrus clandestinum). The inoculum was stored at 39 °C in thermal flask and immediately transported to the laboratory. Subsequently, the ruminal fluid was pooled and filtered through two nylon bags with 50 µm pore size. The flask with the samples bags and the culture medium (1600 mL) were supplemented with 400 mL of strained rumen fluid under continuous CO2 flushing. The mixed components were incubated at 39.5 °C on average during 48 h. At the end of the process, the flasks were removed, the liquid was drained and the Ankom bags with the samples were rinsed with cold water and dried at 60 °C for 48 h. Finally, bags were placed in a desiccator and weighed to estimate IVDMD.
IVDMD values along with the estimated dry matter intake (DMI = 120/%NDF) were used to calculate the relative feed value (RFV) of each plant, using the following equation: RFV = (%IVDMD × %DMI)/1.29. This index is useful to evaluate forage quality since it combines the potential intake and digestibility of a feed [8]. RFV classification was according with the scale: 1st (≥150), 2nd (149–125), 3rd (124–100), and 4th (≤99) [15].

2.5. Statistical Analysis

The nutritional composition data within the botanical groups collected, were evaluated using one way ANOVA to identify differences between species of the same botanical group. When significant differences were found, least square difference test was used for mean comparison (p < 0.05).
A second analysis with a multivariate approach was performed to identify clusters of plants with similar nutritional compositions during the sampling period. All the studied botanical groups were included in the analysis. Data were subjected to a non-hierarchical cluster analysis using k-means clustering algorithm and the Euclidean distance. The number of clusters were defined considering the partition that minimized the sum of within sum of squares function. Subsequently, to evaluate the average behavior of the nutritional variables within each cluster, descriptive statistics were estimated. Finally, to identify the nutritional quality variables that most explain the data variability among the evaluated plants, a principal components analysis (PCA) was performed. The procedure was carried out with standardized variables since heterogeneous variances were found. All analyses were performed with the software Infostat (Universidad Nacional de Córdoba, Córdoba, Argentina) [16].

3. Results and Discussion

During the carried out transects 42 plant species belonging to 23 families were collected (Table 1). The arboreal plants were the most abundant species (n = 22), followed by shrubs (n = 13), climbing (n = 5) and herbaceous (n = 2) species. The phenological state of the collected plants correspond: 31.1% vegetative, 24.4% flowering fruiting, 20.0% fruiting, 15.6% flowering, and 8.9% vegetative flowering. Most of the plants were collected on artificial embankment edges and the low physiographic unit of the flooded savanna.
The nutritional composition variables of the evaluated plants are found in Table 2 and Table 3. All the studied nutritional variables presented statistical differences within the botanical groups (p < 0.05), except for the DM, ADF, and IVDMD in the herb group.
DM constitute the proportion of plant material remaining after drying and is composed of macromolecules like carbohydrates (fibrous or non-fibrous), proteins, fats, minerals, pigments, among others [17]. In all the evaluated plants, DM content varied between 18.2–54.5%. In arboreal species, 10 plants reached DM contents between 35.6–54.5%. Among shrubs, 5 plants were between 35.2–50.6%, while in climbing species, 4 plants presented values between 42.8–48.9%. These ranges are slightly higher than those found in leaves samples of some commonly known trees and shrubs [18,19], although like the values obtained during the dry season under a tropical dry forest region [20]. The sampled plants in the present study were exposed to a long dry period that could increment the evapotranspiration rate in plants and soil, reducing the water availability in leaves and increasing the DM contents [20].
The OM comprises all the nutrients (proteins, carbohydrates, and lipids) that can be assimilated in the animal body to obtain energy and is calculated as the difference between the dry matter and the ash content of a feed [21]. Among all the studied plants, OM ranged between 82.6–97.6%, which is similar to the monthly variation observed in Indian trees leaves, Northeastern Mexico shrub species and climbing plants such as kudzu (Pueraria montana var. lobata) [22,23,24]. Remarkable plants with OM content greater than or equal to 95% included the arboreal species C. venezuelanus, M. cf aculeatum, M. multijugum and P. pinnatum (96.2–96.7%). The shrubs plants M. spicata, H. furcellatus, R. cf phaseoloides-reticulata and P. maribense (95.0–96.0%) and the climbing plants V. lasiocarpa, E. polystachya and P. cf laevigata (95.1–97.5%). T. geniculate herb specie was the best classified with 91%.
Protein is one of main limiting nutrients in grazing livestock under tropical conditions, because most base diets are composed by poor-quality roughage with low crude protein levels. This situation, reduce the N retention in animals and increase their requirement, especially under warm conditions [25]. In this sense, fodder of trees, shrubs and other non-leguminous plants could play a fundamental role to complement protein deficiencies [26]. Within the analyzed plants groups, the CP content was variable. Average ranges values of 8–25.3%, 2.5–25.8%, 8.8–19%, and 17.5–27.3% were found in arboreal, shrubs, climbing and herb species, respectively. These values are within the range reported in trees and shrubs [20,27,28], climbing [24], and herb species [29]. The plants with the highest CP classification within the groups included six species in the arboreal category (A. niopoides, H. americanus, M. nobilis, M. calabura, C. vitifolium and A. Jahnii—17.7 to 25.3%), four in shrubs (G. guianensis, A, molli, I. carnea and S. reticulate—22.5 to 25.8%), two in climbing (E. polystachya and L.densiflorus—15.4 to 19%) and one plant in the herb category (H. indicum—27.3%).
All the arboreal, climbing, and herbs plants while 11 of the shrub species presented CP concentrations equal to or greater than 8% of the DM, which constitutes the minimum protein requirement for optimal rumen microbial function [28]. These results demonstrate the great potential of these native plants as a protein source to be incorporated into grazing animals diet under flooded savannah conditions.
The ash fraction present in plants leaf tissue correspond to the inorganic mineral component (incombustible) that plants absorb from the soil [29]. In this study, the ash contents varied between groups, with values ranging between 2.4–16.1%, 4–11.7%, 2.5–6.5% and 8.2–17.5% in arboreal, shrubs, climbing and herb species, respectively. These mineral concentrations agreed with the 2–22% range reported in a meta-analysis, including trees, shrubs, grasses, and herbs [29]. Arboreal plants such as C. sylvestris, P. elsiae, H. americanus, T. micrantha and C. collococca stood out for their ash content (8.6–16.1%). Among shrubs, M. albicans, G. guianensis, P. hispidium, A, molli and I. carnea plants showed the highest ash levels (8.6–11.7%). In climbing plants C. erosa and L. densiflorus presented the highest values (6.4–6.5%), while H. indicum herb attained a 17.6%. Apparently, these plants represent an important mineral resource for grazing animals, however, an individual profile of the main minerals present in the ash fraction are required since under flooded savannahs conditions soils are recognized as acids and with high levels of aluminum and iron [30]. These elements can be assimilated in excess by plants and generate toxicity in grazing cattle when they are consumed [31].
Fiber represents the fraction that is partially digestible in the gastrointestinal tract of herbivorous animals, and is constituted of complex polysaccharides, such as cellulose, hemicellulose, and pectin, as well as lignin, which is rich in phenolic compounds [9]. Fiber metrics like NDF, ADF, and lignin gives an estimation of the cell wall fraction (cellulose, hemicellulose, lignin, silica, insoluble nitrogen compounds). These components increase as plants reach maturity and are negatively associated with intake and digestibility [29,32]. Evidence suggests that intake is restricted when NDF content of the diet is above 55% [33].
NDF is an important parameter related to ruminal turnover rate and saliva production necessary to maintain rumen pH. This fiber fraction is composed of cellulose, hemicellulose and lignin. The first two are slowly fermented by ruminal microbiota and contribute as a source of metabolic energy [34]. NDF values within the plant groups varied between 38.4–75.7%, 32.1–70.4%, 49.6–66.5% and 48.3–65.4% in arboreal, shrubs, climbing, and herb plants, respectively. In general, these values are similar to the 23–90% range reported in plant species of different families [29]. Among the arboreal plants with the lowest NDF values were G. americana, C. cf minor-grandiflora, M. nobilis, and C. vitifolium (38.4–45.8%). In shrub plants, M. albicans, P. hispidium, and M. cf Afinis species presented values between 32.1–38.3%, while the climbing C. erosa and the herb H. indicum plants showed values of 49.6% and 48.3%, respectively. The NDF values below 55% suggest that the use of these plants in grazing animals will not compromised diet digestibility [33]. Nevertheless, complement studies on NDF digestibility are required to identify the real energy contribution of these plants to animals [34].
ADF is a nearly indigestible fraction composed of cellulose, lignin, cutin, and lignified proteins that limits the cell wall carbohydrate degradation at ruminal level [29,34]. As ADF is a subset of NDF, it is also used to estimate forage quality, diet digestibility, energy availability, and consumption potential of forage species. The lower the ADF content of a forage, the higher the nutritional quality and energy levels [15,35]. Among the studied plants, ADF content range between 16.3–54.3%, 18.3–52.3%, 31.7–47.9% and 28.6–30.5% in arboreal, shrubs, climbing, and herb plants, respectively. These values are similar to those found in trees, leaves, shrubs and climbing plants [22,23,24,28]. The lowest ADF content observed in arboreal species ranged between 16.3–30.9% (C. cf minor-grandiflora, A. niopoides, M. nobilis, M. calabura, C. vitifolium, A.montana and A.Jahnii). Meanwhile, the lowest values in shrubs species were 18.3–21.4% (P. hispidium, I. carnea and S. reticulate). In climbing plants, C. erosa and L.densiflorus reached values between 31.7–35.4%, while T. geniculate herb plant presented an ADF content of 28.6%. Some of the plants that presented low NDF levels, also showed low ADF levels as expected, however, other non mentioned species were also included. This shows that despite finding different fiber levels, the indigestible component varies considerably, especially in tropical plants [34].
Lignin is an undigestible polymer composed of phenolic units cross-linked with cellulose and hemicellulose in the cell wall. Its presence constitutes a barrier for ruminal microorganism, preventing total degradation of substrates Thus, low lignin values are always desirable to guarantee cell wall polysaccharides accessibility to rumen microbes [34]. In the present study, lignin fraction varied between the plant groups. Values ranging from 5–36.5%, 5.2–32.5%, 11.3–31.7% and 7.2–20.3% were obtained in arboreal, shrubs, climbing and herb plants, respectively. The lignin content found in shrubby plants agrees with the values obtained in species from other semi-arid areas [28]. Similarly, herbs plants lignin was within the range observed in different species grown under several localities at a global scale [29]. Arboreal species such as M. nobilis, M. calabura, A.montana, and A. Jahnii, presented lignin values as low as 5–10.3%. In shrub plants the lowest values were associated with H. furcellatus, P. hispidium, I. carnea, and S. reticulate species (5.2–10.8%). V. lasiocarpa and C. erosa climbing plants ranged between 11.3–13.9%, while in T. geniculate herb plant a lignin content of 7.2% was estimated.
Even when the different fiber fractions were within the reported ranges, plants such as H. chorymbosa (arboreal), M. spicata (shrub), E. polystachya (climbing plant) and P. cf laevigata (climbing plant), presented the highest NDF (60.3–75.7%), ADF (44.3–54.3%) and lignin (29.5–36.5%) levels among the studied plants. High fiber concentrations could be attributed to the environmental conditions during the plants sampling (transition period from the dry to the rainy season), which are characterized by high temperatures (>30 °C) and relative humidity (>80%) that stimulate plants maturation with an accompanying cell wall thickening [36]. In addition, plants metabolic processes are accelerated, encouraging photosynthetic products to be used mainly in the continuous formation of cell wall components. In this way, plants favor energy expenditure in the construction of support structures that ensure their longevity [29,36]. It is important to highlight that among botanical groups, it has been reported that legumes presented the highest lignin levels between grasses and other forbs [8], while the same tendency was observed in tree species where fiber and lignin content were the highest between different botanical groups. This effect could be associated with the high mass leaf, low photosynthetic protein levels and greater leaf longevity found in these plants [29].
The elevate fiber content and the possible presence of secondary metabolites that are commonly reported in shrubs and trees [37] suggest that considering these kind of plants as the only feed source in ruminants could impair the animal intake and digestibility, nevertheless, some reports show that a partial inclusion of these plants in the animals diet can improve their performance in terms of milk or meat production, increase forage biomass production, enrich the diet nutritional quality for grazing herbivores and provide shade, an important factor that guarantee animal welfare specially in grazing ruminants under tropical environment [38].
IVDMD is an important metric since it represents the proportion of plant material that can be digested by herbivores and is considered one of the main criteria for evaluating the usefulness of a feed in animal nutrition [39]. IVDMD is largely determined by the plant chemical composition, usually being higher in plants with high CP content and lower fiber values [29,40]. IVDMD within the groups range between 26.9–88.7%, 22.9–91.3%, 34.1–74.5%, and 43.2–46% in arboreal, shrubs, climbing and herb plants, respectively. These values are close to those reported in tropical legumes and non-legumes trees and shrubs [28,41], climbing plants [24], and different botanical groups grown in arid and equatorial regions [29]. Some of the plants with IVDMD greater than 50%, included arboreal species, such as G. americana, C. cf minor-grandiflora, H. americanus, M. nobilis, A.montana and A. Jahnii, with values between 62.6–88.7%. In shrubs plants, values between 61.3–91.3% were found in A. molli, T. lappula, I. carnea and S. reticulate. Climbing plants like V. lasiocarpa and C. erosa presented values of 54.3% and 74.5%, respectively. The lowest IVDMD were found in herb species such as H. indicum and T. geniculate with values of 43.2% and 46%.
In general, in this study was observed that IVDMD decreased as fiber fractions like NDF or ADF increased among plants. This is an expected result since it is commonly reported that forage digestibility is reduced by the increase in cell wall components such as cellulose, hemicellulose, and lignin [39]. However, average IVDMD values between 43.3–59.4% were observed in plants with NDF contents between 50–60%. Even when fiber values are high, digestibility’s are acceptable for tropical plants. Some reports suggest that in legumes and other non-legume plants, digestibility can be maintained for long periods since there is a constant turnover of leaves and petioles as the plants reach maturity [8]. In this way, the presence of young leaf tissue allows the digestibility not to be drastically affected. Similarly, the high protein content observed among most of the plants favor IVDMD, as protein constitutes a substrate that can be easily degraded by ruminal microorganisms [42]. It has also been reported that in legumes leaves the rate of particle breakdown is faster, possibly attributed to the reticulate venation which is more susceptible to breakdown [43]. Finally, although lignin content is high in some legumes, its distribution is mainly concentrated in the xylem. This means that some tissue present low or no lignin content, leaving parts, such as the cell wall highly susceptible to being degraded by ruminal microbiota [43].
The relative feed value of the studied plants is shown in Table 4. This index combines important nutritional factors, such as potential intake and digestibility to evaluate forage quality. According with the relative feed value scale [15], within the arboreal species three plants were classified in the first place (G. americana, C. cf minor-grandiflora and M. nobilis) and one in the second place (A. Jahnii). A similar tendency was observed between shrubs species, with three plants classified in first place (P. hispidium, I. carnea and S. reticulate) and one in second place (H. furcellatus). In climbing plants only C. erosa was classified in second position, while the other plants as well as the herb species were categorized in fourth place.
The RFV is an index that do not consider the protein content of the forages; however, it is usefulness for the comparison of two or more similar forages for energy intake potential. RFV values of 100 represent a forage with a 53% and 41% of NDF and ADF, respectively. In this way, values higher than 100 are accepted, while in dairy cows nutrition, values greater than 150 are always desirable [15]. According to Table 4, 28.6% of the studied plants presented an acceptable RFV (equal or higher than 100). Only the 14.3% of the plants meet the suggested requirements for dairy cattle (RFV ≥ 150), while 21.4% of the species presented RFV values equal or greater than 125, which can be used to feed animals with lower nutritional requirements such as those used for breeding and fattening under flooded savannah conditions. The low RFV index values observed among the plants can be attributed to the fact that this index is affected by the fiber levels (NDF and ADF). Among the studied plants, 54.8% and 23.8% attained FDN and FDA contents higher than the base values used to construct an acceptable RFV index. The observed fiber variability between plants is an expect behavior in species growing during a transition period from dry to rainy seasons. Some plants have endured a prolonged drought period trying to adapt to the tropical conditions, while others begin their growth process encouraged by the first rains [44,45].
The RFV results suggest that arboreal, shrubs and climbing species such as G. americana, C. cf minor-grandiflora and M. nobilis, A.Jahnii, P. hispidium, I. carnea, S. reticulate, H. furcellatus and C. erosa showed the highest quality within each of the evaluated plant groups. Compared to all the studied plants, these species were characterized by medium to high crude proteins levels (8.8–25.2%), low NDF (38.3–52.9%), low ADF (16.3–32.5%), low lignin (5–20.3%), medium ash content (4.7–11.7%), and high digestibility (61.3–91.3%).

3.1. Species Clusters by Nutritional Quality

According to the cluster analysis, three groups of plants were established. The first group consisted of 9 species (C. venezuelanus, M. multijugum, H. chorymbosa, E. cribrata, M. spicata, R. cf phaseoloides-reticulata, E. polystachya, P. cf laevigata and V. venezuelana) of which 5 were arboreal, 2 shrubs and 2 climbing plants. The second group was constituted by 14 species (C. sylvestris, P. elsiae, V. orinocensis, H. americanus, T. micrantha, C. collococca, G. guianensis, P. hispidium, A. molli, T. lappula, I. carnea, L. densiflorus, H. indicum, and T. geniculata) of which 6 were arboreal, 5 shrubs,1 climbing and 2 herbs plants. Within the third group, 19 species were included (G. americana, M. cf aculeatum, C. cf minor-grandiflora, A. niopoides, P. pinnatum, M. nobilis, M. calabura, C. vitifolium, A. montana, A. Jahnii, G. madruno, H. furcellatus, M. albicans, U. lobata, P. maribense, M. cf Afinis, S. reticulata, V. lasiocarpa and C. erosa) of which 11 were arboreal, 6 shrubs and 2 climbing plants.
The nutritional characteristics of each stablished group are presented in the star graph showed in Figure 3. Each ray of the star graph represents a variable, and the length represents its magnitude. Within the first group, all the variables presented similar magnitudes reaching average values of 96.21% (OM), 12.45% (CP), 65.47% (NDF), 47.94% (ADF), 30.42% (lignin), 3.79% (ash) and 42.25% (IVDMD). This group attained the lowest CP concentration and the highest fiber fractions compared with the other clusters. The average 65.47% NDF level among the plants within this group suggest that animal intake and digestibility could be compromised [33].
With respect to the first group, in the second cluster an evident increase in CP and ash concentration was observed with a slightly decrease in fiber content. Mean variables values were: 89.95% (OM), 19.19% (CP), 55.62% (NDF), 33.17% (ADF), 17.87% (lignin), 10.05% (ash) and 43.84% (IVDMD). Given the higher protein and lower fiber content found in the plants within this group, a higher digestibility was expected [46], however it was like the value found in the first group, which was the lowest. Inside the cluster 2, shrubs and trees were the most representative species (78.6%). This kind of plants are recognized by the presence of secondary metabolites that in sufficient quantities can present antimicrobial properties affecting ruminal microbiota population responsible for substrate degradation which is reflected in a reduction in the feed utilization efficiency [47]. Since this study did not evaluate the presence of secondary metabolites, this hypothesis requires further research.
The third group was characterized by the highest digestibility and the lowest fiber fractions among clusters. Mean variables values were: 94.04% (OM), 14.64% (CP), 48.42% (NDF), 28.87% (ADF), 13.71% (lignin), 5.96% (ash) and 60% (IVDMD). Inside this group, proper CP levels were found which constitute a substrate for ruminal populations that can be degraded quickly contributing to the higher IVDMD [42]. Digestibility was also promoted by the low NDF observed, indicating that partial digestible (cellulose and hemicellulose) and undigestible (lignin) fractions were in low concentrations, allowing ruminal microorganisms to easily access the non-fibrous substrate and the cellulose and hemicellulose component of the cell wall for their degradation [15,35].
The results suggest that the combination of plants present in cluster 3 constitutes a promising forage mixed to be supplied to grazing animals under flooded savannah conditions [29]. Within this group, 11 families were included being the plants of the Fabaceae family the most representative (26% of the species). It is important to highlight that other non-legumes species from different families (Annonaceae, Clusiaceae, Malvaceae, Melastomataceae, etc.) also contributed with the nutritional characteristics found in cluster 3, suggesting a potential alternative for ruminant nutrition, which in many cases is wasted due to a lack of knowledge about its properties [8].
The observations of the present study are based on a single sampling of plants during the transition period from the dry to the rainy season of floodable savannahs ecosystem, so the mixture of species from cluster 3 would only be recommended for this period. Forage quality varies with time and space; therefore, it is necessary to constantly evaluate forage nutritional behavior under several localities and environments. This information will be useful to identify promising forage species adapted to specific seasons, nutritional variations and management practices that allow to maximize their utilization [48]. In this way it is possible to identify nutritional alternatives adapted to different ecosystems and that constitute the best option for animal feed [9].

3.2. Representation of Nutritional Data Variability

The eigenvalues and eigenvectors resulted of the principal component analysis performed on the nutritional quality data are shown in Table 5 and Table 6. Then 71% of data variability was explained by the first two principal component (PC1 = 0.47 and PC2 = 0.24).
The PC1 allows the differentiation between nutritional variables associated with different fiber fractions (NDF, ADF, and lignin) with respect to the variables associated with CP, ashes and to a lesser extent with IVDMD. Fiber fraction received the highest positive eigenvector, while CP and ashes variables received the highest negative values (Table 6). This behavior can be clearly seen in the biplot representation of the two first PCs shown in Figure 4.
Fiber fractions (NDF, ADF and lignin) are located to the right of the PC1 while CP, ashes and IVDMD are found to the left. The opposite signs and locations of the variables within the first PC indicate that plants with higher NDF, ADF, and lignin presented lower CP, ash and IVDMD. This observation agrees with literature reports indicating that higher fiber fraction limit the access of ruminal microorganisms to the substrate, which reduces its degradation rate, while high CP and ash contents are easily degraded contributing to the digestibility [29,46].
With regard to the PC2, variables such as CP, ash, NDF, ADF and lignin received positive values and were separated against IVDMD and OM variables, which received the negative values (Figure 4). This behavior indicated that among the evaluated plants, the higher IVDMD and OM were accompanied by a reduction in the other nutrients. This is an expected result since dry matter degradation implies a reduction in its components including CP, ash, and the different fiber fractions by ruminal microbiota [39].
In the biplot chart (Figure 4), the clusters formed previously were also shown. On the PC1, results confirms that plant species belonging to the cluster 3 (green squares) were characterized by their content of CP, ash and IVDMD. These properties were reflected in a better nutritional quality. Cluster 2 (red dots) followed Cluster 1 in terms of nutritional quality characteristics. Within this group, some plants stood out for their digestibility, ash, and CP levels, while the others for their OM content. Finally, plants species included in cluster 1 (blue triangles) were located to the left of PC1 and were represented by their high NDF, ADF, and lignin levels, and, therefore, the lowest nutritional quality among clusters.
In Colombia and different Latin American regions, the use of trees, shrubs, and other plant resources have been underestimated by livestock producers. The present study showed that besides the typical botanical groups used in animal feeding, exists other botanical groups with promising nutritional characteristics that can be used to solve the urgent need of energy and protein sources for animal nutrition under flooded savannas conditions [9]. The foliage or fruits of these native arboreal, shrubs and other herbaceous species can be used during scarcity seasons to complement the animal feeding, given that their nutritional quality are preserved for longer time [8]. In addition, the use of adapted plants brings benefits related to soil and microbiota recovery, erosion protection, nitrogen fixation, aeration, nutrient recycling, among others [9].
This study only focused on plants nutritional composition; however, it is necessary to carry out other research to identify the presence of secondary compounds before being fully recommended. These bioactive compounds allow the rumen modulation in a positive or negative way depending on its biological activity and the dose consumed by the animal [8]. Some positive effects included the reduction in ammonia production and methane emissions through the selective control of ruminal microorganisms in charge of its production [37,47], controlled ruminal acidosis [49] or improved organoleptic parameters of animal products [8]. Among the negative effects include the reduction in ruminal protein availability, less substrates digestibility, and the consequent reduction in animal performance [28]. Similarly, these plants must be subjected to animal response trials to evaluate their acceptability and the effect on animal performance and products quality [9,15].

4. Conclusions

A high diversity of woody and herbaceous native plants from tropical flooded savannas ecosystems was found, being the most abundant arboreal and shrub plants. Nutritional composition varied within the groups of arboreal, shrub, climbing, and herb species. At individual level, arboreal species such as G. americana, C. cf minor-grandiflora, M. nobilis, and A. Jahnii; shrub plants such as P. hispidium, I. carnea, S. reticulate, and H. furcellatus; and the climbing plant C. erosa stood out for their nutritional composition and digestibility. However, the evaluation of the plant species at a group level indicated that a mixed of 19 species, including G. americana, M. cf aculeatum, C. cf minor-grandiflora, A. niopoides, P. pinnatum, M. nobilis, M. calabura, C. vitifolium, A. montana, A. Jahnii, G.madruno, H. furcellatus, M. albicans, U. lobata, P. maribense, M. cf Afinis, S. reticulata, V. lasiocarpa, and C. erosa, constitutes a promising mixture forage alternative with adequate protein levels, low fiber fractions, and high digestibility that can be supplied to grazing animals under flooded savannah conditions. These results are promising since constitute the first report evaluating the individual and join nutritional contribution of flooded savanna flora diversity as a productive strategy in search of nutritional alternatives for livestock activity in the region.
The variability of the nutritional composition data in the evaluated flooded savannah native plants was explained in a 47% by the different fiber fractions (NDF, ADF, and lignin), CP, ash, and IVDMD. Before making a recommendation about the use of these plants, it is required to evaluate the presences of bioactive compounds, as well as the evaluation of animal acceptability and performance and the effect on products quality.

Author Contributions

Writing—original draft, methodology, formal analysis, research, M.V.-T. and A.S.-C.; Conceptualization, revision, and edition, A.S.-C.; Field data collection, plants botanical identification., A.M.B.-S., Laboratory analysis, D.A.G.-C. and R.D.H.-P.; Laboratory analysis, Formal analysis, and revision., L.A.G. and M.V.-T. All authors have read and accepted the publication version of the manuscript. All authors have read and agreed to the published version of the manuscript.

Funding

This research was funded by the national call for the strengthening of research, creation, and innovation in the national presence headquarters of the National University of Colombia 2019–2021. Hermes code: 47506; and by the Cooperative University of Colombia ID2957.

Institutional Review Board Statement

The study was conducted in accordance with the approved by the Institutional Committee for the Care and Use of Animals-CICUA of Universidad Nacional de Colombia Medellín (CICUA-053-21, 25 June 2021).

Data Availability Statement

The data are available upon reasonable request to the first author.

Acknowledgments

The authors thank the participation of the Livestock Committee of the flooded savannah region in the project development. We informed all the people and they agreed. The authors also thank the reviewers for their insightful comments.

Conflicts of Interest

The authors declare that there are no competing interests regarding the publication of this paper.

References

  1. Rippstein, G. Agroecología y Biodiversidad de las Sabanas en los Llanos Orientales de Colombia; N° 32; Centro Internacional de Agricultura Tropical: Cali, Columbia, 2001. [Google Scholar]
  2. Ocampo, A.; Peñuela, L. Manejo y Nutrición en Sabana Inundable como eje de la Producción y Reproducción de la Ganadería de cría.; Fortalecimiento Institucional y de Política para Incrementar la Conservación de la Biodiversidad en Predios Privados en Colombia; Red Colombiana de Reservas Naturales de la Sociedad, Fundación Natura, World Wildlife Fund, The Nature Conservancy, Parques Nacionales Naturales de Colombia: Bogotá, Colombia, 2014. [Google Scholar]
  3. Vélez-Terranova, O.M. Estrategias tecnológicas para la intensificación de la productividad ganadera en condiciones de sabanas inundables en la Orinoquía colombiana. Trop. Subtrop. Agroecosyst. 2019, 22, 257–266. [Google Scholar]
  4. FAO. New Zealand Agricultural Greenhouse Gas Research Centre. In Low Emissions Development of the Beef Cattle Sector in Uruguay—Reducing Enteric Methane for Food Security and Livelihoods; FAO: Roma, Italy, 2017. [Google Scholar]
  5. Latawiec, A.E.; Strassburg, B.B.N.; Valentim, J.F.; Ramos, F.; Alves-Pinto, H.N. Intensification of cattle ranching production systems: Socioeconomic and environmental synergies and risks in Brazil. Animal 2014, 8, 1255–1263. [Google Scholar] [CrossRef] [PubMed] [Green Version]
  6. Broom, D.M.; Galindo, F.A.; Murgueitio, E. Sustainable, efficient livestock production with high biodiversity and good welfare for animals. Proc. R. Soc. B 2013, 280, 2025. [Google Scholar] [CrossRef] [PubMed] [Green Version]
  7. De Moraes, A.; Carvalho, P.C.D.F.; Anghinoni, I.; Lustosa, S.B.C.; Costa, S.E.V.G.D.A.; Kunrath, T.R. Integrated crop–livestock systems in the Brazilian subtropics. Eur. J. Agron. 2014, 57, 4–9. [Google Scholar] [CrossRef]
  8. Reiné, R.; Ascaso, J.; Barrantes, O. Nutritional quality of plant species in pyrenean hay Meadows of high diversity. Agronomy 2020, 10, 883. [Google Scholar] [CrossRef]
  9. Ramos, L.; Apráez, J.; Cortes, K.; Apráez, J. Nutritional, antinutritional and phenological characterization of promising forage species for animal feeding in a cold tropical zone. Rev. Cienc. Agríc. 2021, 38, 86–96. [Google Scholar] [CrossRef]
  10. Arauca. Clima: Arauca, Colombia. Aeropuerto Sntiago Pérez Quiróz. Available online: http://es.allmetsat.com/clima/venezuela.php?code=80099 (accessed on 20 June 2020).
  11. Holdridge, L.R. Ecología Basada en Zonas de Vida; IICA: San Jose, Costa Rica, 1987; p. 216. [Google Scholar]
  12. Schultze-kraft, R. Colección de Germoplasma en el Campo; Manual para la Colección, Preservación y Caracterización de Recursos Forrajeros Tropicales; Centro Internacional de Agricultura Tropical: Cali, Colombia, 1979. [Google Scholar]
  13. AOAC. Official Methods of Analysis of AOAC International. Agricultural Chemicals. Contaminants and Drugs; Horwitz, W., Ed.; AOAC: Rockville, MD, USA, 2000; Volume 1. [Google Scholar]
  14. Van Soest, P.V.; Robertson, J.B.; Lewis, B.A. Methods for dietary fiber. Neutral detergent fiber and nonstarch polysaccharides in relation to animal nutrition. J. Dairy Sci. 1991, 74, 3583–3597. [Google Scholar] [CrossRef]
  15. Linn, J.G.; Martin, N.P. Forage Quality Tests and Interpretation—AG-F0-2637. Minnesota Extension Service; University of Minnesota Agriculture: St. Paul, MN, USA, 1989; pp. 1–5. [Google Scholar]
  16. InfoStat. InfoStat, Versión 2020. Manual del Usuario; Universidad Nacional de Córdoba: Córdoba, Argentina, 2020. [Google Scholar]
  17. Al-Arif, M.A.; Suwanti, L.T.; Estoepangestie, A.S.; Lamid, M. The Nutrients Contents, Dry Matter Digestibility, Organic Matter Di-gestibility, Total Digestible Nutrient, and NH3 Rumen Production of Three Kinds of Cattle Feeding Models. In The Veterinary Medicine International Conference; KnE Life Sciences: Dubai, United Arab Emirates, 2017; pp. 338–343. [Google Scholar]
  18. Fasae, O.A.; Sowande, O.S.; Popoola, A.A. Evaluation of selected leaves of trees and foliage of shrubs as fodder in ruminant production. J. Agric. Sci. Environ. 2010, 10, 36–44. [Google Scholar]
  19. Zhou, H.; Li, M.; Zi, X.; Xu, T.; Hou, G. Nutritive Value of Several Tropical Legume Shrubs in Hai-nan Province of China. J. Anim. Vet. Adv. 2011, 10, 1640–1648. [Google Scholar]
  20. Apráez, E.; Gálvez, A.L.; Navia, J.F. Evaluación nutricional de arbóreas y arbustivas de bosque muy seco tropical (bms-T) en producción bovina. Rev. Cienc. Agríc. 2017, 34, 98–107. [Google Scholar] [CrossRef] [Green Version]
  21. Holden, J.M.; Harnly, J.M.; Beecher, C.R. Composición de los Alimentos. Conocimientos Actuales Sobre Nutrición; ILSI: Washington, DC, USA, 2003; pp. 645–657. [Google Scholar]
  22. Bakshi, M.P.S.; Singh, M.P.; Wadhwa, M.; Singh, B. Nutritional evaluation of forest tree leaves as livestock feed in sub mountainous region of India. Indian J. Anim. Sci. 2011, 81, 276–281. [Google Scholar]
  23. Domínguez-Gómez, T.G.; González-Rodríguez, H.; Ramírez-Lozano, R.G.; Cantú-Silva, I.; Gómez-Meza, M.V.; Cantú-Ayala, C.M.; Alvarado, M.D.S. Nutritional Profile of Four Shrub Species, Northeastern Mexico. Int. J. Bio-Res. Stress Manag. 2013, 4, 001–008. [Google Scholar]
  24. Gulizia, J.P.; Downs, K.M. A Review of Kudzu’s Use and Characteristics as Potential Feedstock. Agriculture 2019, 9, 220. [Google Scholar] [CrossRef] [Green Version]
  25. Salah, N.; Sauvant, D.; Archimède, H. Nutritional requirements of sheep, goats and cattle in warm climates: A meta-analysis. Animal 2014, 8, 1439–1447. [Google Scholar] [CrossRef] [PubMed]
  26. Khan, S.; Anwar, K.; Kalim, K.; Saeed, A.; Shah, S.Z.; Ahmad, Z.; Ikram, H.M.; Khan, S.; Safirullah. Nutritional Evaluation of Some Top Fodder Tree Leaves and Shrubs of District Dir (Lower), Pakistan as a quality livestock feed. Int. J. Curr. Microbiol. Appl. Sci. 2014, 3, 941–947. [Google Scholar]
  27. Debela, M.; Animut, G.; Eshetu, M. Evaluation of the Nutritional Composition of Selected Indigenous Fodder Trees and Shrubs in Daro Labu District, Eastern Ethiopia. J. Biol. Agric. Healthc. 2017, 7, 58–61. [Google Scholar]
  28. Mudau, H.S.; Mokoboki, H.K.; Ravhuhali, K.E.; Mkhize, Z. Nutrients Profile of 52 Browse Species Found in Semi-Arid Areas of South Africa for Livestock Production: Effect of Harvesting Site. Plants 2021, 10, 2127. [Google Scholar] [CrossRef] [PubMed]
  29. Lee, M.A. A global comparison of the nutritive values of forage plants grown in contrasting environments. J. Plant Res. 2018, 131, 641–654. [Google Scholar] [CrossRef]
  30. Peñuela, L.; Fernández, A.P.; Castro, F.; Ocampo, A. Uso y Manejo de Forrajes Nativos en la Sabana Inundable de la Orinoquia; Convenio de Cooperación Interinstitucional; The Nature Conservancy, Fundación Horizonte Verde, Fundación Biodiversidad de España, Corporación Autónoma Regional de la Orinoquia. Universidad de los Llanos: Villavicencio, Colombia, 2011. [Google Scholar]
  31. Gupta, A.R.; Bandyopadhyay, S.; Sultana, F.; Swarup, D. Heavy metal poisoning and its impact on livestock health and production system. Indian J. Anim. Health 2021, 60, 1–23. [Google Scholar] [CrossRef]
  32. Pereira, G.F.; Emerenciano Neto, J.V.; Difante, G.D.S.; Assis, L.C.D.S.L.C.; Lima, P.D.O.; Santos, R.D.S. Production and quality of tropical grasses at different regrowth intervals in the Brazilian semiarid. Acta Sci. 2021, 43, e52842. [Google Scholar] [CrossRef]
  33. Van Soest, P.J. Development of comprehensive system of feed analysis and its application to forages. J. Anim. Sci. 1967, 26, 119–128. [Google Scholar] [CrossRef]
  34. Harper, K.J.; McNeill, D.M. The Role iNDF in the Regulation of Feed Intake and the Importance of Its Assessment in Subtropical Ruminant Systems (the Role of iNDF in the Regulation of Forage Intake). Agriculture 2015, 5, 778–790. [Google Scholar] [CrossRef] [Green Version]
  35. Cortiana, T.A.A.; Regiani, S.M.; Cardoso, J.G.; Carvalho, F.J.L.; Henz, É.L.; Pedro, J.P. Production and chemical composition of grasses and legumes cultivated in pure form, mixed or in consortium. Acta Sci. Anim. Sci. 2017, 39, 235–241. [Google Scholar]
  36. Melo, C.D.; Maduro, D.C.S.A.M.; Wallon, S.; Borba, A.E.S.; Madruga, J.; Borges, P.A.V.; Ferreira, M.T.; Elias, R.B. Influence of climate variability and soil fertility on the forage quality and productivity in Azorean pastures. Agriculture 2022, 12, 358. [Google Scholar] [CrossRef]
  37. Patra, A.; Saxena, J. A new perspective on the use of plant secondary metabolites to inhibit methanogenesis in the rumen. Phytochemistry 2010, 71, 1198–1222. [Google Scholar] [CrossRef]
  38. Paciullo, D.S.C.; Pires, M.F.A.; Aroeira, L.J.M.; Morenz, M.J.F.; Maurício, R.M.; Gomide, C.A.M.; Silveira, S.R. Sward characteristics and performance of dairy cows in organic grass–legume pastures shaded by tropical trees. Animal 2014, 8, 1264–1271. [Google Scholar] [CrossRef] [Green Version]
  39. Leng, R.A. Evaluation of tropical feed resources for ruminant livestock. In Tropical Feeds and Feeding Systems; FAO: Rome, Italy, 1995; Available online: https://www.fao.org/ag/aga/agap/frg/econf95/pdf/evalu.pdf (accessed on 20 June 2020).
  40. Mlay, P.S.; Pereka, A.; Phiri, E.; Balthazary, S.; Igusti, J.; Hvelplund, T.; Weisbjerg, M.R.; Madsen, J. Feed value of selected tropical grasses, legumes and concentrates. Vet. Arh. 2006, 76, 53–63. [Google Scholar]
  41. Flores, O.I.; Bolivar, D.M.; Botero, J.A.; Ibrahim, M.A. Parámetros nutricionales de algunas arbóreas leguminosas y no leguminosas con potencial forrajera para la suplementación de ruminantes en el trópico. Livest. Res. Rural. Dev. 1998, 10, 8–15. [Google Scholar]
  42. Indah, A.S.; Permana, I.G.; Despal, D. Determination dry matter digestibility of tropical forage using nutrient compisition. IOP Conf. Ser. Earth Environ. Sci. 2020, 484, 012113. [Google Scholar] [CrossRef]
  43. Phelan, P.; Moloney, A.P.; McGeough, E.J.; Humphreys, J.; Bertilsson, J.; O’Riordan, E.G.; O’Kiely, P. Forage Legumes for Grazing and Conserving in Ruminant Production Systems. Crit. Rev. Plant Sci. 2014, 34, 281–326. [Google Scholar] [CrossRef]
  44. Fentahun, S.; Urge, M.; Mekuriaw, Y. Seasonal variation in Nutritional value of major browse species in North Western, Ethiopia. J. Plant Biotechnol. Microbiol. 2020, 3, 1–7. [Google Scholar]
  45. Ravhuhali, K.E.; Msiza, N.H.; Mudau, H.S. Seasonal dynamics on nutritive value, chemical estimates and in vitro dry matter degradability of some woody species found in rangelands of South Africa. Agrofor. Syst. 2022, 96, 23–33. [Google Scholar] [CrossRef]
  46. Evitayani, W.L.; Fariani, A.; Ichinohe, T.; Fujihara, T. Study on Nutritive Value of Tropical Forages in North Sumatra, Indonesia. Asian-Australas. J. Anim. Sci. 2004, 17, 1518–1523. [Google Scholar]
  47. Vélez-Terranova, M.; Campos-Gaona, R.; Sánchez-Guerrero, H. Uso de metabolitos secundarios de las plantas para reducir la metanogénesis ruminal. Trop. Subtrop. Agroecosyst. 2014, 17, 489–499. [Google Scholar]
  48. Amiri, F.; Mohamed-Sharif, A.R. Comparison of nutritive values of grasses and legume species using forage quality index. Songklanakarin J. Sci. Technol. 2012, 34, 577–586. [Google Scholar]
  49. Hutton, P.; White, C.L.; Durmic, Z.; Vercoe, P.E. Eremophila glabra is an Australian plant that reduces lactic acid accumulation in an in vitro glucose challenge designed to simulate lactic acidosis in ruminants. Animal 2009, 3, 1254–1263. [Google Scholar] [CrossRef]
Figure 1. Floodplain savannah region, department of Arauca in Colombian eastern. Circle: flooded savannas ecosystem; Red color. Location of the department of Arauca in Colombia (latitude: 07°05′25″ N, longitude: 70°45′42″ W).
Agriculture 12 01613 g001
Figure 2. Some of the transects made through the “montane forests” (A,C), gallery forests (B,D) and open savannah (C) ecosystem. Red, blue, green and yellow lines were the transects covered in different moments.
Agriculture 12 01613 g002aAgriculture 12 01613 g002b
Figure 3. Star graph of the behavior of the nutritional quality variables of the plants assigned to each cluster. OM: organic matter; NDF: neutral detergent fiber; ADF: acid detergent fiber; Lig: lignin; IVDMD: in vitro dry matter digestibility. Cluster 1: C.venezuelanus, M. multijugum, H. chorymbosa, E. cribrata, M. spicata, R. cf phaseoloides-reticulata, E. polystachya, P. cf laevigata and V. venezuelana. Cluster 2: C.sylvestris, P. elsiae, V. orinocensis, H. americanus, T. micrantha, C. collococca, G. guianensis, P. hispidium, A. molli, T. lappula, I. carnea, L. densiflorus, H. indicum, and T. geniculata. Cluster 3: G. americana, M. cf aculeatum, C. cf minor-grandiflora, A. niopoides, P. pinnatum, M. nobilis, M. calabura, C. vitifolium, A. montana, A. Jahnii, G.madruno, H. furcellatus, M. albicans, U. lobata, P. maribense, M. cf Afinis, S. reticulata, V. lasiocarpa and C. erosa.
Agriculture 12 01613 g003
Figure 4. Biplot obtained by PCA of nutritional quality variables of the plants included in the study. PC: principal component; OM: organic matter; NDF: neutral detergent fiber; ADF: acid detergent fiber; Lig: lignin; IVDMD: in vitro dry matter digestibility. Cluster 1 (); Cluster 2 (); Cluster 3 ().
Agriculture 12 01613 g004
Table 1. Botanical characteristics of the selected plants.
Growth HabitSpecieBotanical Family
Arboreal plants
(n = 22)
Annona JahniiAnnonaceae
Annona montanaAnnonaceae
Cochlospermum vitifoliumBixaceae
Trema micranthaCannabaceae
Clusia cf minor grandifloraClusiaceae
Garcinia madrunoClusiaceae
Connarus venezuelanus Var. orinocencsisConnaraceae
Cordia collococcaCordiaceae
Albizia niopoidesFabaceae (Mimosoideae)
Hydrochorea chorymbosaFabaceae (Mimosoideae)
Machaerium cf aculeatumFabaceae (Caesalpinioideae)
Macrolobium multijugumFabaceae (Caesalpinioideae)
Platymiscium pinnatumFabaceae (Faboideae)
Vitex orinocensisLamiceae
Heliocarpus americanusMalvaceae
Mutingia calaburaMuntingiaceae
Eugenia cribrataMyrtaceae
Margaritaria nobilisPhyllanthaceae
Phyllantus elsiaePhyllanthaceae
Genipa americanaRubiaceae
Casearia sylvestrisSalicaceae
Vochysia venezuelanaVochysiaceae
Shrubs (n = 13)Ipomoea carneaConvolvulaceae
Rhynchosia cf phaseoloides-reticulataFabaceae (Faboideae)
Senna reticulataFabaceae (Caesalpinioideae)
Hibiscus furcellatusMalvaceae
Melochia spicataMalvaceae
Triunmfetta lappulaMalvaceae
Urena lobataMalvaceae
Miconia albicansMelastomataceae
Miconia cf AfinisMelastomataceae
Psidium maribenseMyrtaceae
Aegiphila molliLamiceae
Guapira guianensisNyctaginaceae
Piper hispidiumPiperaceae
Climbing plants
(n = 5)
Peritassa cf laevigataCelastraceae
Entada polystachyaFabaceae (Mimosoideae)
Lonchucarpus densiflorusFabaceae (Faboideae)
Vigna lasiocarpaFabaceae (Faboideae)
Cissus erosaVitaceae
Herbs (n = 2)Heliotropium indicumHeliotropiaceae
Thalia geniculataMarantaceae
Table 2. Nutritional characteristics (%) of arboreal plants on dry matter basis.
SpecieDMOMCPAshNDFADFLigninIVDMD
C. venezuelanus54.5 a96.7 ab9.7 fgh3.3 ij60.4 cde45.1 bc29.6 b25.6 i
G. Americana34.4 fgh94.3 e15.2 cdef5.7 f45.8 ghij32.5 fgh20.3 d88.7 a
M. cf aculeatum38.1 def96.2 bc15.8 cdef3.8 hi61.8 cd36.6 efg14.0 fg49.1 ef
C. sylvestris41.2 cde91.1 h12.8 defgh9.0 c56.8 def41.1 bcde24.8 c36.8 gh
V. orinocensis30.5 hi93.0 f15.2 cdef7.0 e59.6 cde37.5 def19.5 de42.9 fg
C. cf minor-grandiflora18.2 k92.9 f8.8 gh7.2 e43.6 hij30.5 ghi12.3 fg74.5 b
A. niopoides53.4 ab94.8 de25.3 a5.2 fg49.5 fghi28.5 hi13.1 fg44.4 fg
M. multijugum44.4 cd96.3 bc15.6 cdef3.8 hi71.1 ab52.1 a31.8 b26.9 i
P. elsiae35.6 efgh91.4 gh14.6 cdefg8.6 cd60.9 cde40.7 cde22.0 cd42.9 fg
V. venezuelana31.9 fghi94.3 e8.0 h5.7 f54.6 def40.7 cde25.4 c29.4 hi
H. chorymbosa47.0 bc97.6 a13.1 defgh2.4 j75.7 a54.3 a36.5 a27.1 i
P. pinnatum36.2 efgh95.3 cde16.6 cde4.8 fgh53.3 efg34.1 efgh19.9 de59.2 d
H. americanus22.5 jk90.4 h23.1 ab9.7 c61.2 cde37.2 defg22.1 cd69.2 bc
M. nobilis25.7 ij92.5 fg17.7 bcde7.6 de38.4 j16.3 j5.0 i86.5 a
T. micrantha36.9 efg83.9 j12.1 efgh16.1 a51.6 fgh37.7 def23.0 cd48.3 f
M. calabura33.0 fghi92.6 f18.0 bcde7.4 e50.2 fghi23.4 ij10.3 gh39.3 g
C. vitifolium31.9 fghi95.5 cd18.7 bcd4.5 gh42.4 ij23.4 ij15.7 ef42.1 fg
A.montana31 ghi92.6 f12.7 defgh7.4 e52.7 efg30.9 fghi7.8 hi62.6 cd
E. cribrata32.4 fghi95.0 de13.2 defgh5.1 fg66.3 bc48.6 ab29.6 b29.1 hi
C. collococca31.7 fghi87.4 i16.7 cde12.6 b61.0 cde44.4 bcd22.2 cd43.7 fg
A.Jahnii31.8 fghi94.2 e20.5 abc5.8 f52.9 efg24.2 i7.9 hi77.0 b
G. madruno38.0 defg95.1 de9.9 fgh5.0 fg55.9 def40.6 cde19.8 de56.85 de
SEM2.370.351.110.362.912.461.372.98
p-value<0.0001<0.0001<0.0001<0.0001<0.0001<0.0001<0.0001<0.0001
DM: dry matter; OM: organic matter; CP: crude protein; NDF: neutral detergent fiber; ADF: acid detergent fiber; SEM: standard error mean; IVDMD: in vitro dry matter digestibility. Different letters in the same column differ statistically (p < 0.05). C. venezuelanus: Connarus venezuelanus Var. Orinocencsis; G. Americana: Genipa americana; M. cf aculeatum: Machaerium cf aculeatum; C. sylvestris: Casearia sylvestris; V. orinocensis: Vitex orinocensis; C. cf minor-grandiflora: Clusia cf minor-grandiflora; A. niopoides: Albizia niopoides; M. multijugum: Macrolobium multijugum; P. elsiae: Phyllantus elsiae; V. venezuelana: Vochysia venezuelana; H. chorymbosa: Hydrochorea chorymbosa; P. pinnatum: Platymiscium pinnatum; H. americanus: Heliocarpus americanus; M. nobilis: Margaritaria nobilis; T. micrantha: Trema micrantha; M. calabura: Mutingia calabura; C. vitifolium: Cochlospermum vitifolium; A.montana: Annona montana; E. cribrata: Eugenia cribrata; C. collococca: Cordia collococca; A.Jahnii: Annona Jahnii; G. madruno: Garcinia madruno.
Table 3. Nutritional characteristics (%) of the evaluated shrubs, climbing and herb plants on dry matter basis.
SpecieDMOMCPAshNDFADFLigninIVDMD
Shrubs
M. spicata42.8 b96.1 a12.4 ef4.0 h70.4 a52.3 a32.5 a29.3 gh
H. furcellatus25.3 f95.4 ab15.6 d4.7 gh44.4 e23.2 gh10.8 f61.3 de
R. cf phaseoloides-reticulata34.4 d96.1 a16.1 d4.0 h64.0 b46.2 b27.2 b26.6 hi
M. albicans44.4 b91.6 ef9.4 fg8.4 cd36.1 f24.1 gh16.8 de33.8 g
G. guianensis28.3 e90.0 g25.8 a10.1 b58.9 c28.8 ef14.7 e56.4 e
U. lobata34.4 d93.3 d15.0 de6.7 e57.1 c35.2 c19.6 cd48.0 f
P. maribense37.4 c94.6 bc2.5 h5.4 fg46.5 e30.8 de15.6 e34.3 g
P. hispidium35.2 d88.3 h16.0 d11.7 a38.3 f18.3 j8.0 g91.3 a
M. cf Afinis50.6 a93.6 cd7.7 g6.4 ef32.1 g25.2 fg21.2 c22.9 i
A, molli19.9 g91.9 ef22.5 bc8.1 cd52.4 d29.1 e17.2 de68.4 c
T. lappula20.4 g92.8 de21.1 c7.3 de59.0 c33.7 cd19.4 cd64.7 cd
I. carnea22.2 g91.4 f25.2 ab8.6 c46.5 e21.4 hi10.7 f87.7 a
S. reticulata24.4 f93.7 cd22.9 abc6.3 ef45.9 e19.0 ij5.2 h77.3 b
SEM0.460.380.550.380.941.180.921.97
p-value<0.0001<0.0001<0.0001<0.0001<0.0001<0.0001<0.0001<0.0001
Climbing plants
V. lasiocarpa30.9 b95.2 c13.2 c4.9 b62.0 b38.5 b11.3 e54.3 b
C. erosa19.4 c93.6 d13.0 c6.5 a49.6 c31.7 c13.9 d74.5 a
E. polystachya45.4 a96.5 b15.4 b3.5 c60.3 b44.3 a29.5 b34.1 d
L.densiflorus42.8 a93.6 d19.0 a6.4 a58.8 b35.4 bc19.0 c38.7 c
P. cf laevigata48.9 a97.6 a8.8 d2.5 d66.5 a47.9 a31.7 a39.6 c
SEM3.130.110.220.111.161.450.610.83
p-value0.0011<0.0001<0.0001<0.00010.00020.0005<0.0001<0.0001
Herbs
H. indicum22.482.6 b27.3 a17.6 a48.3 b30.5 a20.3 a43.2 a
T. geniculata20.591.8 a17.5 b8.2 b65.4 a28.6 a7.2 b46.0 a
SEM0.310.080.410.081.310.560.131.95
p-valueNS0.00010.00360.00010.0114NS0.0002NS
DM: dry matter; OM: organic matter; CP: crude protein; NDF: neutral detergent fiber; ADF: acid detergent fiber; SEM: standard error mean; NS: non-significant effect; IVDMD: in vitro dry matter digestibility. Different letters in the same column differ statistically (p < 0.05). Shrubs. M. spicata: Melochia spicata; H. furcellatus: Hibiscus furcellatus; R. cf phaseoloides-reticulata: Rhynchosia cf phaseoloides-reticulata; M. albicans: Miconia albicans; G. guianensis: Guapira guianensis; U. lobate: Urena lobate; P. maribense: Psidium maribense; P. hispidium: Piper hispidium; M. cf Afinis: Miconia cf Afinis; A, molli: Aegiphila molli; T. lappula: Triunmfetta lappula; I. carnea: Ipomoea carnea; S. reticulata: Senna reticulate. Climbing plants. V. lasiocarpa: Vigna lasiocarpa; C. erosa: Cissus erosa; E. polystachya: Entada polystachya; L. densiflorus: Lonchucarpus densiflorus; P. cf laevigata: Peritassa cf laevigata. Herbs. H. indicum: Heliotropium indicum; T. geniculata: Thalia geniculata.
Table 4. Estimated dry matter intake and relative feed values of the evaluated plants.
SpecieDMIRFVClassification
Arboreal Plants
C. venezuelanus2.0394
G. americana2.61801
M. cf aculeatum1.9744
C. sylvestris2.1604
V. orinocensis2.0674
C. cf minor grandiflora2.81591
A. niopoides2.4834
M. multijugum1.7354
P. elsiae2.0654
V. venezuelana2.2504
H. chorymbosa1.6334
P. pinnatum2.31043
H. americanus2.01053
M. nobilis3.12101
T. micrantha2.3874
M. calabura2.4734
C. vitifolium2.8924
A.montana2.31113
E. cribrata1.8414
C. collococca2.0674
A.Jahnii2.31352
G. madruno2.1954
Shrubs
M. spicata1.7394
H. furcellatus2.71282
R. cf phaseoloides-reticulata1.9394
M. albicans3.3874
G. guianensis2.0894
U. lobata2.1784
P. maribense.2.6694
P. hispidium3.12221
M. cf Afinis3.7664
A, molli2.31223
T. lappula2.01023
I. carnea2.61751
S. reticulata2.61571
Climbing plants
V. lasiocarpa1.9814
C. erosa2.41402
E. polystachya2.0534
L.densiflorus2.0614
P. cf laevigata1.8554
Herbs
H. indicum2.5834
T. geniculata1.8654
DMI: dry matter intake (120/NDF%); RFV: relative feed value; Classification: 1st (≥150), 2nd (149–125), 3rd (124–100) and 4th (≤99); Bold: Plants with the best result.
Table 5. PCA eigenvalues obtained with the nutritional quality data of the evaluated plants.
LambdaValueProportionCum. Prop.
13.270.470.47
21.660.240.71
30.970.140.84
40.810.120.96
50.270.041
Cum. Prop: cumulative proportion.
Table 6. PCA eigenvectors obtained with the nutritional quality data of the evaluated plants.
Variablese1e2
OM0.39−0.50
CP−0.250.28
NDF0.420.32
ADF0.490.29
Lignin0.450.31
Ash−0.390.50
IVDMD−0.12−0.37
OM: organic matter; CP: crude protein; NDF: neutral detergent fiber; ADF: acid detergent fiber. IVDMD: in vitro dry matter digestibility.
Publisher’s Note: MDPI stays neutral with regard to jurisdictional claims in published maps and institutional affiliations.

