Article

Characterization of Some Cichorium Taxa Grown under Mediterranean Climate Using Morphological Traits and Molecular Markers

by
Ahmed M. El-Taher
1,
Hala A. Elzilal
2,
Hany S. Abd El-Raouf
1,3,
Emad Mady
4,5,
Khalid S. Alshallash
6,
Rasha M. Alnefaie
7,
Ehab M. B. Mahdy
8,
Osama G. Ragab
9,
Elhassan A. Emam
10,
Ibrahim A. Alaraidh
11,
Timothy O. Randhir
5,* and
Mohamed F. M. Ibrahim
12,*
1
Department of Agricultural Botany, Faculty of Agriculture, Al-Azhar University, Cairo 11884, Egypt
2
Department of Science and Technology, College of Ranyah, Taif University, P.O. Box 11099, Taif 21944, Saudi Arabia
3
Biology Department, University College, Taif University, Turaba 29731, Saudi Arabia
4
Horticulture Department, Faculty of Agriculture, Al-Azhar University, Cairo 11884, Egypt
5
Department of Environmental Conservation, University of Massachusetts, Amherst, MA 01003, USA
6
College of Science and Humanities-Huraymila, Imam Mohammed Bin Saud Islamic University (IMSIU), Riyadh 11432, Saudi Arabia
7
Biology Department, Faculty of Science Albaha University, Albaha 65779, Saudi Arabia
8
National Gene Bank (NGB), Agricultural Research Center (ARC), Giza 12619, Egypt
9
Botany and Microbiology Department, Faculty of Science (Boys Branch), Al-Azhar University, Cairo 11884, Egypt
10
Department of Microbiology and Cell Biology, Indian Institute of Science, Bangalore 560012, India
11
Department of Botany and Microbiology, Faculty of Science, King Saud University, Riyadh 11362, Saudi Arabia
12
Department of Agricultural Botany, Faculty of Agriculture, Ain Shams University, Cairo 11566, Egypt
*
Authors to whom correspondence should be addressed.
Plants 2023, 12(2), 388; https://doi.org/10.3390/plants12020388
Submission received: 23 November 2022 / Revised: 2 January 2023 / Accepted: 7 January 2023 / Published: 13 January 2023
(This article belongs to the Special Issue Mediterranean Plants II)

Abstract

:
The verification of taxonomic identities is of the highest significance in the field of biological study and categorization. Morpho-molecular characterization can clarify uncertainties in distinguishing between taxonomic groups. In this study, we characterized five local taxa of the genus Cichorium using morphological and molecular markers for taxonomic authentication and probably future genetic improvement. The five Cichorium taxa grown under the Mediterranean climate using morphological traits and molecular markers showed variations. The examined taxa showed a widespread range of variations in leaf characteristics, i.e., shape, type, texture, margin, and apex and cypsela characteristics i.e., shape, color, and surface pattern. The phylogenetic tree categorized the Cichorium intybus var. intybus and C. intybus var. foliosum in a single group, whereas C. endivia var. endivia was grouped separately. However, C. endivia var. crispum and C. endivia subsp. pumilum were classified as a cluster. The recorded variance between classes using the molecular markers SCoT, ISSR, and RAPD was documented at 34.43%, 36.62%, and 40.34%, respectively. Authentication using molecular tools proved the usefulness of a dichotomous indented key, as revealed by morphological identification. The integrated methodology using morphological and molecular assessment could support improved verification and authentication of the various taxa of chicory. It seems likely that the Egyptian chicory belongs to C. endivia subsp. pumilum.

1. Introduction

The Asteraceae plants, the world’s largest and most diversified flowering plant family, containing 1600–1700 genera and about 25,000–35,000 species, is subdivided into 13 subfamilies, including Barnadesioideae, Cichorioideae, and Asteroideae [1,2]. The phylogeny and diversifications of the Asteraceae family have been impeded by the absence of extensive research into several genera and representative species. It is known that chicory and endive were grown in ancient Egypt, and currently they represent important components in Mediterranean diets. Both are now cultivated worldwide, especially in the Mediterranean basin. The subfamily Cichorioideae has the tribe Lactuceae, which contains the Cichorium genus. This genus includes Cichorium intybus L. (chicory) and C. endivia L. (endive), representing two distinct species recognized according to provenance. The European flora is referred to the C. intybus, C. spinosum, and C. endivia species, subdividing the latter into two subspecies; one is cultivated (subsp. Endivia) (cultivated) and the other is wild (subsp. divaricatum) as detailed in Tutin et al. [3]. The reference to the Italian flora combines three wild species of C. intybus and C. spinosum, with the botanical variety glabratum (Presl) Fiori, along with C. pumilum and C. endivia in a single cultivated species [4]. Asteraceae in Egypt includes one wild species of Cichorium [5].
Seven Cichorium species were characterized morphologically by a revision of Bedarff [6]. C. endivia and C. intybus split further into two subspecies; C. endivia contained subsp. endivia and subsp. divaricatum, while C. intybus was subdivided into subsp. intybus and subsp. glabratum. This diverges from the Flora Europaea database, Royal Botanical Gardens, which indicates only three subspecies of C. intybus: subsp. foliosum (Hegi) Janch., subsp. glabratum (C. Presl) Arcang., and subsp. sativum (Bisch.) Janch.
The integration between morphological characteristics and molecular findings characterized the two cultivated and well-known Cichorium species, C. intybus and C. endivia, as well as the wild species of C. pumilum and C. spinosum [7]. In addition, two other species were not found in Europe, C. calvum Schultz-Bip and C. bottae Defl. C. calvum is prevalent in hot and dry areas of Southwestern Asia and the Middle East., while C. bottae is found only in Saudi Arabia and Yemen. Finally, in Italian flora, three species of the genus were documented: C. endivia, with the two subspecies pumilum (Jacq) Cout. and endivia Hegi, C. intybus, altogether with the two subspecies glabratum (C. Presl) Arcang., and intybus, and C. spinosum [8].
Recently, Bartolucci et al. [9] published an updated list of the vascular flora native to Italy, including the genus Cichorium with three species: C. endivia L. subsp. pumilum (Jacq.) Cout., C. intybus L., and C. spinosum L.
Cichorium intybus could be classified into four varieties based on the purpose and usage for which it was cultivated [10]. C. intybus subsp. intybus can be categorized into five major groups, including all cultivated forms of chicory [11,12]. Apart from wild accessions, the first group refers to the var. foliosum, which contains the Witloof chicory. It is suggested that the Witloof chicory (Cichorium intybus L. var. foliosum, syn. Belgian endive, chicon) taken from Magdeburg roots should be classified under var. sativum with all the other root types; many reviews referred to Witloof as having botanical characteristics of the variety foliosum [7,12,13,14].
Jana and Mukherjee [15] described the testa structure of C. endivia and C. intybus. C. intybus, a biennial species, which has a characteristic inflorescence (capitulum) unique in the family containing 15–25 hermaphrodite flowers with an involucre protecting the receptacle. Every flower possesses a gamopetalous and ligulate corolla with five filamentous stamens. Stamens form a column with fused anthers surrounding the pistil with a bifid stigma [16].
Molecular investigations have been efficiently employed to evaluate the identification and relationship of various taxa. Numerous PCR-based molecular markers are widely used such as random amplified fragment DNA (RAPD), inter-simple sequence repeats (ISSR), and start codon target (SCoT) applying in various taxa [17,18,19,20], which can be used to estimate genetic relationships and variations between and within taxa [21,22,23]. A limited number of molecular studies have integrated with morphological differentiations in relation to biodiversity, identification, and taxonomy in the taxa of chicory. The genetic identification and differentiation of a taxon are applied in various species such as Brassica [24], broccoli and cauliflower [25], lettuce and Jew’s mallow [26], and tomato [27]. In Cichorium, various molecular markers were applied [7,28,29,30,31,32,33,34,35,36,37]. Some of these markers have been used for genetic map construction [31,32], genetic variation [33,34], gene flow [35], population structure [37], and hybridization [36].
The Egyptian chicory (“Sreece” according to its local Arabic name) belongs to the C. endivia sub-species pumilum in the Asteraceae family. However, several published articles from Egypt still incorrectly assume that the Egyptian chicory belongs to the C. intybus species [38,39,40]. The integrated approach using micro-macro morphological assessment and molecular techniques could help to improve authentication and verification of the species and taxa. With the lack of extensive sampling of several genera and representative species, the family’s phylogeny and diversifications have been hampered by the limited availability of research covering species and varietal diversity, along with the high resemblance among species.
This study highlights the morphological and molecular characteristics of five taxa of the genus Cichorium through assessment and discrimination to determine the relationships among taxa. The micro- and macro-morphological data generated a relationship among the taxa of Cichorium, while the PCR-based markers provided information on Cichorium’s genetic relatedness. The goal of this study is to present analyses to accurately classify the studied chicory species. In order to resolve the classification ambiguity, we offer a robust argument by documenting morphological and genetic differences between the C. endivia and C. intybus species of chicory.

2. Results

2.1. Morphological Characterization

2.1.1. Leaf Morphology

The leaves of the studied Cichorium taxa have the following characteristics in common: they are simple, reticulate, pinnate, glabrous, and exstipulate, and have symmetrical epulvinate bases (Table 1 and Figure 1). The shape of the studied leaves is obovate in C. endivia var. crispum, oblancelate in C. endivia subsp. pumilum, and spathulate in C. intybus var. intybus, C. intybus var. foliosum, and C. endivia var. endivia. The leaves are petiolate in C. intybus var. intybus, C. intybus var. foliosum, and C. endivia subsp. pumilum but, they are sessile in C. endivia var. endivia and C. endivia var. crispum. The leaf blade is simple in all of the studied plants, except C. endivia var. crispum, whose leaf blade is pinnately lobed. Margins of the leaves are dentate in most of the examined taxa, as in C. intybus var. intybus, C. endivia var. endivia, and C. endivia var. crispum, but they are finely dentate in C. intybus var. foliosum and C. endivia subsp. pumilum. All of the investigated plants have obtuse leaf apex shapes, as in Cichorium. The midrib is distinct in all plants except C. endivia var. crispum. Generally, within each taxon, remarkable variability was not noticed.

2.1.2. Cypsela Morphology

Details of the micro-morphological characteristics of the cypsela of Cichorium are presented in Figure 2 and Figure 3 and Table 1. The cypsela surface is smooth and sometimes rough, and the shape of the hilum is circular. The anticlinal wall shape is straight, and there is pappus persistence in all studied taxa. Fruits of Cichorium are cypsela (achene). The shape is oblong in C. intybus var. intybus, C. endivia var. endivia, and C. endivia var. crispum, but oblong-obovate in C. intybus var. foliosum and C. endivia subsp. pumilum. The color ranges from creamy and shiny to black: C. intybus var. intybus is creamy, C. intybus var. foliosum and C. endivia var. endivia range from creamy shiny to dark brown and creamy, C. endivia var. crispum ranges from pale, creamy, and shiny to creamy with a black point, and C. endivia subsp. pumilum is creamy shiny with a few dark brown spots. The surface pattern of C. intybus var. intybus and C. intybus var. foliosum is sulcate papillate, that of C. endivia var. endivia is weak sulcate papillate, that of C. endivia var. crispum is ruminate sulcate, and that of C. endivia subsp. pumilum is weak ruminate-sulcate papillate. The anticinal wall is raised in C. intybus var. intybus and C. intybus var. foliosum, and slightly raised in C. endivia var. endivia, C. endivia var. crispum, and C. endivia subsp. pumilum. Periclinal walls are concave in C. intybus var. intybus and C. intybus var. foliosum, but only slightly concave in C. endivia var. endivia, C. endivia var. crispum, and C. endivia subsp. pumilum. Pappus bristles may be scabrous scales in C. intybus var. intybus and C. intybus var. foliosum and paleaceous scales to form a crown in C. endivia var. endivia, C. endivia var. crispum, and C. endivia subsp. pumilum. Pappus length is short in C. intybus var. intybus, C. intybus var. foliosum, and C. endivia subsp. pumilum, but long in C. endivia var. endivia and C. endivia var. crispum.

2.1.3. Epidermal Characteristics

In this study, five taxa of Cichcorium were investigated for their epidermal characters and trichomes, in order to determine the essential characters for identification and discrimination between the studied taxa. The different micro-morphological characters are presented in Table 2 and Figure 4, Figure 5 and Figure 6. The epidermal cell wall is straight in two taxa and sinuous in three taxa. Stomata leveling are recorded in three types: superficial, in C. intybus var. foliosum and C. endivia subsp. pumilum, semi-depressed, in C. endivia var. endivia and C. endivia var. crispum, and depressed, in C. intybus var. intybus (Figure 4).
The stomata can be categorized into five types, i.e., anisocytic stomata, in C. intybus var. intybus, C. endivia var. endivia, and C. endivia var. crispum, anomocytic stomata, present in all studied taxa, tetracytic stomata, in C. intybus var. intybus, C. endivia var. crispum, and C. endivia subsp. pumilum, stephanocytic stomata, in C. intybus var. intybus, C. intybus var. foliosum, C. endivia var. crispum, and C. endivia subsp. Pumilum, and associated stomata with middle lamella, in C. endivia var. endivia and C. endivia subsp. pumilum (Table 2 and Figure 5). Minimal intra-individual variability among stomata was noticed.

2.1.4. Trichomes

The following trichomes have been found on the leaves of the studied species:
  • Non-glandular
    • Papillae (Figure 6A): C. intybus var. intybus and C. endivia var. endivia.
    • Multicellular hairs with heterogeneous cells (Figure 6B): C. intybus var. foliosum.
    • Multicellular hairs with homogeneous cells (Figure 6C): C. endivia subsp. pumilum.
    • Shaggy hair (Figure 6D): C. intybus var. intybus and C. endivia var. endivia and C. endivia subsp. Pumilum.
  • Glandular
    • Multicellular uniseriate stalk and unicellular head with homogeneous cells (Figure 6E): C. endivia var. crispum.
    • Multicellular uniseriate stalk and unicellular head with heterogeneous cells (Figure 6F): C. intybus var. intybus, C. endivia var. crispum, and C. endivia subsp. pumilum.
    • Multicellular uniseriate stalk and bicellular head with homogeneous cells (Figure 6G): C. endivia var. endivia.
    • Multicellular uniseriate stalk and bicellular head with homogeneous cells (Figure 6H): C. intybus var. foliosum.

2.1.5. Morphological Identification

The data recorded in Table 1 and Table 2 were applied to create the following bracketed key for the five taxa of Cichorium, which can help confirm their identity.
1.
The leaf shape is spathulate, the anticlinal wall shape is straight, the anticlinal walls are raised, the periclinal walls are concave, and the pappus bristles are scabrous scales.
2
     The leaf shape is obovate or oblancelate, the anticlinal wall shape is straight, the anti-clinal walls are slightly raised, the periclinal walls are slightly concave, the pappus bristles are paleaceous scales to form a crown.
3
2.
The leaf margin is dentate, the shape of the cypsela is oblong, the stomata leveling is depressed, papillae are present, shaggy hair is present, there is a multicellular uniseri-ate stalk, and a unicellular head and heterogeneous cells are present.
C. intybus var. intybus
     The leaf margin is fine dentate, the shape of the cypsela is oblong obovate, the stomata leveling is superficial, papillae are absent, shaggy hair is absent, there is a multicellular uniseriate stalk, and a unicellular head and heterogeneous cells are ab-sent.
C. intybus var. foliosum
3.
The leaf shape is obovate, the leaf type is pinnately lobed, the midrib color is green, the radical leaf is absent, the epidermal cell wall is sinuous, there is a multicellular uniseri-ate stalk, and a unicellular head with homogeneous cells are pre-sent.
C. endivia var. crispum
     The leaf shape is spathulate or oblancelate, leaf type is simple, midrib color is white, radical leaf is present, epidermal cell wall is straight, with multicellular uniseriate stalk, and unicellular head with homogeneous cells absent.
4
4.
The leaf shape is spathulate, the petiole is absent, the shape of the cypsela is oblong, the surface pattern is weak sulcate papillate, the stomata level is semi-depressed, the epi-dermal sculpture is reticulate, and papillae are present.
C. endivia var. endivia
     The leaf shape is oblancelate, the petiole is present, the shape of the cypsela is oblong obovate, the surface pattern is weak ruminate sulcate papillate, the stomata level is superficial, the epidermal sculpture is striate, and papillae are absent.
C. endivia subsp. pumilum

2.2. Genetic Characterization and Polymorphism

The three studied PCR-based markers, RAPD, ISSR, and SCoT, demonstrated high and significant polymorphism and determined the taxon relationship (Figure 7). Table 3 presents total, monomorphic, polymorphic, and unique bands, along with the percent of polymorphism calculated. The thirty primers revealed a total of 186 bands with an average of 6 bands per primer. The polymorphism summed up an average of 58%. A wide range has revealed polymorphism among three markers, as the following of 46% for ISSR, 62% for RAPD, 66% for SCoT-PCR. Primers OPA18 and SCoT-04 generated the highest polymorphism of 100%, while HB-12, SCoT-13, and SCoT-14 produced 25%, 16.7%, and 0%, respectively. Unique bands summed up 17 amplicons of which 5 bands are by RAPD, 7 bands by ISSR, and 5 bands by SCoT marker. The marker UBC807 recorded the highest number of unique bands (three bands). This variability can be used to differentiate the studied taxa.

2.3. Morphological and Genetical Relationship and Correlation among Cichorium Taxa

The morphological characters were analyzed numerically using the clustering method for identification and differentiation between them, a dendrogram using the UPGMA cluster analysis, is presented in Figure 8. The cluster analysis showed that species were grouped into two major clusters. Cluster I consisted of two taxa Cichorium intybus var. intybus and Cichorium intybus var. foliosum. Cluster II comprised three taxa Cichorium endivia subsp. pumilum, Cichorium endivia var. crispum, and Cichorium endivia var. endivia.
Genetic similarity was built as a dendrogram following Nei and Li coefficient using the UPGMA cluster analysis (Figure 9). The taxa are divided into two main groups, except the ISSR markers, which reveal a different result among taxa. The C. endivia var. crispum and C. endivia subsp. pumilum fell into the group, while C. intybus var. intybus and C. intybus var. foliosum fell into subgroup. The ISSR investigation showed similarity between C. intybus var. foliosum and C. endivia var. endivia, categorizing them into a single subgroup.
The dataset was investigated using clustering analysis to identify and differentiate the taxa. The cluster analysis (Figure 10) showed that species were categorized into two major clusters, and Cluster II was further split into two groups. The first one consisted of two taxa—C. intybus var. intybus and C. intybus var. foliosum. Cluster II comprised three taxa and was further divided into two groups: Group 1 contained one taxon C. endivia var. endivia, while Group 2 had two taxa—C. endivia subsp. pumilum and C. endivia var. crispum.
Notably, the derived results are linked to those presented by morphological attributes. It seems likely that there is a significant correlation between C. endivia subsp. pumilum and C. endivia var. crispum and between C. intybus var. intybus and C. intybus var. foliosum. This may be due to the structure of taxon’s genotype or the effect of evolution naturally.
The correlation matrices possessed a broad sense of similarity (Table 4). The lowest similarity was between the taxon 1 (C. intybus var. intybus) and 4 (C. endivia var. crispum) (48% for SCoT, 55% for RAPD, and 57% for all markers, respectively) and between taxon 1 (C. intybus var. intybus) and 5 (67%) for the ISSR. The highest similarity was between the Object 1 (C. intybus var. intybus) and 2 (C. intybus var. foliosum) (88%) for RAPD, the taxon 2 (C. intybus var. foliosum) and 3 (C. endivia var. endivia) (86%) for ISSR, the objects 1 (C. intybus var. intybus) and 2 (C. intybus var. foliosum) (77%) for the combination, and the Object 4 (C. endivia var. crispum) and 5 (C. endivia subsp. pumilum) (73%) for SCoT.

2.4. Molecular Distance and Variance Decomposition

The distance to centroids (Table 5) and the variance decomposition (Table 6) of taxa’s classes accounted more in the classification. All taxa were grouped into three classes, as in Figure 8. All markers revealed that C. intybus var. intybus and C. intybus var. foliosum dropped into class (I), C. endivia var. endivia categorized into class (II) only, and the C. endivia var crispum and C. endivia subsp. pumilum formed in class (III); except that the ISSR results showed a different pattern. The ISSR showed that the first class (class I) has C. intybus var. intybus only, the second (class II) has C. intybus var. foliosum and C. endivia var. endivia, and the third class (class II) includes the rest. The variance within the first class was 17.5, and the distance to centroids was 2.96 between C. intybus var. intybus and C. intybus var. foliosum, while the third class recorded a variance of 21.00, and the distance to the centroids was 3.24 between C. endivia var crispum and C. endivia subsp. pumilum. The second class, between C. intybus var. foliosum and C. endivia var. endivia, coming from ISSR showed an average variance of 3.50 and a distance to the centroids of 1.32, whereas the third class recorded an average variance of 5.50 and a distance of 1.66.
The variance decomposition within and between classes for the optimal classification through three markers, is given in Table 5, the variance averaged 69% within the class, and 31% between classes for the combined markers. Markers showed that the variance within class recorded 60%, 63%, and 66% for RAPD, ISSR, and SCoT, respectively; whereas the variance between classes was 34.43%, 36.62%, and 40.34% for SCoT, ISSR, and RAPD, respectively.

2.5. Detrended Canonical Correspondence Analysis (DCCA)

The DCCA triplot presented in Figure 11 shows the distribution of the studied taxa and their relationships to morphological and molecular characters. Cichorium intybus var. intybus and Cichorium intybus var. foliosum were characterized by a short pappus length and stomata associated with an absence of middle lamella. These taxa were also differentiated with SCoT bands (4, 5, 13, 19, 21, 24, 42, and 71), ISSR bands (15, 16, 23, 24, 44, and 45), and RAPD bands (9, 13, 14, and 31) (Figure 11). Cichorium endivia var. endivia is distinguished by the absence of stephanocytic stomata and reticulate stomatal sculpture. This was also separated by SCoT (14) and RAPD (3, 49, and 55) bands. Cichorium endivia var. crispum is characterized by a pinnately lobed leaf type, an obtuse leaf apex, a green-colored midrib, absence of radical leaves, a ruminate sulcate surface pattern of cypsela, slightly raised anticlinal walls, and slightly concave periclinal walls. This was also differentiated by SCoT (20, 22, 26, 33, 44, 45, 46, 48, 49, 52, and 53), and RAPD (33, 42, 44, 45, 52, and 53) bands. Cichorium endivia subsp. pumilum was distinguished by SCoT (61 and 67), ISSR (30 and 36), and RAPD (16 and 54) bands.

3. Discussion

The morphological characteristics studied in this research, such as cypsela and pappus, using scanning electron micrographs, have already provided valuable information for specific genera [41,42]. The five taxa of Cichorium showed morphological differences. Identification and classification between taxa depend mostly on morphological characteristics. The studied taxa have a wide range of variations in characteristics associated with leaves (shape, type, texture, margin, and apex), cypselae (shape, color, and surface pattern), and trichomes (glands). Cichorium intybus is characterized by a spathulate leaf shape, a cypsela sulcate papillate surface pattern, a raised anticlinal wall, a concave periclinal wall, and a pappus type with scabrous scales. Cichorium endivia is characterized by having a leaf shape, simple or pinnately lobed, a slightly raised anticlinal wall, a slightly concave periclinal wall, and a pappus type with paleaceous scales to form a crown. The examined taxa demonstrated variations in their morphological features, such as leaf morphology, cypsela, and trichome characteristics. The five taxa had stomata on both surfaces, particularly the abaxial epidermis. Although they are very similar due to their morphological characteristics, C. intybus and C. endivia have always been categorized into two different species, morphologically described by Kiers et al. [43]. Kiers et al. [7] described C. intybus and C. endivia, the two cultivated and most known species, using an integration of morphological features with molecular approaches. Our results are in agreement with the view of Kiers et al. [7,43] and Raulier et al. [12].
Genetic identification of Cichorium using PCR-based molecular markers (RAPD, ISSR, and SCoT) enabled the detection of polymorphism to reveal the relationships between the studied taxa. Genetic analysis is crucial for managing the entire classification and identification, as well as genetic improvement [44]. The efficiency of a marker for discriminating species depends mainly upon the resultant polymorphism [22,24,45]. Markers of ISSR and SCoT have the potential to reveal polymorphism and offer a higher capacity for the determination of intra- and inter-genomic variations than other arbitrary primers such as RAPDs [21,26,46]. The difference in resolution resulting from RAPDs and ISSRs can be explained by the fact that different positions of the genome are targeted by the two-marker techniques [21]. Therefore, the ability to reveal genetic variability among and within species is directly related to the detected percentage of polymorphism using each marker than the technique employed. Similar conclusions were obtained by Mahdy [26] on lettuce and Jew’s mallow and Gupta et al. [46] on Jatropha. Kiers et al. [7] studied endive and chicory cultivars using diagnostic AFLP markers in Cichorium species. Our results are in general agreement with several previous studies [28,29,30,31].
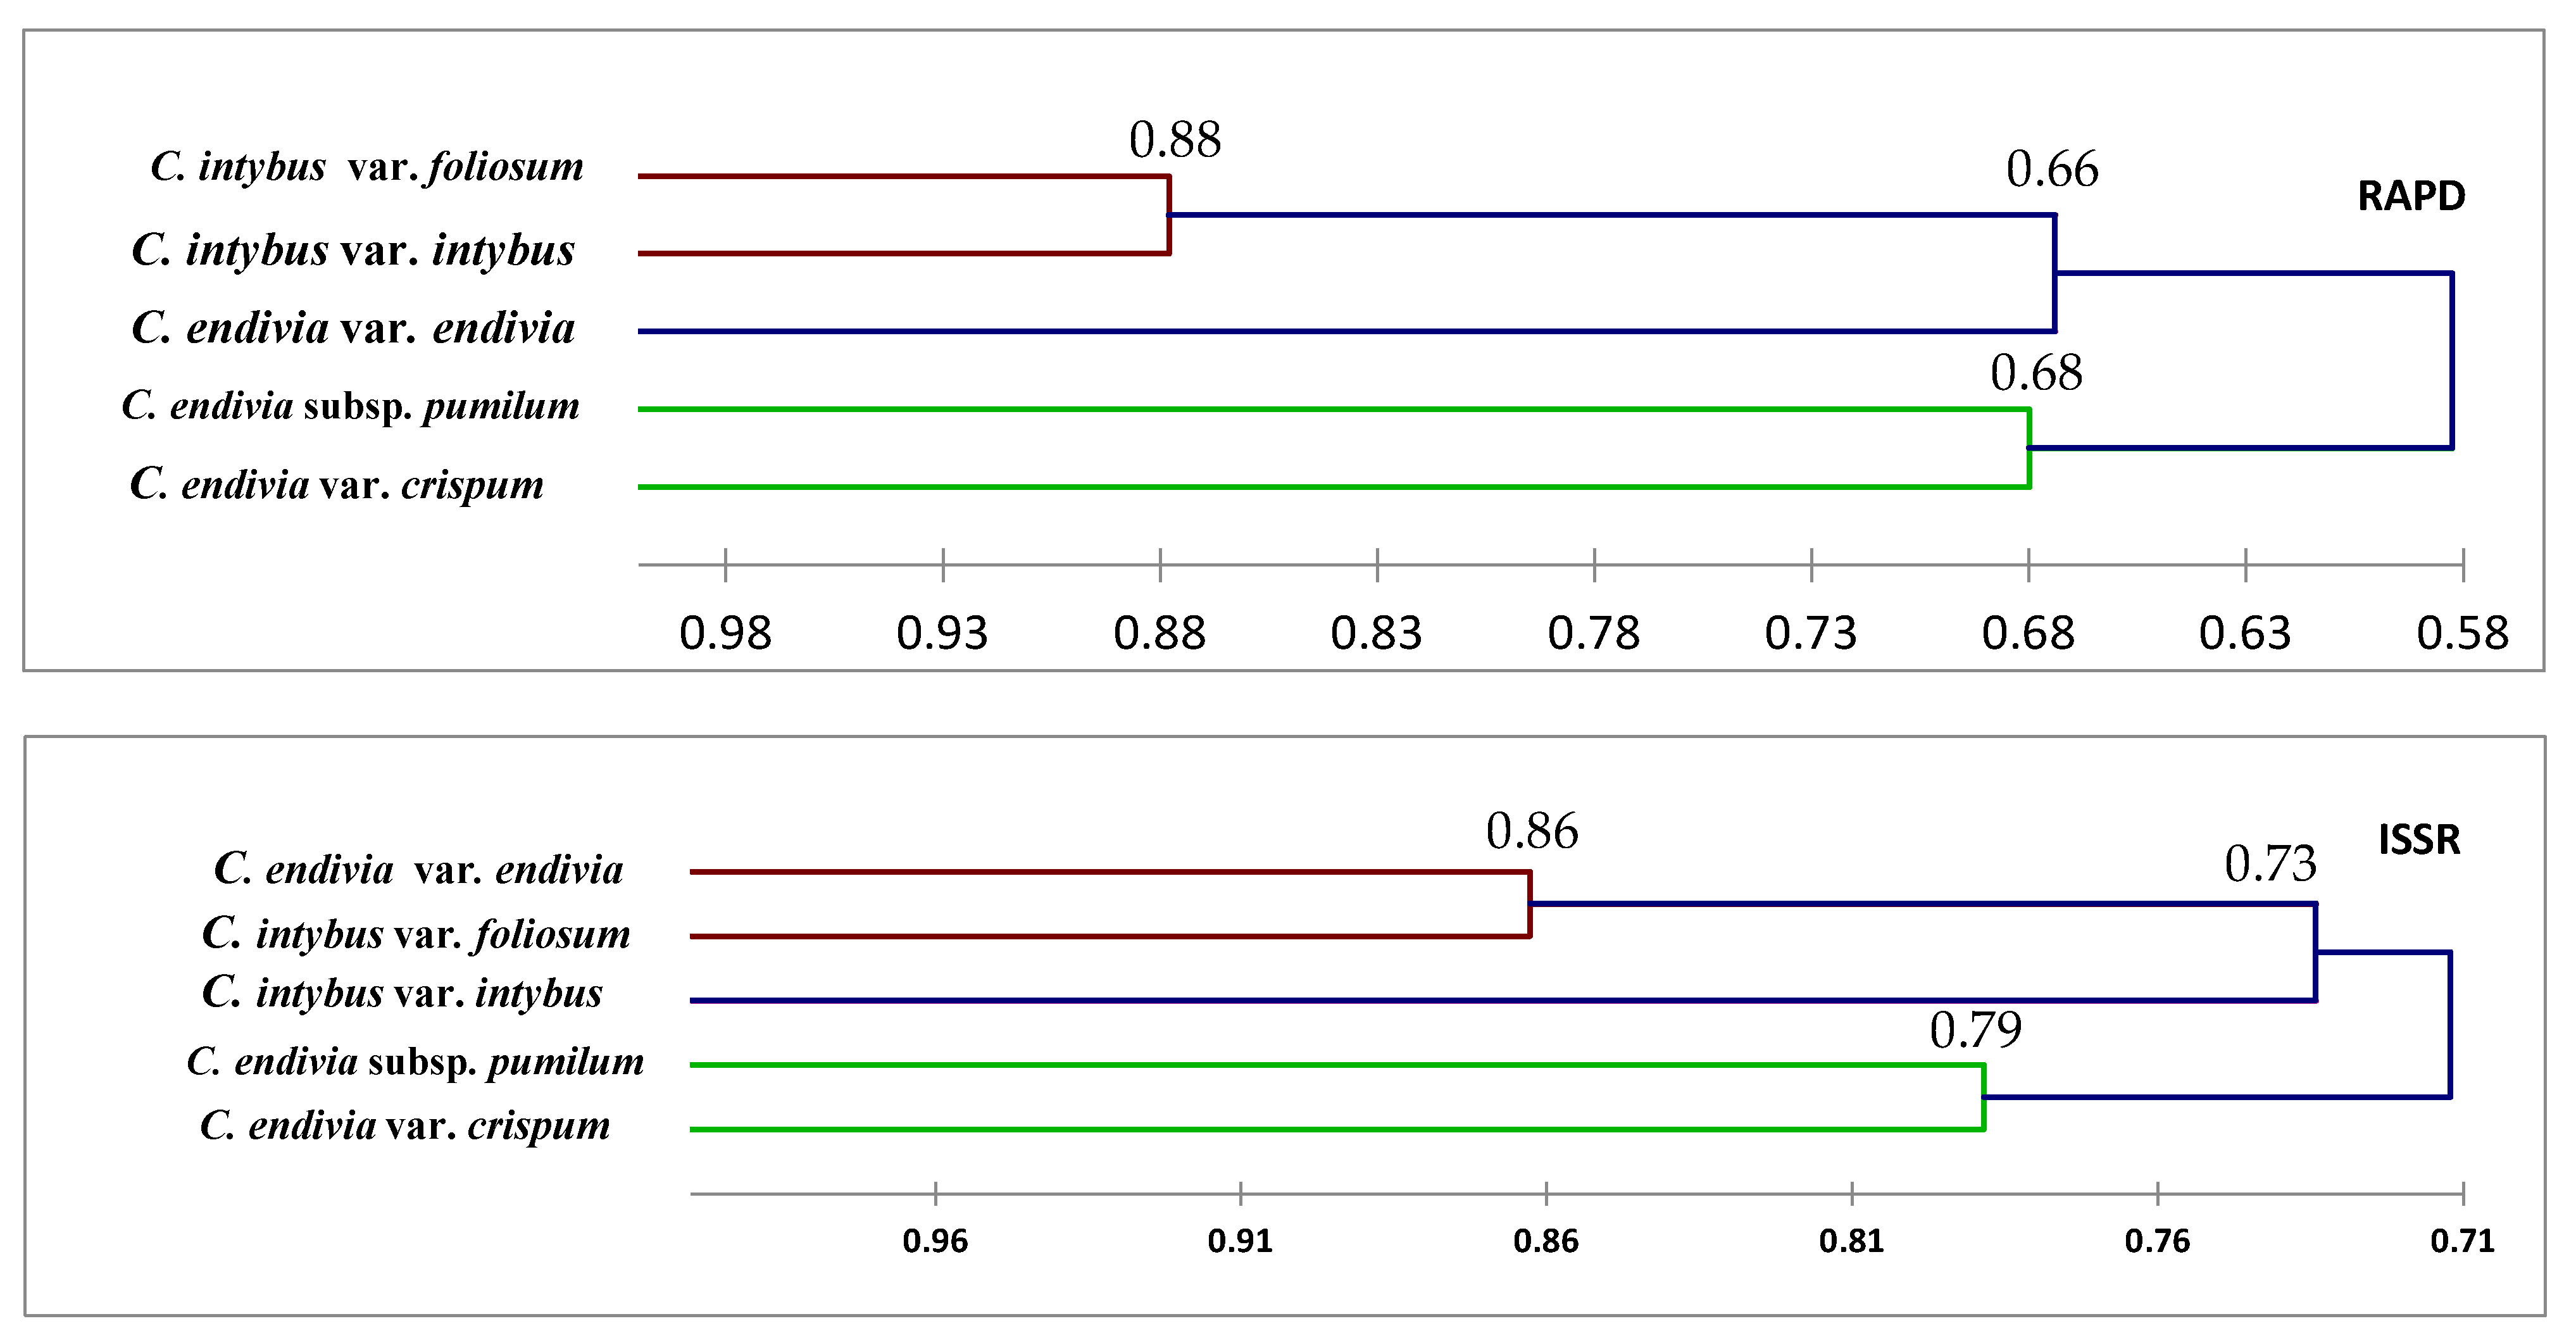
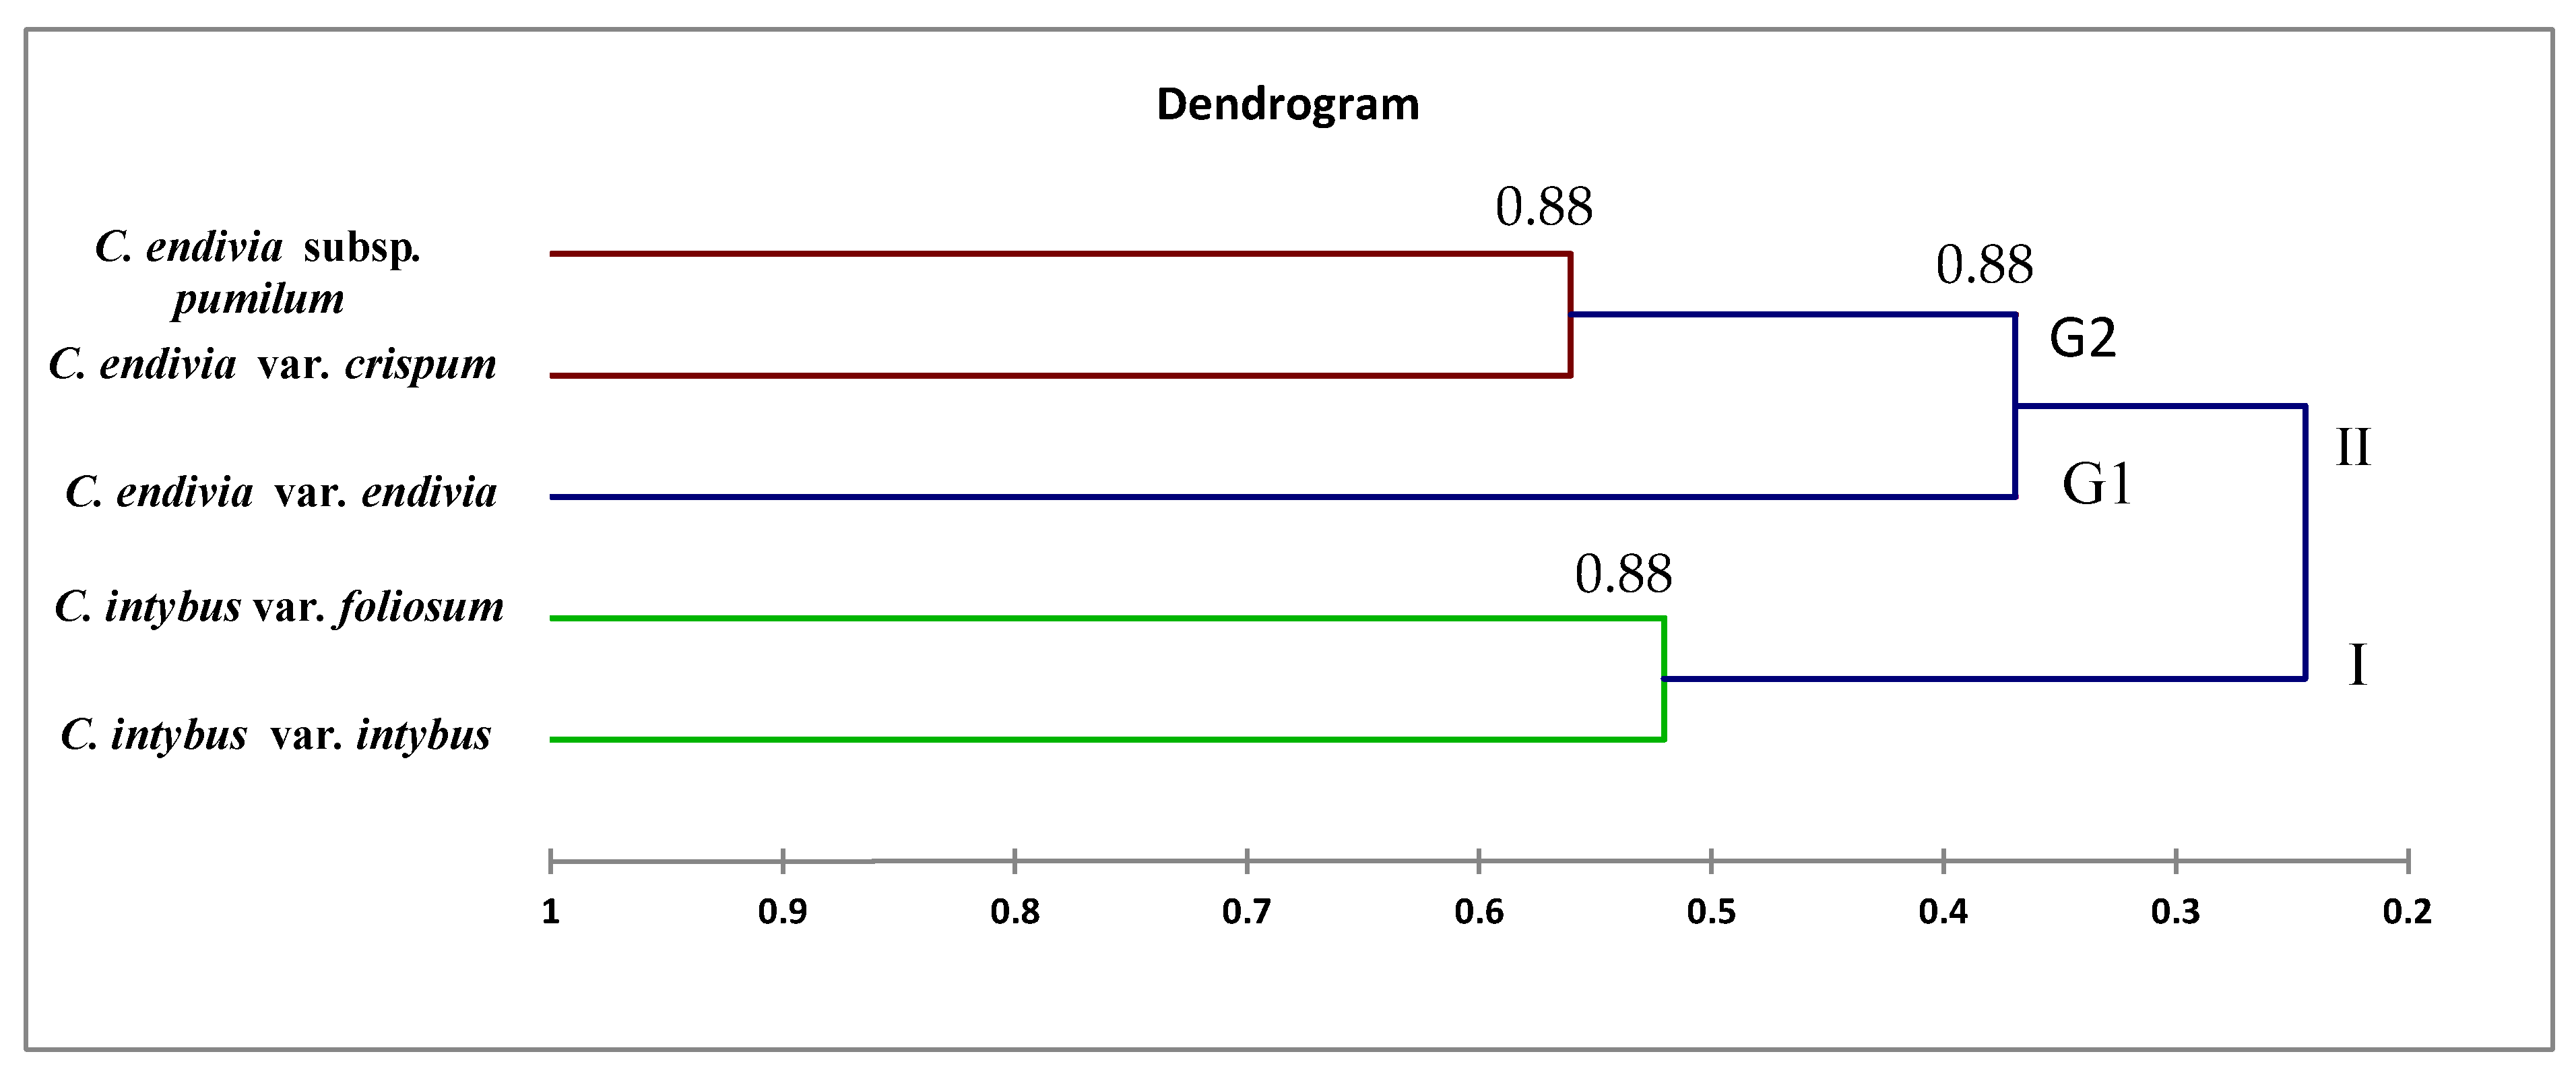
Dendrograms, as illustrated in Figure 8, Figure 9 and Figure 10, have shown a correspondence between molecular markers and morphological attributes. The differences among the dendrograms generated by markers could be partially explained by the different number of PCR products analyzed, as presented in Table 6. This highlights the importance of higher genome coverage and loci number in estimating the genetic relationships among the tested taxa. Loarce et al. [47] obtained similar findings in barley. This could also be explained by the low reproducibility of RAPD markers [48]. The differences in the clustering pattern of genotypes using RAPD and ISSR markers may be attributed to the differences in marker reproducibility and genome coverage among the two tested markers; this highlights the importance of loci number and their genome coverage in obtaining reliable assessments of genetic correlations among taxa [21,22,47]; this may be helpful in genetic diversity, classification, taxonomy, systematics, and evolutionary biology [1,49,50]. Our results showed that the genetic identification and classification depend mainly on the efficiency of a marker [26,51].
Markers had categorized by variance decomposition C. intybus var. intybus and C. intybus var. foliosum into a group and C. endivia var. crispum and C. endivia subsp. pumilum into a group except those revealed by ISSR showing C. intybus var. foliosum and C. endivia var. endivia into a group and C. endivia subsp. pumilum and C. endivia var. crispum into a group, as shown in Table 4. That may be due to the variance in the resolution of ISSRs and targeting different loci of the genome by these techniques [21,26,51]. Earlier microsatellite markers could not differentiate between the species [52]. Additionally, it may be due to the makeup of taxon’s genotype or the effect of evolution naturally.
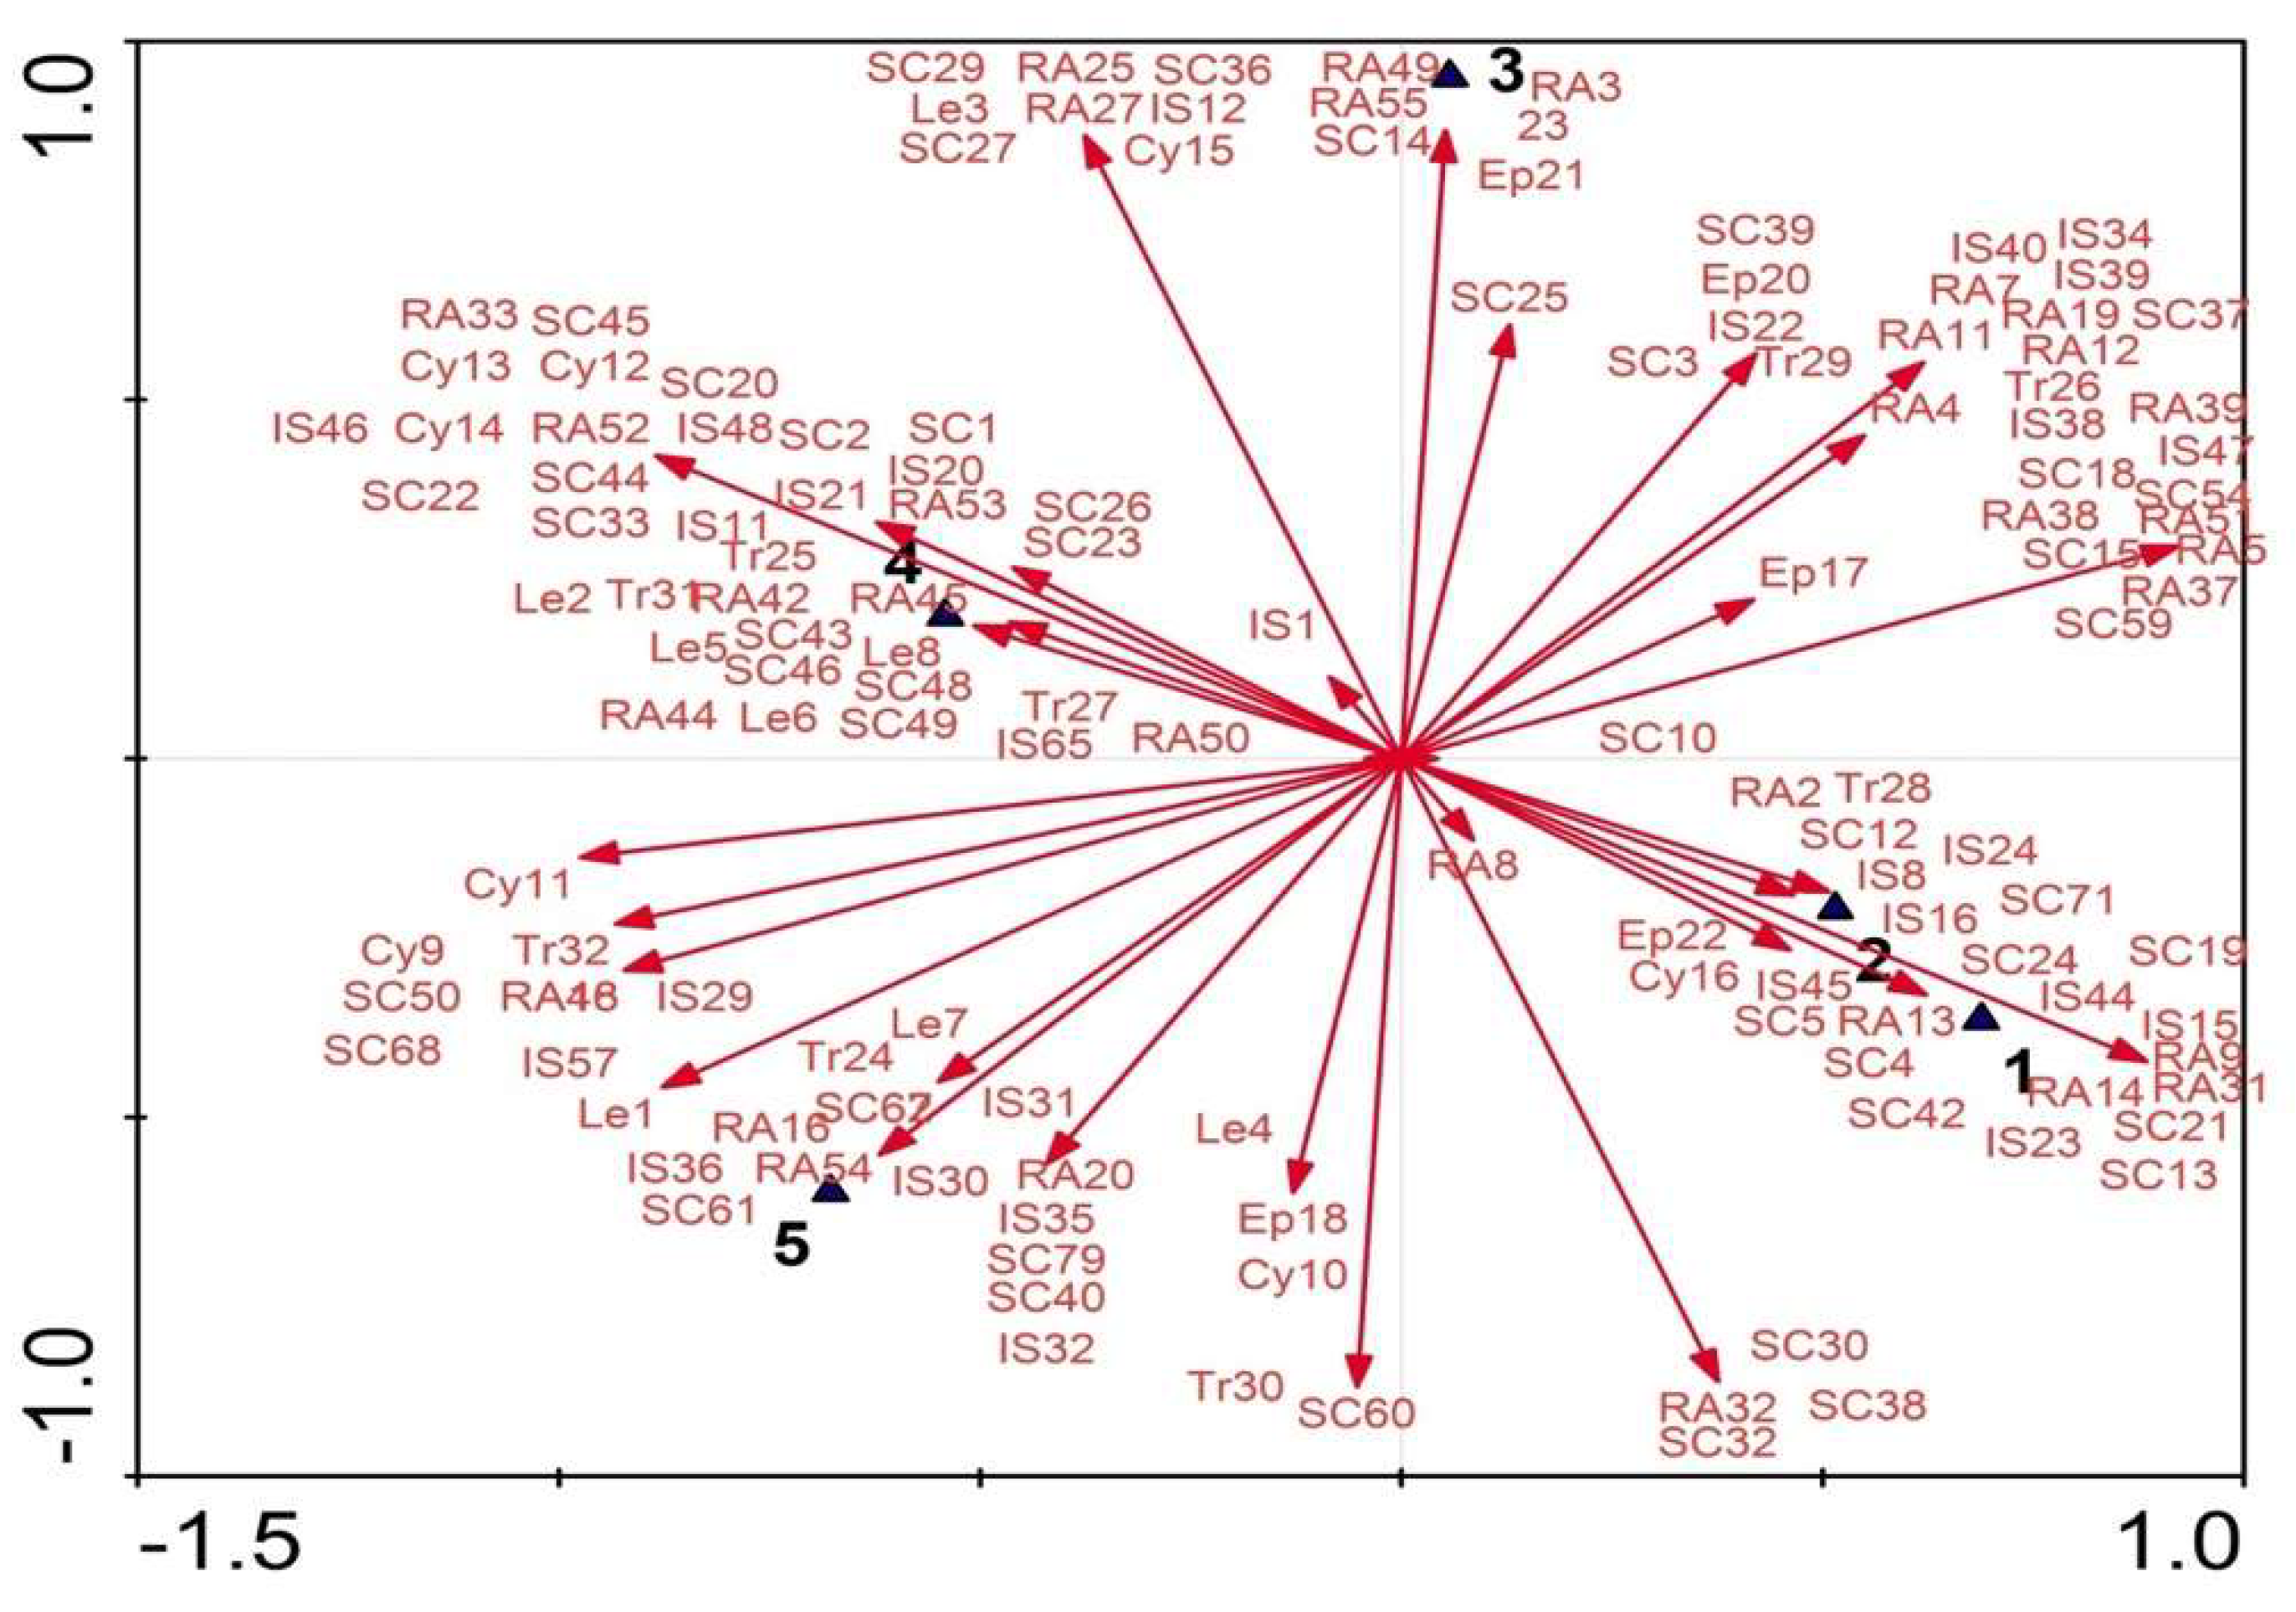
The DCCA analysis of morphological and molecular characteristics revealed that Cichorium intybus var. intybus is related to C. intybus var. foliosum, while C. endivia var. endivia is related to C. endivia var. crispum and C. endivia subsp. pumilum. These results are consistent with those of Kiers [11] and Kiers et al. [43]. In earlier publications, it has been argued that the Egyptian chicory was classified into C. intybus [38,39,40]. The integrated approaches supports a better authentication and verification of the species and taxa. According to the results of this research we argue that the Egyptian chicory is classified into C. endivia subsp. pumilum.

4. Materials and Methods

4.1. Plant Materials

Cypselae of Cichorium species were obtained from the collection maintained by Vegetable Production Research Department, Agricultural Research Center (ARC), Giza, Egypt. Five taxa of the genus Cichorium were used in this study. Seeds and herbarium specimens of Cichorium taxa, Cichorium intybus var. intybus, C. intybus var. foliosum, C. endivia var. endivia, C. endivia var. crispum, and C. endivia subsp. pumilum were identified under the authority of the Herbarium, Botany Dept., National Gene Bank (NGB), Agricultural Research Center (ARC), Giza, Egypt.

4.2. Germination

Light intensities at mid-canopy were kept at approximately 400 µmols m2s−1 in the growth chambers for germination. A photoperiod was adjusted at 16 h of light and 8 h of darkness using fluorescent and incandescent lights. A daytime temperature of 23 °C and a nighttime temperature of 18 °C were maintained using chart recorders. The relative humidity was maintained at approximately 50%. First, the seed surface was sterilized using a solution of 5% sodium hypochlorite for 10 min and rinsed several times with sterile distilled water. Next, 10 seeds of each taxon were replicated in fours on a blotter, to which 10 mL of the test solution was added. Seeds germinated in the growing media containing peat moss, sandy soil, and perlite (1:1:1) under growth chamber conditions. Outer leaves at the basal nodes were taken for macromorphological and micromorphological analysis.

4.3. Microscopy

4.3.1. Scanning Electron Microscopy (SEM)

Cypselae and leaves of each Cichorium taxon were separately cut into small sections of 4–8 mm long. Glutaraldehyde solution (6%, pH 7.3) was used to fix the sections for 12 h [53]. These were then rinsed with a 0.05 M C2H6AsNaO2 (sodium cacodylate) buffer (pH 7.5) and rinsed with distilled water. This was then dehydrated with gradual ethanol concentrations (10–100%) for 20 min for each concentration. A Hitachi HCP-2 critical point dryer was used to dry the samples, which were then mounted onto aluminum stubs with carbon-coated sputtering (Elko IB-3 Ion Coater). JEOL (JSM-6390 LV) SEM, Model JEOLJSM- 5500 LV was used to examine the samples. As in SEM, both fixation and dehydration procedures were conducted using energy-dispersive X-ray spectroscopy (EDX). NORAN System SIX software (V.1.8) was used for photomicrographs digitally taken at the Electron Microscopy Unit at the National Research Centre, Dokki, Egypt. The terminology for the cypsela, abaxial epidermis, and stomata used in this study follows Barthlott [54], Garg and Sharma [55], Mukherjee and Nordenstam [56], and Dilcher [57]. In addition, all morphological characters regarding the leaf, cypsela, and trichomes were documented to create classical keys.

4.3.2. Light Microscopy

A piece of the middle part of the leaf (1 cm2) from each plant was taken and dehydrated in a series of ethanol concentrations (50–100%). The specimens were then embedded in paraffin wax (m.p. 58–61 °C) by xylol (solvent), sectioned at 15 μm on a Jung PM 2045 rotary microtome, and mounted on glass slides with egg albumen (adhesive agent). The wax was dissolved in xylol, and the slides were stained using light green and safranin. Using Canada balsam (mounting agent), permanent slides were prepared [58,59]. A digital camera was used to capture the photomicrographs.

4.4. Morphology

Twenty eight traits are presented including thirteen attributes of leaves and fifteen attributes of cypsela; the traits were estimated from approximately ten healthy plants from each taxon and are presented according to the relevant terminology [60].

4.5. DNA Extraction

The gDNA extraction was performed by the manufacturer’s instructions of Zymo extraction kit (Zymo Research, Inc., Irvine, CA, USA). The DNA purity and quantity were checked via nanodrop and then stored for PCR analysis. The integrity of gDNA was verified by agarose gel electrophoresis in a 1% agarose/1 × TAE gel containing 1 × Sybr® Safe DNA gel stain (Life Technology, Carlsbad, CA, USA). The isolated genomic DNA samples were diluted to 10 ng/μL. Then, good-quality gDNA samples were used for PCR amplification.

4.6. PCR-Based Markers

Three PCR-based markers were used for providing more information on Cichorium’s genetic relatedness which are random amplified polymorphic DNA (RAPD), Inter Simple Sequence Repeats (ISSR), and start codon target (SCoT), as given in Table 3. RAPD-PCR amplification was carried out with ten synthesized random 10-mer arbitrary primers (Operon Biotechnologies, Inc., Ebersberg, Germany). The procedure was done as detailed in Williams et al. [20] and Williams and St Clair [30] with minor modifications. The amplification by ISSR to detect polymorphisms among accession for both species was carried out as described by Yang and Park [61] with slight modifications. The procedure of SCoT was designed by describing of Collard and Mackill [62], which synthesized by Operon Biotechnologies, Inc., GmbH, (Cologne, Germany).
The PCR reactions were performed in a 25 μL reaction mixture that contained 25 ng of template DNA, 0.2 μM dNTPs, 1 µM of each tested primer, 1.5 mM MgCl2, 1× PCR buffer, and 1 U of Go-Taq Flexi polymerase. In the initial denaturation cycle, the PCR program was adjusted at 94 °C for 5 min, then followed by 35 cycles. Each cycle involved 94 °C for 1 min, varying annealing temperature for each primer (Table 3) for 1 min, then 72 °C for 90 s, and 72 °C for 7 min in the final step for extension. The PCR amplification reaction products (Amplicons) were resolved in 1.0–1.5% agarose gel that contained ethidium bromide (0.5 µg/mL) in 1× TBE as a running buffer. A 100 bp plus DNA Ladder was used as molecular size standards.
PCR products were run on agarose gel in 1% agarose × TAE gel containing 1 × Sybr® Safe DNA gel stain (Life Technology, Carlsbad, CA, USA) at 100 V for 30 min. Gels were visualized and photographed with a Gel DocTM XR+ System with Image LabTM Software (Bio-Rad®). Amplicon banding profiles were scored as present (1) or absent (0) in a binary matrix based on standard markers using Alpha Ease FCTM (version 4.0.1) software.

4.7. Statistical Analysis

Similarity for a binary matrix was estimated according to the Jaccard coefficient [63]. The dendrogram generated the Un-weighted Pair Group Method algorithms with Arithmetic (UPGMA) averages according to Nei and Li [64] to determine the genetic relationship among taxa. In addition, a Detrended Canonical Correspondence Analysis (DCCA) was performed using CANOCO V. 4.5 and CanoDraw V. 4.1. The dataset was entered into SPSS (version 14.0), as well as the add-in packages of StatistiXL (Kovach Computing Service 2013, version 1.8: http://www.xlstat.com (last accessed on 7 February 2022) and GenAlEx Genetic Analysis (version 6.5) in Microsoft Excel [65,66].

5. Conclusions

The integration of various identification methods, including macro- and micro-morphological and molecular characterization, plays a chief role in the identification and authentication of plant genera, species, and taxa. Although measuring the variability of morphological attributes does not provide extensive information, it can still be helpful for breeding and improvement programs. This is especially important in changing climates, including the Mediterranean region. The existence of these distinct taxa and their phylogenetic relationships were assessed and confirmed in this study using the phenological, and molecular markers, and phylogenetic methodologies. The approaches used in this study proved that these tools are helpful for phylogenetic studies at the species level or higher taxonomic ranks in the genus Cichorium.
We report that the leaf shape and type, the cypsela anticlinal and periclinal walls, pappus bristles, the epidermal cell wall, and the stomatal type were the most critical characteristics in the construction of the dichotomous indented key for Cichorium taxa. PCR-based identification confirmed these results revealed through the phylogenic tree. We observe that the integration of phenological and genetic characterization is helpful in the authentication of Cichorium taxa. Further research could focus on intra-species variability, diversity, and genetic differences among individuals of the Cichorium taxa. Despite the success of the molecular marker approach, we recommend the use of supplemental techniques such as DNA barcoding for improved classification and identification, along with more core and base collections of the studied plant materials. Our observations suggest that these taxa have the potential to provide rich genetic resources for further research in genetic biodiversity, conservation, and plant breeding programs. The chicory genetic assembly among different countries in the Mediterranean region visibly diverges with a firm amount of gene flow. The PCR-based markers could be utilized for analyzing genetic relationships and taxonomies of Cichorium taxa. Finally, it could be concluded that the Egyptian chicory belongs to the C. endivia subsp. pumilum.

Author Contributions

Conceptualization, A.M.E.-T. and T.O.R.; data curation, H.A.E., H.S.A.E.-R., E.M., E.A.E. and I.A.A.; formal analysis, H.A.E., E.M. and O.G.R.; funding acquisition, K.S.A. and I.A.A.; investigation, A.M.E.-T., E.M.B.M. and O.G.R.; methodology, A.M.E.-T., E.M.B.M., R.M.A. and O.G.R.; project administration, R.M.A., E.M.B.M., E.A.E. and I.A.A.; resources, H.A.E., H.S.A.E.-R., E.M., K.S.A., R.M.A. and E.A.E.; software, H.A.E. and R.M.A.; supervision, T.O.R. and M.F.M.I.; validation, K.S.A., E.A.E., T.O.R. and M.F.M.I.; visualization, H.S.A.E.-R. and E.M.B.M.; writing—original draft, A.M.E.-T., H.S.A.E.-R., E.M., K.S.A., E.M.B.M., O.G.R., E.A.E., I.A.A., T.O.R. and M.F.M.I.; writing—review and editing, O.G.R., E.M.B.M., T.O.R. and M.F.M.I. All authors have read and agreed to the published version of the manuscript.

Funding

Partial support is provided to T.O.R and E.M. by the National Institute of Food and Agriculture, CSREES, U.S. Department of Agriculture, Massachusetts Agricultural Experiment Station (MAES), under Project MAS00045.

Data Availability Statement

Not applicable.

Acknowledgments

We sincerely thank Hattem EL-Shabrawy, Plant Biotechnology Dept., National Research Centre, Giza, Egypt, for his guidance and for providing access to lab resources. Also, our thanks are extended to Imam Mohammed Bin Saud Islamic University (IMSIU), Riyadh, Saudi Arabia, for supporting the publication of this research work.

Conflicts of Interest

The authors declare no conflict of interest.

References

  1. Bremer, K.; Anderberg, A.A. Asteraceae. In Cladistics and Classification, 1st ed.; Timber Press: Portland, OR, USA, 1994; p. 752. [Google Scholar]
  2. Mandel, J.R.; Dikow, R.B.; Siniscalchi, C.M.; Thapa, R.; Watson, L.E.; Funk, V.A. A fully resolved backbone phylogeny reveals numerous dispersals and explosive diversifications throughout the history of Asteraceae. Proc. Natl. Acad. Sci. USA 2019, 116, 14083–14088. [Google Scholar] [CrossRef] [PubMed] [Green Version]
  3. Tutin, T.G.; Heywood, V.H.; Burges, N.A.; Moore, D.A.; Valentine, D.H.; Walters, S.M.; Webb, D.A. Flora Europea 4; Cambridge University Press: Cambridge, UK, 1976. [Google Scholar]
  4. Pignatti, S. Flora d’Italia 3; Edagricole: Bologna, Italy, 1982. [Google Scholar]
  5. Boulos, L. Verbenaceae-Compositae. In Flora of Egypt. 3; Al-Hadara Publishing: Cairo, Egypt, 2002; p. 310. [Google Scholar]
  6. Bedarff, U. Die Gattung Cichorium (Compositae), ihre Merkmale und ihre Arten; Diplomarbeit: Gottingen, Deutschland, 1985. [Google Scholar]
  7. Kiers, A.M.; Mes, T.H.; Van Der Meijden, R.; Bachmann, K. A search for diagnostic AFLP markers in Cichorium species with emphasis on endive and chicory cultivar groups. Genome 2000, 43, 470–476. [Google Scholar] [CrossRef] [PubMed]
  8. Conti, F.; Abbate, G.; Alessandrini, A.; Blasi, C. An Annotated Checklist of the Italian Vascular Flora; Palombi Editori: Roma, Italy, 2005. [Google Scholar]
  9. Bartolucci, F.; Peruzzi, L.; Galasso, G.; Albano, A.; Alessandrini, A.; Ardenghi, N.M.G.; Astuti, G.; Bacchetta, G.; Ballelli, S.; Banfi, E.; et al. An updated checklist of the vascular flora native to Italy. Plant Biosyst. 2018, 152, 179–303. [Google Scholar] [CrossRef]
  10. Street, R.A.; Sidana, J.; Prinsloo, G. Cichorium intybus: Traditional Uses, Phytochemistry, Pharmacology, and Toxicology. Evid.-Based Complement. Alternat. Med. 2013, 2013, 1–13. [Google Scholar] [CrossRef] [PubMed] [Green Version]
  11. Kiers, A.M. Endive, chicory and their wild relatives, a systematic and phylogenetic study of Cichorium (Asteraceae). Gorteria Dutch Botanical Archives -Supplement. 2000, 5, 1–77. Available online: https://natuurtijdschriften.nl/pub/535758 (accessed on 25 April 2022).
  12. Raulier, P.; Maudoux, O.; Notté, C.; Draye, X.; Bertin, P. Exploration of genetic diversity within Cichorium endivia and Cichorium intybus with focus on the gene pool of industrial chicory. Genet. Resour. Crop. Evol. 2016, 63, 243–259. [Google Scholar] [CrossRef]
  13. Lucchin, M.; Varotto, S.; Barcaccia, G.; Parrini, P. Chicory and Endive. In Handbook of Plant Breeding, Vegetables I: Asteraceae, Brassicaceae, Chenopodicaceae; Springer: New York, NY, USA, 2008; pp. 1–46. [Google Scholar]
  14. Stallen, N.V.; Vandenbussche, B.; Londers, E.; Noten, V.; Proft, M.D. QTL analysis of production and taste characteristics of chicory (Cichorium intybus var. foliosum). Plant Breed. 2005, 124, 59–62. [Google Scholar] [CrossRef]
  15. Jana, B.; Mukherjee, S. Diversity of testal structure among some tribes of Compositae. J. Sci. 2014, 4, 327–338. [Google Scholar]
  16. Gonthier, L.; Blassiau, C.; Mörchen, M.; Cadalen, T.; Poiret, M.; Hendriks, T.; Quillet, M.C. High-density genetic maps for loci involved in nuclear male sterility (NMS1) and sporophytic self-incompatibility (S-locus) in chicory (Cichorium intybus L., Asteraceae). Theor. Appl. Genet. 2013, 126, 2103–2121. [Google Scholar] [CrossRef]
  17. Mahmood, T.; Siddiqua, A.; Rasheed, A.; Nazar, N. Evaluation of genetic diversity in different Pakistani wheat landraces. Pak. J. Bot. 2011, 43, 1233–1239. Available online: http://www.pakbs.org/pjbot/PDFs/43(2)/PJB43(2)1233.pdf (accessed on 25 April 2022).
  18. Nazar, N.; Mahmood, T. Morphological and molecular characterization of selected Artemisia species from Rawalakot, Azad Jammu and Kashmir. Acta Physiol. Plant. 2011, 33, 625–633. [Google Scholar] [CrossRef]
  19. Mady, E.A.; Helaly, A.A.; Abu El-Hamd, A.; Abdou, A.; Shanan, S.A.; Craker, L.E. Genetic diversity assessment of summer squash landraces using molecular markers. Mol. Biol. Rep. 2013, 40, 4269–4274. [Google Scholar] [CrossRef]
  20. Williams, J.G.K.; Kubelik, A.R.K.; Livak, T.; Rafalski, J.A.; Tingey, S.V. DNA polymorphisms amplified by arbitrary primers are useful as genetic markers. Nucl. Acids Res. 1990, 18, 6531–6539. [Google Scholar] [CrossRef] [PubMed]
  21. Mahdy, E.M.B. Genetical Studies on DNA Storage and Preservation on some Accessions of Cowpea Plant. Ph.D. Thesis, Al Azhar University, Cairo, Egypt, 2018. [Google Scholar]
  22. Mahdy, E.M.B.; El-Shaer, H.F.A.; Sayed, A.I.H.; El-Halwagi, A. Genetic diversity of local cowpea (Vigna spp. (L.) Walp.) accessions cultivated in some regions of Egypt. Jordan J. Biol. Sci. 2021, 14, 775–789. [Google Scholar] [CrossRef]
  23. Mady, E.; Ibrahim, S.D.; Randhir, R.; Abd El-Hakim, A.F.; Randhir, T.O. Genetic variation among pumpkin landraces based on seed qualities and molecular markers. Mol. Biol. Rep. 2022, 49, 3863–3873. [Google Scholar] [CrossRef]
  24. Jain, A.; Bhitia, S.; Banga, S.S.; Prakash, S.; Laxmikumaran, M. Potential use of RAPD technique to study the genetic diversity in Indian mustard (Brassica juncea) and its relationship to heterosis. Theor. Appl. Genet. 1994, 88, 116–122. [Google Scholar] [CrossRef]
  25. Hu, J.; Quiros, L.F. Identification of broccoli and cauliflower cultivars with RAPD markers. Plant Cell Rep. 1991, 10, 505–511. [Google Scholar] [CrossRef] [PubMed]
  26. Mahdy, E.M.B. Genetic studies on some vegetable crops (Corchorus olitorius L. and Lactuca sativa L.). Master’s Thesis, Zagazig University, Zagazig, Egypt, 2012. [Google Scholar]
  27. Williams, C.E.; St Clair, D.A. Phonetic relationship and levels of variability detected by RFLP and Random amplified DNA analysis of cultivated and wild accessions of Lycopersicon esculentum. Genome 1993, 36, 619–630. [Google Scholar] [CrossRef] [PubMed]
  28. Mackill, D.J. Classifying japonica rice cultivars with RAPD markers. Crop Sci. 1995, 35, 889–894. [Google Scholar] [CrossRef]
  29. Liang, X.Y.; Zhang, X.Q.; Bai, S.Q.; Huang, L.K.; Luo, X.M.; Ji, Y.; Jiang, L.F. Genetic diversity and relationship of chicory (Cichorium intybus L.) using sequence-related amplified polymorphism markers. Genet. Mol. Res. 2014, 13, 7736–7746. [Google Scholar] [CrossRef]
  30. Yang, T.-J.; Jang, S.-W.; Kim, W.-B. Genetic Relationships of Lactuca spp. Revealed by RAPD, Inter-SSR, AFLP, and PCR-RFLP Analyses. J. Crop Sci. Biotechnol. 2007, 10, 29–34. [Google Scholar]
  31. Van Stallen, N.; Noten, V.; Demeulemeester, M.; De Proft, M.P. Identification of Cichorium intybus L and their phenetic relationship revealed by RAPDs. Acta Hortic. 2001, 546, 521–525. [Google Scholar] [CrossRef]
  32. Cadalen, T.; Moerchen, M.; Blassiau, C.; Clabaut, A.; Scheer, I.; Hilbert, J.L.; Hendriks, T.; Quillet, M.C. Development of SSR markers and construction of a consensus genetic map for chicory (Cichorium intybus L.). Mol. Breed. 2010, 25, 699–722. [Google Scholar] [CrossRef]
  33. Bellamy, A.; Mathieu, C.; Vedel, F.; Bannerot, H. Cytoplasmic DNAs and nuclear rDNA restriction-fragment-length-polymorphisms in commercial Witloof chicories. Theor. Appl. Genet. 1995, 91, 505–509. [Google Scholar] [CrossRef] [PubMed]
  34. Barcaccia, G.; Pallottini, L.; Soattin, M.; Lazzarin, R.; Parrini, P.; Lucchin, M. Genomic DNA fingerprints as a tool for identifying cultivated types of radicchio (Cichorium intybus L.) from Veneto, Italy. Plant Breed. 2003, 122, 178–183. [Google Scholar] [CrossRef] [Green Version]
  35. Kiaer, L.P.; Felber, F.; Flavell, A.; Guadagnuolo, R.; Guiatti, D.; Hauser, T.P.; Olivieri, A.M.; Scotti, I.; Syed, N.; Vischi, M.; et al. Spontaneous gene flow and population structure in wild and cultivated chicory, Cichorium intybus L. Genet. Resour. Crop Evol. 2009, 56, 405–419. [Google Scholar] [CrossRef]
  36. Fitzpatrick, B.M.; Fordyce, J.A.; Niemiller, M.L.; Reynolds, R.G. What can DNA tell us about biological invasions? Biol. Invasions 2012, 14, 245–253. [Google Scholar] [CrossRef]
  37. Závada, T.; Malik, R.J.; Kesseli, R.V. Population structure in chicory (Cichorium intybus): A successful U.S. weed since the American revolutionary war. Ecol. Evol. 2017, 7, 4209–4219. [Google Scholar] [CrossRef] [Green Version]
  38. Helaly, A.A.; Abdullah, H.M. Phytochemical analysis and yield characterization of eight Cichorium intybus L. landraces. J. Hortic. Sci. Ornam. Plants 2017, 9, 39–51. [Google Scholar]
  39. Amer, A.M. Antimicrobial effects of Egyptian local chicory, Cichorium endivia subsp. pumilum. Int. J. Microbiol. 2018, 2018, 1–6. [Google Scholar] [CrossRef] [PubMed] [Green Version]
  40. El-Alfy, T.S.; El-Askary, H.I.; Abd El-Tawab, S.; Kamel, S.M. A pharmacognostical study of Cichorium intybus L. herb growing in Egypt. Bull. Fac. Pharm. Cairo Univ. 2009, 47, 77–99. [Google Scholar]
  41. Silva, T.D.; Marzinek, J.; Hattori, E.K.; Nakajima, J.N.; De-Paula, O.C. Comparative cypsela morphology in Disynaphiinae and implications for their systematics and evolution (Eupatorieae: Asteraceae). Bot. J. Linn. Soc. 2018, 186, 89–107. [Google Scholar] [CrossRef]
  42. Ozcan, M. Cypsela micromorphology and anatomy in Cirsium sect. Epitrachys (Asteraceae, Carduoideae) and its taxonomic implications. Nord. J. Bot. 2017, 35, 653–668. [Google Scholar] [CrossRef]
  43. Kiers, A.M.; Mes, T.H.M.; van der Meijden, R.; Bachmann, K. Morphologically defined Cichorium (Asteraceae) species reflect lineages based on chloroplast and nuclear (ITS) DNA data. Syst. Bot. 1999, 24, 645–659. [Google Scholar] [CrossRef]
  44. Basso, A.; Scariolo, F.; Negrisolo, E.; Lucchin, M.; Barcaccia, G. Molecular Relationships and Genetic Diversity Analysis of Venetian Radicchio (Leaf Chicory, Cichorium intybus subsp. intybus var. sylvestre, 2n = 2x = 18) Biotypes. Diversity 2022, 14, 175. [Google Scholar] [CrossRef]
  45. Tatikonda, L.; Wani, S.P.; Kannan, S.; Beerelli, N.; Sreedevi, T.K.; Hoisington, D.A.; Devi, P.; Varshney, R.K. AFLP-Based molecular characterization of an elite germplasm collection of Jatropha curcas L., a biofuel plant. Plant Sci. 2009, 176, 505–513. [Google Scholar] [CrossRef]
  46. Gupta, S.; Srivastava, M.; Mishra, G.P.; Naik, P.K.; Chauhan, R.S.; Tiwari, S.K.; Kumar, M.; Singh, R. Analogy of ISSR and RAPD markers for comparative analysis of genetic diversity among different Jatropha curcas genotypes. Afr. J. Biotechnol. 2008, 7, 4230–4243. Available online: https://www.ajol.info/index.php/ajb/article/view/59558 (accessed on 25 April 2022).
  47. Loarce, Y.; Gallego, R.; Ferrer, E. A comparative analysis of genetic relationships between rye cultivars using RFLP and RAPD markers. Euphytica 1996, 88, 107–115. [Google Scholar] [CrossRef]
  48. Karp, A.; Edwards, K.; Bruford, M.; Vosman, B.; Morgante, M.; Seberg, O.; Kremer, A.; Boursot, P.; Arctander, P.; Tautz, D.; et al. Newer molecular technologies for biodiversity evaluation: Opportunities and challenges. Nat. Biotechnol. 1997, 15, 625–628. [Google Scholar] [CrossRef]
  49. Susanna, A.; Baldwin, B.G.; Bayer, R.J.; Bonifacino, J.M.; Garcia-Jacas, N.; Keeley, S.C.; Mandel, J.R.; Ortiz, S.; Robinson, H.; Stuessy, T.F. The classification of the Compositae: A tribute to Vicki Ann Funk (1947–2019). Taxon 2020, 69, 807–814. [Google Scholar] [CrossRef]
  50. Funk, V.A.; Susanna, A.; Steussy, T.F.; Bayer, R.J. Systematics, Evolution, and Biogeography of Compositae; International Association for Plant Taxonomy: Vienna, Austria, 2009. [Google Scholar]
  51. El-Ghadban, E.A.E.; Abou El-leel, O.F.; Mahdy, E.M.B. Morphological, phytochemical and molecular characterization on some Jatropha species cultivated in Egypt. Int. J. Pharm. Sci. Scient. Res. 2017, 3, 1–13. Available online: https://biocoreopen.org/ijpsr/Morphological-Phytochemical-and-Molecular-Characterization-on-Some-Jatropha-Species-Cultivated-in-Egypt.php (accessed on 25 April 2022).
  52. Gemeinholzer, B.; Bachmann, K. Examining morphological and molecular diagnostic character states of Cichorium intybus L. (Asteraceae) and C. spinosum L. Plant Syst. Evol. 2005, 253, 105–123. [Google Scholar] [CrossRef]
  53. Souza, W. Técnicas Básicas de Microscopia Eletrônica Aplicadas às Ciências Biológicas; Sociedade Brasileira de Microscopia Eletrônica: Rio de Janeiro, Brazil, 2014; Available online: https://sbmm.org.br/category/eventos-e-cursos/ntos-e-cursos/ (accessed on 25 June 2022).
  54. Barthlott, W. Epidermal and seed surface characters of plants: Systematic applicability and some evolutionary aspects. Nord. J. Bot. 1981, 1, 345–355. [Google Scholar] [CrossRef]
  55. Garg, S.; Sharma, K. Taxonomical significance of the morphological and scanning electron microscopic surface patterns of cypselas in some members of the tribe Heliantheae (Asteraceae). Feddes Repert. 2007, 118, 165–191. [Google Scholar] [CrossRef]
  56. Mukherjee, S.K.; Nordenstam, B. Diversity of pappus structure in some tribes of the Asteraceae. Phytotaxonomy 2008, 8, 32–46. Available online: https://www.academia.edu/831236/ (accessed on 25 April 2022).
  57. Dilcher, D.L. Cuticular analysis of Eocene leaves of Lauraceae. Am. J. Bot. 1961, 48, 540. [Google Scholar]
  58. Nassar, M.A.; El-Sahhar, K.F. Botanical Preparations and Microscopy (Microtechnique). In Arabic; Academic Bookshop: Giza, Egypt, 1998. [Google Scholar]
  59. El-Taher, A.M.; Gendy, A.G.; Alkahtani, J.; Elshamy, A.I.; Abd-El-Gawad, A.M. Taxonomic implication of integrated chemical, morphological, and anatomical attributes of leaves of eight Apocynaceae taxa. Diversity 2020, 12, 334. [Google Scholar] [CrossRef]
  60. Stearn, W.T. Botanical Latin, 3rd ed.; Revised; David & Charles Publishers plc: London, UK, 1986; 566 p. [Google Scholar]
  61. Yang, T.J.; Park, H.G. Optimization of the RAPD analyses procedure in Capsicum annuum L. Korean J. Breed. 1998, 30, 16–23. [Google Scholar]
  62. Collard, B.C.Y.; Mackill, D.J. Start Codon Targeted (SCoT) Polymorphism: A simple, novel DNA marker technique for generating gene-targeted markers in plants. Plant Mol. Biol. Rep. 2009, 27, 86–93. [Google Scholar] [CrossRef]
  63. Jaccard, P. Nouvelles recherches sur la distribution florale. Bull. Soc. Vaud. Sci. Nat. 1908, 44, 223–270. [Google Scholar] [CrossRef]
  64. Nei, M.; Li, M. Mathematical model for studying genetic variation in terms of restriction endonucleases. Proc. Nat. Acad. Sci. USA 1979, 76, 5269–5273. [Google Scholar] [CrossRef] [PubMed]
  65. Peakall, R.; Smouse, P.E. GENALEX 6: Genetic analysis in Excel. Population genetic software for teaching and research. Mol. Ecol. Notes 2006, 6, 288–295. [Google Scholar] [CrossRef]
  66. Peakall, R.; Smouse, P.E. GenAlEx tutorials—Part 2: Genetic distance and analysis of molecular variance (AMOVA). Bioinformatics 2012, 28, 2537–2539. [Google Scholar] [CrossRef] [PubMed]
Figure 1. Leaf shapes of Cichorium taxa. (1): C. intybus var. intybus; (2): C. intybus var. foliosum; (3): C. endivia var. endivia; (4): C. endivia var. crispum; (5): C. endivia subsp. pumilum.
Plants 12 00388 g001
Figure 2. Light micrographs of cypsela and pappus in Cichorium: (1): C. intybus var. intybus; (2): C. intybus var. foliosum; (3): C. endivia var. endivia; (4): C. endivia var. crispum; (5): C. endivia subsp. pumilum.
Plants 12 00388 g002
Figure 3. SEM micrographs of cypsela and pappus in Cichorium: (A1,A2): C. intybus var. intybus; (B1,B2): C. intybus var. foliosum; (C1,C2): C. endivia var. endivia; (D1,D2): C. endivia var. crispum; (E1,E2): C. endivia subsp. pumilum.
Plants 12 00388 g003
Figure 4. SEM micrographs of stomata level and ornamentation in Cichorium: (A): C. intybus var. intybus; (B): C. intybus var. foliosum; (C): C. endivia var. endivia; (D): C. endivia var. crispum; (E): C. endivia subsp. pumilum.
Plants 12 00388 g004
Figure 5. Light micrographs of stomatal types in Cichorium: (1): Anisocytic stomata; (2): Anomocytic stomata; (3): Tetracytic stomata; (4): Stephanocytic stomata; (5): Associated stomata with middle lamella; (6): Straight epidermal cell wall.
Plants 12 00388 g005
Figure 6. Light micrographs of trichomes in Cichorium: subfigures (AD): non-glandular, subfigures (EH): glandular.
Plants 12 00388 g006
Figure 7. Band profiles of SCoT, ISSR, and RAPD markers. Lane 1: DNA ladder (100 bp), Lanes 2 to 6: Taxa 1 to 5 (From left to right).
Plants 12 00388 g007
Figure 8. Dendrogram of the relationships between the five taxa of Cichorium based on 33 morphological characters using UPGMA analysis.
Plants 12 00388 g008
Figure 9. Dendrograms classified the five taxa of Cichorium by three molecular markers using UPGMA analysis.
Plants 12 00388 g009aPlants 12 00388 g009b
Figure 10. Dendrogram of the relationships between the five taxa of Cichorium based on the combined morphological and molecular characters using UPGMA analysis.
Plants 12 00388 g010
Figure 11. DCCA Triplot of the distribution of the studied taxa and their relationships to morphological and molecular characters. Taxa: 1− C. intybus var. intybus, 2− C. intybus var. foliosum, 3− C. endivia var. endivia, 4− C. endivia var. crispum, 5− C. endivia subsp. pumilum. Characters: Le− leaf, Cy− Cypsela, Ep− epidermal, Tr−trichome, SC− SCoT, RA− RAPD, and IS− ISSR.
Plants 12 00388 g011
Table 1. Morphological characters of leaf and cypsela of Cichorium.
Attributes12345
LeafShape SpathulateSpathulatespathulateobovateoblancelate
Type SimpleSimplesimplepinnately lobedsimple
Petiole PresentPresentabsentabsentpresent
Margin Dentatefine dentatedentatedentatefine dentate
Apex ObtuseObtuseobtuseobtuseobtuse
MidribDistinctDistinctdistinctindistinctdistinct
Midrib color WhiteWhitewhitegreenwhite
Lateral venationDistinctnot distinctdistinctindistinctindistinct
Base SymmetricalSymmetricalsymmetricalsymmetricalsymmetrical
Venation ReticulateReticulatereticulatereticulatereticulate
Surface GlabrousGlabrousglabrousglabrousglabrous
Stipule StipulateStipulatestipulatestipulatestipulate
Radical leafPresentPresentpresentabsentpresent
CypselaColorcreamy shiny to black with creamycreamy shiny to dark brown with creamycreamy shiny to dark brown with creamypale creamy shiny to creamy with black pointcreamy shiny with few dark brown point
ShapeOblongoblong obovateoblongoblongoblong obovate
Length (mm)2.6–32.6–32.3–32.4–31.7–2.25
Width (mm)0.96–1.21.15–1.31.2–1.31.1–1.51–1.3
Size (L × W) (mm2)2.8 × 1.12.8 × 1.22.7 × 1.252.7 × 1.32.4 × 1.1
Texturesmooth with groovessmooth with groovessmooth with groovessmooth with groovessmooth with grooves
Hilum shapecircularcircularcircularcircularcircular
Surface patternsulcate papillatesulcate papillateweak sulcate papillateruminate- sulcateweak ruminate sulcate papillate
Anticlinal wall shapeStraightStraightstraightstraightstraight
Anticlinal walls RaisedRaisedslightly raisedslightly raisedslightly raised
Periclinal wallsConcaveConcaveslightly concaveslightly concaveslightly concave
Gonal (number)3–444–54–54–5
Pappus bristles (type)scabrous scalesscabrous scalespaleaceous scales to form crownpaleaceous scales to form crownpaleaceous scales to form crown
Pappus persistencePersistencePersistencepersistencepersistencepersistence
Pappus length ShortShortLongLongshort
1- Cichorium intybus var. intybus, 2- Cichorium intybus var. foliosum, 3- Cichorium endivia var. endivia, 4- Cichorium endivia var. crispum, and 5- Cichorium endivia subsp. pumilum.
Table 2. Micro-morphological characters of epidermis and trichome in the studied taxa.
Attribute12345
EpidermalEpidermal cell wall: (1) Straight. (2) Sinuous. 22121
Stomata leveling: (1) Superficial. (2) Semi-depressed. (3) Depressed.31221
Stomata typesAnisocytic stomata: (1) Present. (2) Absent.12112
Anomocytic stomata: (1) Present. (2) Absent.11111
Tetracytic stomata: (1) Present. (2) Absent. 12211
Stephanocytic stomata: (1) Present. (2) Absent.11211
Associated stomata with middle lamella: (1) Present. (2) Absent.22121
Sculpture: (1) Striate. (2) Reticulate.11211
TrichomeNon-glandular Papillae: (1) Present. (2) Absent.12122
Multicellular hairs with heterogeneous cells: (1) Present. (2) Absent.21222
Multicellular hairs with homogeneous cells: (1) Present (2) Absent22221
Shaggy hair: (1) Present (2) Absent12121
Glandular Multicellular uniseriate stalk and unicellular head with homogeneous cells: (1) Present (2) Absent22212
Multicellular uniseriate stalk and unicellular head with heterogeneous cells: (1) Present (2) Absent12211
Multicellular uniseriate stalk and bicellular head with homogeneous cells: (1) Present (2) Absent22122
Multicellular uniseriate stalk and bicellular head with homogeneous cells: (1) Present (2) Absent21222
Ornamentation: (1) Verrucose. (2) Smooth. (3) Ttuberculate & warty. (4) Smooth & warty 12234
1- C. intybus var. intybus, 2- C. intybus var. foliosum, 3- C. endivia var. endivia, 4- C. endivia var. crispum, and 5- C. endivia subsp. pumilum.
Table 3. Primer names, sequences (5’-3’), and their annealing temperatures (Ta), total, monomorphic, polymorphic, and unique bands, and polymorphism (%) for the three markers used in the study.
MarkerPrimerSequenceTm (℃)TBMBPBUB%P
RAPDOPA7GAAACGGGTG32623166.67
OPA9GGGTAACGCC34412175.00
OPB5TGCGCCCTTC37512280.00
OPC4CCGCATCTAC32211050.00
OPD5TGAGCGGACA38742142.86
OPA2TGCCGAGCTG43743042.86
OPC5GATGACCGCC40422050.00
OPC8TGGACCGGTG42633050.00
OPA10CTGCTGGGAC32734057.14
OPA18AGGTGACCGT327070100.0
Total552129561.82
ISSRHB 8(ga)6 gg44431025.00
HB 12(cac)3 gc4433000.00
HB 13(gag)3 gc44742142.86
ISSR 1cac (tcc)553532040.00
ISSR 3tgta (ca)753723271.43
UBC888tac (ca)747816187.50
UBC807(ag)8 t38942355.56
ISSR16cgtc (ac)744743042.86
ISSR 35tcga (ca)753651016.67
UBC834(ag)8 ct44541020.00
Total613321745.90
SCoTSCoT-02ACCATGGCTACCACCGGC50824275.00
SCoT-03ACGACATGGCGACCCACA571019090.00
SCoT-04ACCATGGCTACCACCGCA564040100.0
SCoT-05CAATGGCTACCACTAGCG551027180.00
SCoT-06CAATGGCTACCACTACAG55715185.71
SCoT-09ACAATGGCTACCACTGCC55734057.14
SCoT-11ACAATGGCTACCACTACC50843150.00
SCoT-12CAACAATGGCTACCACCG61633050.00
SCoT-13ACCATGGCTACCACGGCA61651016.67
SCoT-14ACCATGGCTACCAGCGCG55431025.00
Total702441565.71
Overall Total18678911758.06
Total bands (TB), monomorphic bands (MB), polymorphic bands (PB), unique bands (UB), percentage of polymorphism (%P).
Table 4. Proximity matrix using Jaccard coefficient among the taxa of Cichorium.
Taxa12345
ISSR1C. intybus var. intybus 1.00
2C. intybus var. foliosum0.76 1.00
3C. endivia var. endivia0.710.86 1.00
4C. endivia var. crispum0.700.720.77 1.00
5C. endivia subsp. Pumilum0.670.680.730.79 1.00
SCoT1C. intybus var. intybus1.00
2C. intybus var. foliosum0.711.00
3C. endivia var. endivia0.530.61 1.00
4C. endivia var. crispum0.480.530.651.00
5C. endivia subsp. Pumilum0.550.600.610.731.00
RAPD1C. intybus var. intybus1.00
2C. intybus var. foliosum0.88 1.00
3C. endivia var. endivia0.660.69 1.00
4C. endivia var. crispum0.550.580.601.00
5C. endivia subsp. Pumilum0.580.600.590.681.00
Combined1C. intybus var. intybus 1.00
2C. intybus var. foliosum0.77 1.00
3C. endivia var. endivia0.630.72 1.00
4C. endivia var. crispum0.570.610.68 1.00
5C. endivia subsp. Pumilum0.600.630.650.731.00
Colors range from lowest value (red) through medium value (yellow) to highest value (green).
Table 5. Distances to centroids between the classes of taxa.
ClassIIIIII
RAPDNo. of taxa212
Within-class variance2.50000.00008.0000
Minimum distance to centroid1.11800.00002.0000
Average distance to centroid1.11800.00002.0000
Maximum distance to centroid1.11800.00002.0000
ISSRNo. of taxa122
Within-class variance0.00003.50005.5000
Minimum distance to centroid0.00001.32291.6583
Average distance to centroid0.00001.32291.6583
Maximum distance to centroid0.00001.32291.6583
SCoTNo. of taxa212
Within-class variance8.50000.00007.5000
Minimum distance to centroid2.06160.00001.9365
Average distance to centroid2.06160.00001.9365
Maximum distance to centroid2.06160.00001.9365
CombinedNo. of taxa212
Within-class variance17.50000.000021.0000
Minimum distance to centroid2.95800.00003.2404
Average distance to centroid2.95800.00003.2404
Maximum distance to centroid2.95800.00003.2404
Table 6. Variance decomposition for the optimal classification.
ClassAbsolutePercent
RAPDWithin class5.2559.66%
Between classes3.5540.34%
ISSRWithin class4.563.38%
Between classes2.636.62%
SCoTWithin class865.57%
Between classes4.234.43%
CombinedWithin class19.2569.00%
Between classes8.6531.00%
Disclaimer/Publisher’s Note: The statements, opinions and data contained in all publications are solely those of the individual author(s) and contributor(s) and not of MDPI and/or the editor(s). MDPI and/or the editor(s) disclaim responsibility for any injury to people or property resulting from any ideas, methods, instructions or products referred to in the content.

